

Abstract
Background & objectives:
Imatinib is the standard first-line treatment for chronic myeloid leukaemia (CML) patients. About 20 to 30 per cent patients develop resistance to imatinib and fail imatinib treatment. One of the mechanisms proposed is varying expression levels of the drug transporters. This study was aimed to determine the expression levels of imatinib transporter genes (OCT1, ABCB1, ABCG2) in CML patients and to correlate these levels with molecular response.
Methods:
Sixty three CML chronic phase patients who were on 400 mg/day imatinib for more than two years were considered for gene expression analysis study for OCT1, ABCB1 and ABCG2 genes. These were divided into responders and non-responders. The relative transcript expression levels of the three genes were compared between these two categories. The association between the expression values of these three genes was also determined.
Results:
No significant difference in the expression levels of OCT1, ABCB1 and ABCG2 was found between the two categories. The median transcript expression levels of OCT1, ABCB1 and ABCG2 genes in responders were 26.54, 10.78 and 0.64 versus 33.48, 7.09 and 0.53 in non-responders, respectively. A positive association was observed between the expression of the ABCB1 and ABCG2 transporter genes (r=0.407, P<0.05) while no association was observed between the expression of either of the ABC transporter genes with the OCT1 gene.
Interpretation & conclusions:
Our findings demonstrated that the mRNA expression levels of imatinib transporter genes were not correlated with molecular response in CML patients. Further studies need to be done on a large sample of CML patients to confirm these findings.
Keywords: ABCB1, ABCG2, chronic myeloid leukemia (CML), chronic phase, imatinib, molecular response, mRNA expression, OCT1
Imatinib mesylate (IM) is the standard first-line treatment for chronic myeloid leukaemia (CML) patients. Despite the initial high response rate to imatinib (both haematologic and cytogenetic), approximately 20-30 per cent of patients with newly diagnosed chronic phase CML treated with imatinib do not achieve a complete cytogenetic response (CCyR) within one year of treatment and fail IM treatment1. Resistance to imatinib can be categorized as primary or secondary. Primary resistance is the failure to achieve any of the landmark responses established by the European Leukemia Net (ELN) or National Comprehensive Cancer Network (NCCN) guidelines2. Primary resistance can be further divided into primary haematologic resistance, which occurs in 2-4 per cent of cases who fail to normalize peripheral counts within 3-6 months of initiation of treatment; or primary cytogenetic resistance, which is more common, and occurs in approximately 15-25 per cent of patients who fail to achieve any level of cytogenetic response (CyR) at six months, a major CyR (MCyR) at 12 months or a CCyR at 18 months3. Loss of a previously obtained response to imatinib (secondary or acquired resistance) occurs in about 20 to 25 per cent of patients that reach complete haematologic response (CHR) and/or CCyR4. Several mechanisms of imatinib resistance have been identified and these include a several-fold increase in the amount of B cell receptor - Abelson tyrosine kinase (BCR-ABL) protein, amplification of the BCR-ABL gene5, BCR-ABL kinase domain mutations6, treatment compliance7, bioavailability, pharmacodynamics, genetic changes, changes in expression levels of drug transporters which include overexpression of imatinib efflux transporters (MDR1 and BCRP) and low expression of imatinib influx transporters (OCT1)8,9. Drug efflux proteins have been extensively studied, and their overexpression has been frequently implicated as a cause of resistance, in several diseases10. The best documented efflux pump is the P-glycoprotein (P-gp) (ABCB1 or MDR1) that reduces the levels of imatinib before it binds to BCR-ABL6. The overexpression of P-gp has been shown to occur in one BCR-ABL positive, imatinib-resistant cell line, LAMA84-r11. In addition, overexpression of the multi drug resistance 1 (MDR1) gene in the BCR-ABL positive AR230 cell line decreases its sensitivity to imatinib, whereas verapamil, an inhibitor of P-gp, reverses this effect8. These data suggest a possible role for MDR1 overexpression in imatinib resistance, although evidence of this phenomenon occurring in patients is lacking. In addition to P-gp, there are two other drug transporters that are thought to play a role in imatinib resistance- breast cancer resistance protein (BCRP) and human organic cation transporter1 (OCT1). Imatinib has been shown to be a substrate for BCRP drug efflux proteins [also known as mitoxantrone resistance protein (MXR), ATP-binding cassette (ABC)-G-2 (ABCG2)] and placenta ABC protein (ABC-P)12. ABCG2 was shown to confer in vitro resistance against various cytotoxic compounds used in the treatment of cancer patients13,14. In vivo studies of patients undergoing chemotherapy revealed that ABCG2 was overexpressed in several tumours15,16,17. In most of these cases, ABCG2 overexpression correlated with lower response rate to chemotherapy, increased drug resistance and shorter duration of patient survival15,17.
In contrast to overexpression of drug efflux proteins, the inhibition of the OCT1 protein causes the resistance to imatinib because of the limited entrance into the cell18. It has been proposed that decreased mRNA expression levels of OCT1 may result in decreased intracellular concentration of imatinib. The consequences are that cells might become resistant to imatinib19. Since OCT1 actively transports imatinib into cells, patients with low baseline expression of OCT1 may be unable to achieve adequate intracellular concentrations of imatinib, and hence fail to achieve a cytogenetic response. It is also found that the patients with high pretreatment OCT1 expression had superior CCyR rates, progression-free and overall survival and the pretreatment OCT1 expression was the most powerful predictor of CCyR achievement at six months9. Thus, the expression level of OCT1 is an important factor in determining the clinical response to imatinib. In the present study, we determined the relative expression levels of imatinib transporter genes (OCT1, ABCB1, ABCG2) in CML patients by quantitative real time polymerase chain reaction (RQ-PCR) and correlated these levels with molecular response.
Material & Methods
Patients: Sixty three CML-chronic phase patients attending OPD at the division of Medical Oncology, department of Medicine, SMS Medical College, Jaipur, India, during June 2010 to May 2013 and who were on imatinib (400 mg/day) for more than two years were considered for gene expression analysis study for OCT1, ABCB1 and ABCG2. The baseline characteristics studied included age, sex, spleen size, haemoglobin level, basophil, WBC and, platelet count, peripheral blasts, and Sokal score. Of the 63 CML patients, 47 were males. Eleven healthy individuals from the laboratory staff served as controls. Informed written consent was taken from all the patients for participation in this study. The study protocol was approved by the Ethics Committee of the institution. The patients were divided into two groups: responders (n=44): patients who achieved a complete molecular response (CMR) or a major molecular response (MMR) (BCR/ABL: ABL ratio <1% as assessed by RQ-PCR) and non-responders (n=19): those without CMR or MMR (BCR/ABL: ABL ratio ≥ 1% as assessed by RQ-PCR). For BCR-ABL quantification, the plasmid DNA standards having copy numbers 5×10³, 5×10⁴, 5×10⁵, 5×10⁶, 5×10⁷ were used as calibrators for generation of standard curves for both BCR-ABL and ABL. Reactions were performed on ABI PRISM 7700 SDS (Applied Biosystems, USA) instrument. The reaction conditions and the primer and probe sequences for BCR-ABL and ABL were the same as described previously20. RQ-PCR results were analyzed using the standard curves which were used to calculate the quantity of BCR-ABL and ABL transcript (copy numbers) in the samples. Change in the BCR-ABL transcript level was expressed as the ratio of BCR-ABL/ABL. The relative transcript expression levels of the three genes were compared between responders and non-responders. The differences in the mRNA expression of all the target genes between the CML and healthy control groups were also compared.
RNA extraction and cDNA synthesis: Peripheral blood sample (10 ml) was collected in EDTA from each patient and was kept at 4°C until further processing. Sample was processed within two hours of collection. The mononuclear cells were separated using RBC lysis method21 and the total RNA was extracted using Trizol reagent (Invitrogen, USA) according to the manufacturer's instructions. The yield, concentration and purity of the RNA were assessed using Infinite 200 PRO NanoQuant (TECAN, Switzerland) and only those samples with A260 to A280 ratios between 1.9 to 2.1 were further considered. Total RNA (2 μg) was reverse transcribed with the High Capacity RNA-to-cDNA kit (Applied Biosystems, USA) in a final volume of 20 µl according to the manufacturer's instructions. cDNA was then used for PCR amplification.
Quantitative real time PCR: For amplification of the three target genes (OCT1, ABCB1 and ABCG2), Taqman Gene Expression Assays (Serial No. Hs00184500_m1 for ABCB1, Hs00427552_m1 for OCT1, Hs01053790_m1 for ABCG2, Applied Biosystems, USA) were used. BCR was selected as a reference gene. The expression levels of BCR gene were measured using the TaqMan Gene Expression Assay (Hs01036532_m1). The efficiency of each assay was determined and it was over 90 per cent for all assays. Efficiency values were measured using the Ct (threshold cycle) slope method. A dilution series of the target template was prepared and Ct value for each dilution was determined. A plot of Ct versus log cDNA concentration was constructed. Amplification efficiency was calculated from the slope of this graph using the equation: E = 10(-1/slope) – 122. Amplification reactions were carried out with a ABI 7500 Fast Dx real time PCR instrument in a total volume of 20µl using a TaqMan Gene Expression Master Mix (Applied Biosystems, USA) following the manufacturer's instructions. PCR amplification for each sample was performed in duplicates. No template controls (NTC) in duplicates were included in each run. With each amplification cycle, the increase in fluorescence intensity is proportional to the increase in amplicon concentration, with the quantitative PCR instrument system collecting data for each sample during each PCR cycle. The fluorescence signal was measured in the extension phase of the PCR reaction, and the measurement, proportional to the quantity of sample cDNA in the reaction, was plotted as an amplification curve against cycle number in the real time PCR instrument. The amplification plot of OCT1, ABCB1 and ABCG2 genes are shown in Figs. 1, 2 and 3, respectively that show the variation of log (ΔRn) with PCR cycle number. ΔRn is Rn minus the baseline. Rn is the fluorescence of the reporter dye divided by the fluorescence of a passive reference dye; i.e. Rn is the reporter signal normalized to the fluorescence signal of ROX. The Ct values of amplification curves are different for each patient depending on the level of the gene expressed. The threshold cycle is the cycle number at which the fluorescent signal of the reaction crosses the threshold. This Ct value can be directly correlated with the starting target concentration of the sample. A threshold value of fluorescence in the exponential part of the amplification curve was selected and, for each sample, duplicate Ct values were averaged. The ABI 7500 software (version 2.0.6) was used for calculation of relative gene expression levels by the 2-ΔΔCt method23 using a sample of K562 cell line as a calibrator. Relative expression results were representative of the fold differences.
Fig. 1.
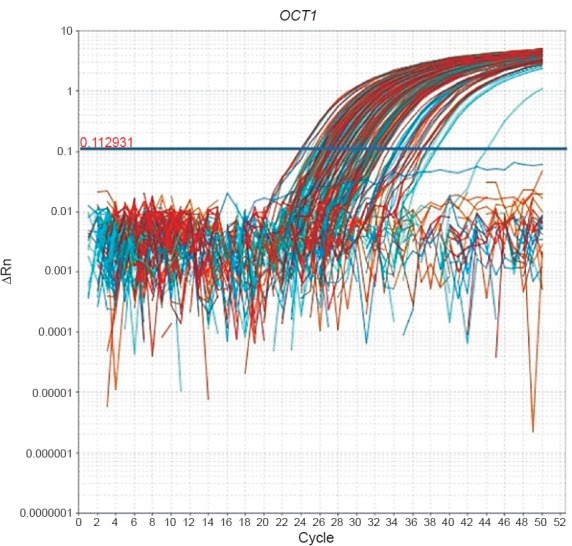
Amplification plot of OCT1 gene of CML patients.
Fig. 2.
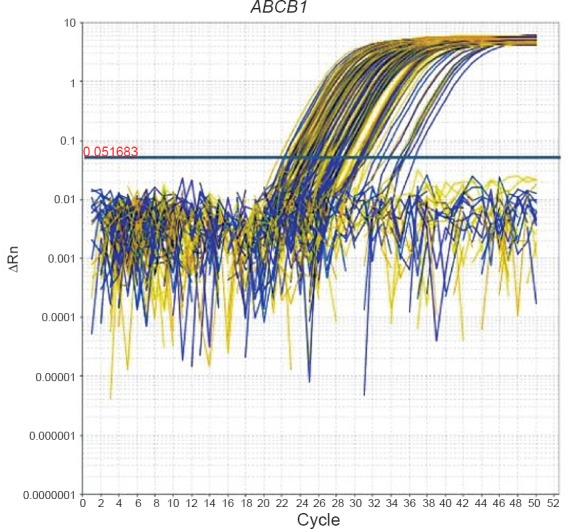
Amplification plot of ABCB1 gene of CML patients.
Fig. 3.
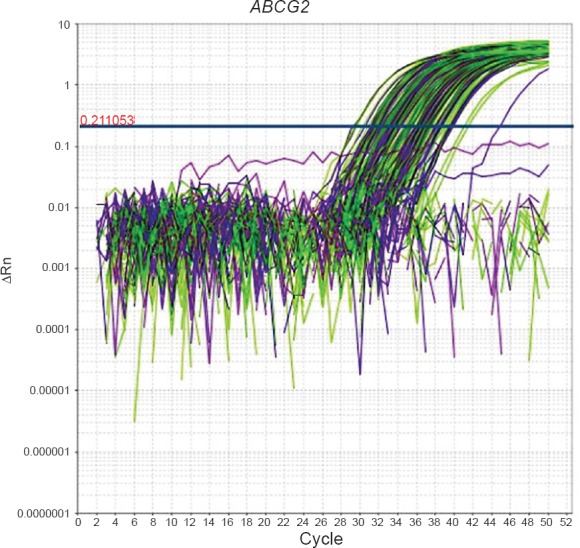
Amplification plot of ABCG2 gene of CML patients.
Statistical analysis: The differences in relative expression levels (RQ values) for all the genes between the studied groups (responders vs non-responders) and (CML patients vs healthy controls) were statistically analyzed, using the non-parametric Mann-Whitney
U-test. The correlation between the expression values of the genes studied was determined by the Spearman's rank correlation coefficient. Chi square test was done for comparison of proportions. All statistical tests were performed using Graphpad prism trial version 6.
Results
Sixty three CML patients were included in this study. The patients’ baseline characteristics are shown in the Table. Mean age of the patients was 36 ± 11 yr with a range of 18-59 yr. The male (N=47) to female (N=16) ratio was 3:1. Of the 63 CML patients, 19 (30.15%) were in low Sokal risk category, 24 (38.10 %) were in intermediate and 20 (31.75%) patients were in high risk category. The haemoglobin levels in these patients ranged from 6.5-16.8 g/dl with a median value of 10.8 g/dl.
Table I.
Baseline characteristics of the patients (n=63).
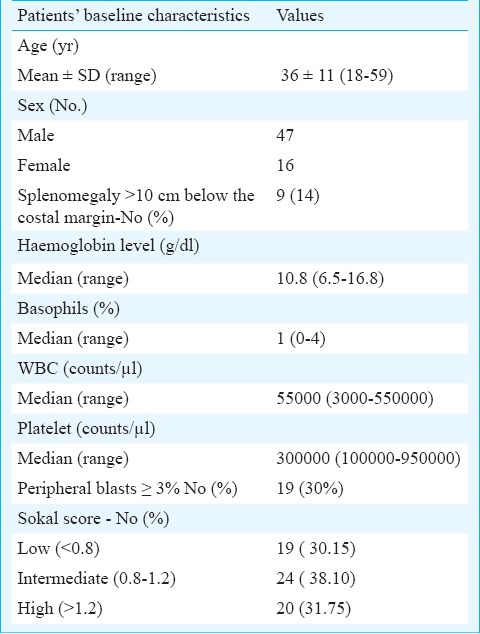
Maximum numbers of participants were in the age group 30-40 yr. Forty four patients who achieved either CMR or MMR were included in responders category, while 19 patients who did not achieved either CMR or MMR were included in non-responders. The mean age of responders was 34.66±10.78 yr while that of non-responders was 39.58±11.75 yr. The relative transcript expression levels of OCT1, ABCB1 and ABCG2 genes were compared between responders and non-responders categories of CML patients. No significant difference in the expression levels of these genes was found between the two categories. The median transcript expression levels of OCT1, ABCB1 and ABCG2 genes in responders were 26.54, 10.78 and 0.64 versus 33.48, 7.09 and 0.53 in non-responders, respectively. Also, the mRNA expression levels of OCT1, ABCB1 and ABCG2 transporter genes of CML patients (N=63) were compared with those of the healthy controls (N=11). The mRNA expression levels of these three transporter genes in CML patients differed significantly from those of healthy controls (P < 0.05).
Irrespective of the response to treatment, a positive correlation was observed between the expression of the ABCB1 and ABCG2 transporter genes (r=0.407, P<0.05) while there was no correlation between the expression of either of the ABC transporter genes with the OCT1 gene.
Discussion
In our study, we examined the mRNA expression levels of imatinib transporters and explored a relationship between the expression levels of the transporter genes and molecular response in CML patients on imatinib therapy. The relative transcript expression levels of OCT1, ABCB1 and ABCG2 transporter genes were compared between responders and non-responders categories and no significant difference was found. These results do not support some of the earlier studies9,24,25 in which it has been reported that the expression of OCT1 is an important determinant of the clinical response to imatinib mesylate (IM) since patients with high pre-treatment expression had superior CCyR rates, progression-free and overall survival. These studies have suggested that measuring OCT1 expression may be useful for risk stratification in CML patients. However, other studies have reported that OCT1 expression is not a good predictor of molecular response in CML patients26,27. OCT1 protein activity rather than OCT1 mRNA expression was found to be a strong determinant of responses in CML patients in some studies28,29. In a study by White et al28, OCT1 activity was measured in pre-therapy blood from CML patients and the patients were then categorized as having high and low OCT1 activity. Of patients with high OCT1 activity, 85 per cent achieved MMR by 24 months, versus 45 per cent with low OCT1 activity. However, mRNA analysis did not reveal a group of patients with suboptimal response or at risk for imatinib failure. The authors concluded that OCT1 activity along with plasma imatinib level, that has been found to be a predictor of cytogenetic and molecular response in CML patients in previous studies30,31,32,33, may help in individualized optimization of imatinib dose. In a subsequent study by these authors, the expression of OCT1 mRNA and the prediction of long-term response were examined in 46 patients and it was found that dividing patients into low and high OCT1 expression around the median level was not predictive of MMR or CMR29. Thus, the studies investigating the impact of OCT-1 expression in predicting responses in CML patients present conflicting data. Additionally, in a study by Nies et al27, it has been reported that the cellular uptake of imatinib is independent of OCT1. The authors used a combination of in vivo and in vitro approaches to investigate whether OCT1 transports imatinib and also to study the OCT1 expression at mRNA and protein level in leukaemic cell lines and CD34+ CML cells. Their results suggest that OCT1 does not transport imatinib and its expression is not a valid biomarker for imatinib response. These results are inconsistent with those studies reporting associations between OCT1 mRNA levels and clinical outcome of imatinib therapy9,24,25.
Imatinib is also a substrate for the ABCB1 and ABCG2 transporters that could limit the therapeutic potential of imatinib by multidrug resistance phenomenon. The overexpression of ABCB1 gene in the BCR-ABL positive AR230 cell line has shown to decrease its sensitivity to imatinib8. Also, the ABCB1 and ABCG2 genes were found to be overexpressed in the majority of resistant cell lines when the expression profile of ABCB1, ABCG2, and other genes was evaluated34. However, when the expression levels of ABCB1 and ABCG2 were determined prior to imatinib therapy and correlated with response in CML patients, no significant difference in the expression levels was found in responders and non-responder categories of CML patients and it was concluded that that the expression levels of ABC transporters was not correlated with the clinical outcome in CML patients9,24. At present, very little data on ABCB1 and ABCG2 gene expression are available in clinical CML samples. In our study, we did not find any correlation between the expression levels of imatinib efflux transporters (ABCB1 and ABCG2) and the patients’ responses to imatinib therapy. However, further studies in a large sample of patients are required to confirm these findings.
Our results also showed that a moderately positive correlation existed between the expression of the ABCB1 and ABCG2 transporter genes while there was no correlation between the expression of either of the ABC transporter genes with the OCT1 gene. These results were in partial support of a previous study35 which showed no association between the expression levels of OCT1 and ABCG2 transporters while a moderate positive association existed between the expression levels of OCT1 and ABCB1 transporters. In contrast, the results of another study36 have shown that OCT1 expression is significantly interrelated with the expression of ABCB1 and ABCG2 genes. We also found a positive correlation between the expression levels of ABCB1 and ABCG2 transporters in our study.
In conclusion, the mRNA expression levels of imatinib transporter genes may not correlate with molecular response in CML patients. However, further work is needed to explore the association of imatinib transporters with clinical response in a large sample of CML patients.
References
- 1.deLavallade H, Apperley JF, Khorashad JS, Milojkovic D, Reid AG, Bua M, et al. Imatinib for newly diagnosed patients with chronic myeloid leukemia: Incidence of sustained responses in an intention-to-treat analysis. J Clin Oncol. 2008;26:3358–63. doi: 10.1200/JCO.2007.15.8154. [DOI] [PubMed] [Google Scholar]
- 2.Baccarani M, Deininger MW, Rosti G, Hochhaus A, Soverini S, Apperley JF, et al. European LeukemiaNet recommendations for the management of chronic myeloid leukemia: 2013. Blood. 2013;122:872–84. doi: 10.1182/blood-2013-05-501569. [DOI] [PMC free article] [PubMed] [Google Scholar]
- 3.Bhamidipati PK, Kantarjian H, Cortes J, Cornelison AM, Jabbour E. Management of imatinib-resistant patients with chronic myeloid leukemia. Ther Adv Hematol. 2013;4:103–17. doi: 10.1177/2040620712468289. [DOI] [PMC free article] [PubMed] [Google Scholar]
- 4.Milojkovic D, Apperley J. Mechanisms of resistance to imatinib and second-generation tyrosine inhibitors in chronic myeloid leukemia. Clin Cancer Res. 2009;15:7519–27. doi: 10.1158/1078-0432.CCR-09-1068. [DOI] [PubMed] [Google Scholar]
- 5.Hochhaus A, Kreil S, Corbin AS, La Rosee P, Muller MC, Lahaye T, et al. Molecular and chromosomal mechanisms of resistance to imatinib (STI571) therapy. Leukemia. 2002;16:2190–6. doi: 10.1038/sj.leu.2402741. [DOI] [PubMed] [Google Scholar]
- 6.Gorre ME, Mohammed M, Ellwood K, Hsu N, Paquette R, Rao PN, et al. Clinical resistance to STI571 cancer therapy caused by BCR-ABL gene mutation or amplification. Science. 2001;293:876–80. doi: 10.1126/science.1062538. [DOI] [PubMed] [Google Scholar]
- 7.Marin D, Bazeos A, Mahon FX, Eliasson L, Milojkovic D, Bua M, et al. Adherence is the critical factor for achieving molecular responses in patients with chronic myeloid leukemia who achieve complete cytogenetic responses on imatinib. J Clin Oncol. 2010;28:2381–8. doi: 10.1200/JCO.2009.26.3087. [DOI] [PMC free article] [PubMed] [Google Scholar]
- 8.Mahon FX, Belloc F, Lagarde V, Chollet C, Moreau-Gaudry F, Reiffers J, et al. MDR1 gene overexpression confers resistance to imatinib mesylate in leukemia cell line models. Blood. 2003;101:2368–73. doi: 10.1182/blood.V101.6.2368. [DOI] [PubMed] [Google Scholar]
- 9.Wang L, Giannoudis A, Lane S, Williamson P, Pirmohamed M, Clark RE. Expression of the uptake drug transporter h ocT1 is an important clinical determinant of the response to imatinib in chronic myeloid leukemia. Clin Pharmacol Ther. 2008;83:258–64. doi: 10.1038/sj.clpt.6100268. [DOI] [PubMed] [Google Scholar]
- 10.Arceci RJ. Clinical significance of P-glycoprotein in multidrug resistance malignancies. Blood. 1993;81:2215–22. [PubMed] [Google Scholar]
- 11.le Coutre P, Tassi E, Varella-Garcia M, Barni R, Mologni L, Cabrita G, et al. Induction of resistance to the Abelson inhibitor STI571 in human leukemic cells through gene amplification. Blood. 2000;95:1758–66. [PubMed] [Google Scholar]
- 12.Burger H, van Tol H, Boersma AW, Brok M, Wiemer EA, Stoter G, et al. Imatinib mesylate (STI571) is a substrate for the breast cancer resistance protein (BCRP)/ABCG2 drug pump. Blood. 2004;104:2940–2. doi: 10.1182/blood-2004-04-1398. [DOI] [PubMed] [Google Scholar]
- 13.Robey RW, Medina-Perez WY, Nishiyama K, Lahusen T, Miyake K, Litman T, et al. Overexpression of the ATP-binding cassette half-transporter, ABCG2 (Mxr/BCrp/ABCP1), in flavopiridol-resistant human breast cancer cells. Clin Cancer Res. 2001;7:145–52. [PubMed] [Google Scholar]
- 14.Volk EL, Farley KM, Wu Y, Li F, Robey RW, Schneider E. Overexpression of wild-type breast cancer resistance protein mediates methotrexate resistance. Cancer Res. 2002;62:5035–40. [PubMed] [Google Scholar]
- 15.Friedrich RE, Punke C, Reymann A. Expression of multi-drug resistance genes (mdr1, mrp1, bcrp) in primary oral squamous cell carcinoma. In Vivo. 2004;18:133–47. [PubMed] [Google Scholar]
- 16.Hirschmann-Jax C, Foster AE, Wulf GG, Nuchtern JG, Jax TW, Gobel U, et al. A distinct “side population” of cells with high drug efflux capacity in human tumor cells. Proc Natl Acad Sci USA. 2004;101:4228–33. doi: 10.1073/pnas.0400067101. [DOI] [PMC free article] [PubMed] [Google Scholar]
- 17.Kawabata S, Oka M, Soda H, Shiozawa K, Nakatomi K, Tsurutani J, et al. Expression and functional analyses of breast cancer resistance protein in lung cancer. Clin Cancer Res. 2003;9:3052–7. [PubMed] [Google Scholar]
- 18.Chuah C, Melo JV. Targeted treatment of imatinib-resistant chronic myeloid leukemia: Focus on dasatinib. Onco Targets Ther. 2009;2:83–94. doi: 10.2147/ott.s3971. [DOI] [PMC free article] [PubMed] [Google Scholar]
- 19.Thomas J, Wang L, Clark RE, Pirmohamed M. Active transport of imatinib into and out of cells: implications for drug resistance. Blood. 2004;104:3739–45. doi: 10.1182/blood-2003-12-4276. [DOI] [PubMed] [Google Scholar]
- 20.Guo JQ, Lin H, Kantarjian H, Talpaz M, Champlin R, Andreeff M, et al. Comparison of competitive-nested PCR and real-time PCR in detecting BCR-ABL fusion transcripts in chronic myeloid leukemia patients. Leukemia. 2002;16:2447–53. doi: 10.1038/sj.leu.2402730. [DOI] [PubMed] [Google Scholar]
- 21.Foroni L, Wilson G, Gerrard G, Mason J, Grimwade D, White HE, et al. Guidelines for the measurement of BCR-ABL1 transcripts in chronic myeloid leukaemia. Br J Haematol. 2011;153:179–90. doi: 10.1111/j.1365-2141.2011.08603.x. [DOI] [PubMed] [Google Scholar]
- 22.Application note TaqMan® Gene expression assays. [accessed on July 20, 2015]. Available from: http://www.tamu.edu/faculty/riggs/BIOT602/qPCR_efficiency.pdf .
- 23.Livak KJ, Schmittgen TD. Analysis of relative gene expression data using realtime quantitative PCR and the 2∆∆C(T) method. Methods. 2001;25:402–8. doi: 10.1006/meth.2001.1262. [DOI] [PubMed] [Google Scholar]
- 24.Crossman LC, Druker BJ, Deininger MW, Pirmohamed M, Wang L, Clark RE. hOCT1 and resistance to imatinib. Blood. 2005;106:1133–4. doi: 10.1182/blood-2005-02-0694. [DOI] [PubMed] [Google Scholar]
- 25.Nardinelli L, Sanabani SS, Didone A, Ferreira PdeB, Serpa M, Novaes MM, et al. Pretherapeutic expression of the hOCT1 gene predicts a complete molecular response to imatinib mesylate in chronic-phase chronic myeloid leukemia. Acta Haematol. 2012;127:228–34. doi: 10.1159/000336610. [DOI] [PubMed] [Google Scholar]
- 26.Mascarenhas CC, Almeida MH, Miranda EC, Virgilio B, Delamain MT, Duarte GO, et al. Evaluation of hOCT1 expression in patients with chronic myeloid leukemia (CML) treated with imatinib in first line. Blood. 2013;122:4041. [Google Scholar]
- 27.Nies AT, Schaeffeler E, van der Kuip H, Cascorbi I, Bruhn O, Kneba M, et al. Cellular uptake of imatinib into leukemic cells is independent of human organic cation transporter 1 (OCT1) Clin Cancer Res. 2014;20:985–94. doi: 10.1158/1078-0432.CCR-13-1999. [DOI] [PMC free article] [PubMed] [Google Scholar]
- 28.White DL, Saunders VA, Dang P, Engler J, Venables A, Zrim S, et al. Most CML patients who have a suboptimal response to imatinib have low OCT-1 activity: higher doses of imatinib may overcome the negative impact of low OCT-1 activity. Blood. 2007;110:4064–72. doi: 10.1182/blood-2007-06-093617. [DOI] [PubMed] [Google Scholar]
- 29.White DL, Dang P, Engler J, Frede A, Zrim S, Osborn M, et al. Functional activity of the OCT-1 protein is predictive of long-term outcome in patients with chronic-phase chronic myeloid leukemia treated with imatinib. J Clin Oncol. 2010;28:2761–7. doi: 10.1200/JCO.2009.26.5819. [DOI] [PubMed] [Google Scholar]
- 30.Picard S, Titier K, Etienne G, Teilhet E, Ducint D, Bernard MA, et al. Trough imatinib plasma levels are associated with both cytogenetic and molecular responses to standard-dose imatinib in chronic myeloid leukemia. Blood. 2007;109:3496–9. doi: 10.1182/blood-2006-07-036012. [DOI] [PubMed] [Google Scholar]
- 31.Larson RA, Druker BJ, Guilhot F, O’Brien SG, Riviere GJ, Krahnke T, et al. IRIS (International Randomized Interferon VSST1571 Study Group. Imatinib pharmacokinetics and its association with response and safety in chronic-phase chronic myeloid leukemia: a subanalysis of the IRIS study. Blood. 2008;111:4022–8. doi: 10.1182/blood-2007-10-116475. [DOI] [PubMed] [Google Scholar]
- 32.Awidi A, Ayed AO, Bsoul N, Magablah A, Mefleh R, Dweiri M, et al. Relationship of serum imatinib trough level and response in CML patients: long term follow-up. Leuk Res. 2010;34:1573–5. doi: 10.1016/j.leukres.2010.07.014. [DOI] [PubMed] [Google Scholar]
- 33.Malhotra H, Sharma P, Bhargava S, Rathore OS, Malhotra B, Kumar M. Correlation of plasma trough levels of imatinib with molecular response in patients of chronic myeloid leukemia (CML): A single institution study from India. Leuk Lymphoma. 2014;55:2614–9. doi: 10.3109/10428194.2014.885515. [DOI] [PubMed] [Google Scholar]
- 34.Gromicho M, Dinis J, Magalhaes M, Fernandes AR, Tavares P, Laires A, et al. Development of imatinib and dasatinib resistance: dynamics of expression of drug transporters ABCB1, ABCC1, ABCG2, MVP, and SLC22A1. Leuk Lymphoma. 2011;52:1980–90. doi: 10.3109/10428194.2011.584005. [DOI] [PubMed] [Google Scholar]
- 35.Gromicho M, Magalhaes M, Torres F, Dinis J, Fernandes AR, Rendeiro P, et al. Instability of mRNA expression signatures of drug transporters in chronic myeloid leukemia patients resistant to imatinib. Oncol Rep. 2013;29:741–50. doi: 10.3892/or.2012.2153. [DOI] [PubMed] [Google Scholar]
- 36.Hu S, Franke RM, Filipski KK, Hu C, Orwick SJ, de Bruijn EA, et al. Interaction of imatinib with human organic ion carriers. Clin Cancer Res. 2008;14:3141–8. doi: 10.1158/1078-0432.CCR-07-4913. [DOI] [PubMed] [Google Scholar]