

Abstract
Fetal exposure to five parabens was investigated due to their endocrine-disrupting potential and possible impact on fetal development. Body burdens occurring from real-world exposures were determined typically as total concentrations after conjugate hydrolysis in 181 maternal urine and 38 umbilical cord blood plasma samples from a multiethnic cohort of 185 predominantly-black, pregnant women recruited in Brooklyn, New York between 2007/9. For 33 participants, both sample types (maternal urine and cord blood) were available. Methyl- (MePB), ethyl- (EtPB), propyl- (PrPB), butyl- (BuPB), and benzylparaben (BePB) were detected in 100, 73.5, 100, 66.3 and 0.0% of the urine samples at median concentrations of 279, 1.44, 75.3, 0.39, and <0.02 μg/L, respectively. Median concentrations of MePB and PrPB were, respectively 4.4- and 8.7-fold higher compared to those reported previously for the general U.S. population (NHANES, 2005/6). Listed in the order above, the five parabens were detected in 97.4, 94.7, 47.4, 47.4, and 44.7% of cord blood plasma samples at median total concentrations of 25.0, 0.36, <0.27, <0.09, and <0.10 μg/L, respectively. Free MePB, EtPB, and PrPB were detected in a subset of cord blood plasma samples at, respectively, 3.9, 71.7, and 6.4% of their total concentrations, whereas free BuPB and BePB were not detected. Literature data and those reported here show the urban community studied here to rank highest in the world for MePB and PrPB exposure in pregnant women, whereas it ranks among the lowest for EtPB and BuPB. This study is the first to report the occurrence of parabens in human umbilical cord blood. Maternal exposure to parabens is widespread, and substantial differences were found to exist between communities and countries both in the spectrum and degree of paraben exposures.
Keywords: Paraben, Preservative, Endocrine disruption, Antimicrobial, Personal care products
Graphical abstract
1. Introduction
Human exposure to parabens mostly is the result of their use as preservatives in personal care products, pharmaceuticals, and foodstuff, although they also occur naturally in certain fruits and vegetables.1-4 Parabens are identified by their aliphatic or aromatic alkyl moieties, with methyl- (MePB), ethyl- (EtPB), propyl- (PrPB), butyl- (BuPB), and benzylparaben (BePB) representing the most commonly used members of this class of alkyl esters of p-hydroxybenzoic acid (PHBA).5 Parabens have been used for decades and, when used within the recommended doses, are categorized as “generally recognized as safe (GRAS)” by the European Union6 and the Food and Drug Administration.7, 8 Yet, recent studies have raised awareness for their potential health effects,5 particularly in children9 younger than six to twelve months of age whose detoxification systems are still immature.6
Parabens can elicit direct and indirect effects on the endocrine system, which may influence fetal development and ultimately adult health.10 Specifically, many parabens are ER-α agonists,11 can affect the fate and metabolism of steroid hormones and xenobiotics, and have been implicated in excessive weight gain.9 Their endocrine-disrupting and obesogenic potency typically increases with the size of the alkyl moiety.12-14 Additionally, epidemiological surveys have associated individual parabens with a variety of health outcomes, including elevated oxidative stress biomarkers for MePB and EtPB, lower serum thyroid levels for EtPB, aeroallergen sensitization for PrPB and BuPB, and damage of sperm DNA for BuPB.15-18 Taken together, these observations warrant monitoring of human exposure to individual parabens and paraben mixtures to inform human risk assessment.
Human exposure to parabens typically occurs through topical contact with or ingestion of paraben-containing products1-4 as well as inhalation of contaminated air and dust.19-21 Following exposure, human epithelial absorption of parabens and their subsequent metabolism occur rapidly in the liver. Metabolism results in systemic distribution of free parabens and adducts of PHBA, glucuronide, sulfate, and glycine adducts, all of which are excreted principally via urine.9, 22, 23 Diverse biomonitoring studies from across the globe have confirmed human exposure to a variety of parabens as being widespread,18, 24-31 and more prevalent and substantial in women compared to men or children.26 Select studies investigated human prenatal and neonatal exposures to parabens in the U.S.,32-34 Puerto Rico,27 Denmark,28 Spain,29 China,30 Korea,18 and Japan.31 In these studies, parabens were confirmed to be distributed systemically, leading to exposure of the human fetus and neonate via the placenta35 and amniotic fluid 9, 18, 36 In children, the estrogenic burden of free parabens and possibly PHBA may become more important than that of endogenous estradiol.6, 9 In adults, frequent use of paraben-containing products may result in steady-state exposure levels to free parabens and PHBA, despite the rapid and efficient metabolism and excretion of parabens upon exposure.27, 30 In fact, observed changes in the health status of a study population from Puerto Rico were suspected to be due to exposure to endocrine disruptors including, parabens.27 Although children feature an increased susceptibility to endocrine disruption, reports on fetal and neonatal exposures to parabens are still scarce for the populations in the U.S., its territories,27, 32 and around the world.18, 29, 31, 37, 38 Data often are available only for maternal urine samples, with measurements of paraben levels in placental and amniotic fluid seldom being investigated due to the invasive nature of the sampling of these specimens.35, 36
Here, we report on maternal and fetal body burdens of parabens resulting from real-world exposures. Five parabens were monitored in a section of an urban immigrant population and body burdens in our cohort were compared with those observed in the U.S. general population and pregnant women around the globe. Fetal exposures were assessed using 181 maternal spot urine samples collected once per participant during the second to third trimester and 38 umbilical cord blood plasma collected at birth. Body burdens were determined primarily as total (∑-) concentrations, accounting for both free product and conjugated species; however, for a random subset of 21 cord blood plasma samples, the concentration of free parabens were also assessed. Human biomonitoring studies usually use cohorts representing the general population to determine the extent and risk of environmental exposures.24 Since pregnant women, infants, and minority populations may differ somewhat in degree and extent of exposure,27, 39-42 risk,39, 43 or susceptibility, our sampled population requires close scrutiny due to its susceptibility to adverse exposure effects and the paucity of data available today. The present work addresses some of these data gaps by investigating body burdens of pregnant women and neonates in an urban immigrant community using liquid chromatography tandem mass spectrometry (LC-MS/MS) for highly sensitive and selective analysis of the five targeted parabens.
2. Materials and methods
2.1 Standards and reagents
MePB was purchased from Aldrich (Sigma-Aldrich, St. Louis, MO), and 13C6-MePB (99%) was obtained from Cambridge Isotope Laboratories (Andover, MA). EtPB, n-PrPB, n-BuPB, and BePB were acquired from RT Corp (Laramie, WY) and deuterated standards (EtPB-d4, n-PrPB-d4, n-BuPB-d4) were purchased from C/D/N Isotopes (Quebec, Canada). LC-MS-grade (99%) methanol, water, and acetic acid were obtained from Fluka (Basel, Switzerland) and LC-MS-grade acetone was obtained from Sigma-Aldrich (Sigma-Aldrich, St. Louis, MO). Individual stock solutions of the native and stable isotope-labeled compounds were prepared in methanol. All stock solutions were stored at −20 °C in glass vials sealed with polytetrafluoroethylene septa.
2.2 Cohort and sampling procedure
Archived samples of maternal urine and human cord blood plasma originated from an urban immigrant population investigated previously for prenatal exposure to mercury and to the antimicrobials triclosan and triclocarban.39, 44 These previous studies detail the sampling procedures and cohort descriptors. Table S1 provides a concise overview of the composition of the sample population. The sample population was comprised of individuals with ethnic backgrounds from 19 different countries in the Caribbean, West Indies, Central and South America, and Canada. Briefly, pregnant women (aged 18–45 years) were recruited at the University Hospital of Brooklyn's Prenatal Clinic between October 2007 and December 2009. Random “spot” urine specimens (n = 181) were provided once per participant during the 6th to 9th months of pregnancy. A convenience subset of participants were followed to delivery, at which time single umbilical cord blood specimens were collected from the neonates (n = 38) for plasma isolation and storage at −80°C for subsequent lab analysis. Human specimens were collected in polypropylene vials or cups that had not been pre-screened for the presence of target analytes, so a random subset of cord blood plasma samples (n = 21) was analyzed for both free and total concentrations. The study protocol was approved by Institutional Review Boards (IRBs) of the State University of New York Downstate Medical Center, and of the New York State Department of Health. Each participant signed an informed consent form prior to participation.
2.3 Extraction procedure
The samples were shipped on dry ice to Arizona State University and archived at −80°C. To maintain analyte stability, freeze-thaw cycles were minimized by distributing the sample into 2 mL aliquots that were also stored at −80°C. Human specimens (1 mL of maternal urine or 100 μL of cord blood plasma) were thawed, spiked with a solution containing six isotope-labeled standards (10 μL) as well as a solution containing two hydrolysis standards (50 μL), and diluted with a solution containing hydrolysis enzymes (1 mL). An additional 900 μL MS-grade water was added to the umbilical cord blood samples. The labeled standard solution contained 13C6-MePB, EtPB-d5, n-PrPB-d4, and n-BuPB-d4, and 13C4-methylumbelliferone in methanol. The hydrolysis standard contained methylumbelliferone-sulfate and methylumbelliferone-glucuronide in water. Enzyme solution containing 0.5 mg/mL of glucuronidase/sulfatase H1 (1:1) in 1 M ammonium acetate (pH 5.0) was added, where after the mixture was gently mixed and incubated overnight at 37°C. Target analytes were extracted using 60 mg Oasis HLB (Waters, Milford, MA) solid-phase extraction cartridges as described previously.44 Extracts were dried and reconstituted with 1 mL methanol, and homogenized in a sonication bath. Free parabens were determined using the same method as for total parabens, with the substitution of enzyme-free buffer, and the samples were not inoculated overnight prior to extraction.
2.4 Chemical analysis
Methanolic extracts were diluted 1+1 with water. Aliquots of 100 μL were injected onto the LC-MS/MS instrument (API 4000 triple quadrupole mass spectrometer, ABSciex, Framingham, MA) operated in negative electrospray ionization mode. The LC was run at 0.5 mL/min, starting at 60% methanol (MeOH) with a ramp to 95% MeOH over 4 min; flow was held at 95% MeOH for 3.5 min, decreased back to 60% MeOH over 1.5 min, and held at 60% MeOH for 2 min for re-equilibration of the analytical column (X-Bridge, 4.6 × 150 mm, C8 column with 3.5 μm particle size (Waters) preceded by an equivalent guard columns; Waters, Milford, MA). Use of a switching valve allowed diversion away from the MS/MS of flow between 0.0 and 2.0 min and 8.0 to 10 min. The source parameters were set as follows: curtain gas: 25 psi, gas 1: 70 psi, gas 2: 50 psi, Ion Source Potential: −4500 eV, source temperature: 500°C, entrance potential (EP): −10 eV, and collision activated dissociation (CAD) gas: 12 psi.
2.5 Creatinine determination
Urine aliquots of 2 mL were measured for creatinine onsite at SUNY using the Alkaline Picrate Method and a Beckman Olympus Analyzer, Model AU-2700 (Beckman Coulter, Inc., Brea, CA). Urinary creatinine adjustment accounts for dilution differences due to diurnal variation of random spot urine specimens collected at various times throughout the day.
2.6 Quality assurance/quality control (QA/QC)
All analytes and their respective labeled standards were identified using their specific retention time and multiple reaction monitoring transitions (Table S2). To mitigate background contamination, all glassware was either new or baked at 550°C for 4 h, the instrument operators refrained from using paraben-containing products to mitigate sample contamination, and the solvent stocks were checked daily for contamination and replaced if needed. All extractions and analyses were performed along with solvent blanks, reagent blanks (i.e., procedural controls), and instrument performance standards. Briefly, reagent blanks were prepared per batch of samples (typically 1 reagent blank per 10 samples) and were processed alongside their respective batches from thawing, through the extraction, up until the chemical analysis using LC-MS/MS. Because the reagent blank undergoes all the same steps as the accompanying samples, these controls therefore underwent all potential contamination sources and events the samples experienced, if any. Therefore, the area-under-the-curve observed for the reagent blank was considered subtracted from the respective areas obtained for the 10 samples it accompanied. The same procedure was followed for the urine samples and the cord blood samples. Yet, this approach was unable to take into account sample contamination occurring at the time of sampling at the hospital because the samples were taken in the frame of another study. All reported concentrations were determined based on a standard curve containing between 5 and 8 data points and a coefficient of determination of R2 ≥0.99. Average recoveries for parabens were determined based on spike-recovery experiments (8 replicates) performed using commercially-available human urine (KOVA-Troll III, Hycor, Garden Grove, CA) and human plasma specimens (Sigma, Sigma-Aldrich, St. Louis, MO). The spike-recovery experiments were used also to compute the accuracy and precision of our method by comparing the recovered levels with the nominal (i.e., theoretical target) levels. Method detection limits (MDLs), instrumental limits of detection (LOD) and quantification (LOQ) are provided in Table S3 and were determined as previously described.44 Concentrations were reported when (i) analyte peak height to background signal had a signal-to-noise ratio of >3; (ii) sample peak areas fell within the established dynamic range of the calibration; and (iii) the calculated concentrations exceeded those of the LOD and the MDL, whichever higher (Table S3). For the determination of free parabens in cord blood, the MDLs for total parabens in the same matrix were used. The hydrolysis standards were added solely for verifying enzyme activity in the individual specimens, not for normalizing target analyte concentrations.
2.7 Statistical analyses
Average relative concentrations of individual parabens were determined by calculating the arithmetic mean of the relative masses (%) of the individual parabens in all samples. Using SPSS v. 22 software (IBM, Armonk, NY), Spearman correlation analyses were performed between the total uncorrected concentrations of the various individual urinary paraben levels recorded for the cohort (n = 181) and described using Spearman's rho. Spearman correlation analyses between media (maternal urine and cord blood) were performed to describe the association between both ways of assessing the maternal and fetal body burden. All correlation analyses were performed on log-transformed data to mitigate the influence of elevated body burdens on the investigated association. Non-detect values were treated as the MDL divided by the square root of two, except for the correlation between media because of the high number of non-detects.
3. Results and discussion
3.1 Quality assurance and quality control
All solvent blanks were free of all analytes. The reagent blanks (i.e., process controls) were free of PrPB, BuPB, and BePB, but contained trace amounts of MePB and EtPB. On average, 350 ± 253 ng/L MePB and 63 ± 42 ng/L EtPB were found in the reagent blanks using isotope-dilution mass spectrometry, despite best efforts to mitigate contamination. As a result, background subtraction was performed for the determination of MePB and EtPB using the corresponding reagent blank samples. To assess the robustness of the data and the impact of potential interferences, all non-spiked samples were re-analyzed after tenfold dilution, yielding average variabilities of 11 ± 9%, 14 ± 14%, 7 ± 6%, and 20 ± 18% for MePB, EtPB, PrPB and BuPB, respectively. This measure was not available for BePB because it was never observed in non-spiked samples.
3.2 Limitations
This study primarily established the body burden of the study population; a determination of the risks associated with observed exposure levels may differ substantially among and within different study populations and subpopulations, and was beyond the scope of this work. Due to the study design of collecting convenience samples at an urban hospital, the ethnic composition of the cohort was not controlled in this study. Furthermore, the study design and the ubiquity of the target analytes limited opportunities for apportionment of exposure sources in this study. Since analyte degradation may have occurred during storage of the maternal urine and cord blood samples, the concentrations reported here should be interpreted as conservative or lower bound estimates of the extant, true body burdens. Since some parabens are ubiquitous in the environment, high paraben levels detected in non-spiked commercially-available reference materials (urine) negatively affected results of spike experiments at trace levels and reliable accuracy and precision data could not be obtained for MePB and PrPB.
3.3 Parabens in maternal urine
Maternal urine from 181 pregnant women was screened for the five parabens MePB, EtPB, PrPB, BuPB, and BePB to assess the body burden during the second to third trimesters of pregnancy. Urinary concentrations were determined after conjugate hydrolysis and are expressed as total concentrations. Uncorrected concentrations (μg/L) as well as creatinine-normalized concentrations (μg/g) are presented in Table 1. The creatinine-normalized concentrations are presented for 167 participants only, since creatinine data were missing for 14 samples. A detailed overview of the exposure per chemical, per matrix, and per participant is provided in Table S4.
Table 1.
Total (∑-) concentrations (free form + conjugate species) of five parabens in spot urine collected during the second to third trimesters of pregnancy. First and second lines report the uncorrected (μg/L) and creatinine-normalized (μg/g) concentrations from 181 and 167 participants, respectively.
| >MDL (%) | Percentile | Mean | |||||||
|---|---|---|---|---|---|---|---|---|---|
| 5th | 10th | 25th | 50th | 75th | 90th | 95th | |||
| MePB | 100 | 12.3 | 19.7 | 81.8 | 279 | 626 | 1,324 | 2,322 | 648 |
| 9.69 | 16.8 | 77.1 | 213 | 467 | 926 | 2,054 | 503 | ||
| EtPB | 73.5 | <0.04 | <0.04 | <0.04 | 1.44 | 4.44 | 41.0 | 106 | 23.1 |
| <0.04a | <0.04a | <0.04a | 1.04 | 4.19 | 24.0 | 67.1 | 19.0 | ||
| PrPB | 100 | 2.97 | 4.69 | 23.1 | 75.3 | 180 | 434 | 611 | 171 |
| 2.55 | 4.31 | 16.0 | 60.3 | 133 | 295 | 429 | 116 | ||
| BuPB | 65.7 | <0.03 | <0.03 | <0.03 | 0.39 | 1.68 | 12.4 | 33.0 | 5.75 |
| <0.03a | <0.03a | <0.03a | 0.28 | 1.20 | 8.98 | 22.2 | 3.24 | ||
| BePB | 0.00 | <0.02 | <0.02 | <0.02 | <0.02 | <0.02 | <0.02 | <0.02 | <0.02 |
| <0.02a | <0.02a | <0.02a | <0.02a | <0.02a | <0.02a | <0.02a | <0.02a | ||
| ∑-parabens | 100 | 20.1 | 43.5 | 141 | 410 | 826 | 1,761 | 2,758 | 847 |
| 19.2 | 37.9 | 140 | 297 | 642 | 1,302 | 2,745 | 641 | ||
assuming a creatinine concentration of 1 g/L.
MDL: Method Detection Limit.
Exposure to MePB and PrPB was found to be pervasive in our cohort (100% of all urine samples) with both contaminants consistently occurring at levels exceeding their MDLs of 0.06 and 0.03 μg/L, respectively (Table 1). EtPB (73.5%) and BuPB (66.3%) were detected in the majority of urine samples at levels exceeding their MDLs of 0.04 μg/L and 0.03 μg/L, respectively. Conversely, BePB was never detected at levels exceeding the MDL of 0.02 μg/L. The ubiquitous parabens, MePB and PrPB, typically occurred at substantially higher concentrations when compared to EtPB, BuPB, and BePB (Figure 1). Indeed, MePB and PrPB were the most abundant parabens relative to the other three parabens, since they comprised more than half of the total paraben concentration (i.e., sum of the concentrations of the five target parabens) in 90.1% (n = 163) and 7.2% (n = 13) of the 181 urine samples, respectively. Conversely, EtPB constituted more than half of the total paraben concentration in one urine sample only (0.6%) with the EtPB comprising 68% of the total paraben concentration in that sample. Linear correlation analyses (Table S5) using uncorrected total urinary levels showed that body burdens of individual parabens increased concomitantly and significantly (p <0.001 or p <0.005, two-tailed). This suggests that if subjects have elevated body burdens for one paraben, they are likely to have elevated body burdens for the other parabens also. These strong correlations are most likely due to the co-occurrence of individual parabens in consumer product formulations,4 and were found to be particularly strong for MePB and PrPB (Spearman's rho = 0.758). Similarly, significant positive associations between individual parabens have been reported previously in urine of pregnant women from Korea, Spain, and Puerto Rico,18, 27, 29 and in urine of the general population of the United States.24 With co-occurrence of different parabens being the rule rather than the exception, pinpointing effects of individual parabens in complex mixtures may be difficult using human cohorts experiencing real-world exposures, and may require the use of controlled in vitro and in vivo models.
Figure 1.

Average relative abundances of five parabens calculated from uncorrected concentrations (μg/L) in maternal urine (n = 181) and umbilical cord blood plasma (n = 38) after conjugate hydrolysis, as well as in umbilical cord blood plasma without conjugate hydrolysis (n = 21). Standard deviations ranged from 1.3-25.1%, but were not plotted for clarity (because they overlapped). Data for BePB are not shown because this compound was extant at levels too low to be quantified (>LOD; <MDL).
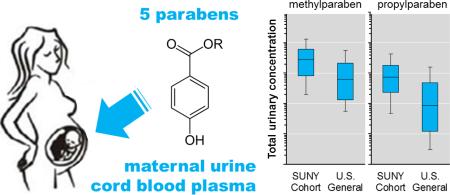
Based on the descriptors of our sample population (i.e., women, predominantly black, and of Caribbean origin; Table S1) and past studies reporting higher concentration for these descriptors,24, 27, 32 an elevated risk of exposure to parabens was expected in our cohort compared to the general population where these subpopulations, which experience higher body burdens,24, 27, 32 are less represented. Indeed, when comparing the urinary levels of MePB and PrPB in our cohort (2007/9) with those reported previously for the NHANES cohort (2005/6) (Figure 2), exposure in our cohort was more similar to, but typically higher than, that in black and female subpopulations, and substantially higher than exposure in the general and age-matched population of the United States (Figure 2). For EtPB and BuPB, exposure in our cohort also was typically higher compared to the age-matched and general U.S. population, but EtPB exposure in our cohort was most similar to that in the female subpopulation (Table S6). The median concentrations of MePB and PrPB in our cohort were, respectively, 4.4 and 8.7 times higher than those of the general population. Similarly, exposure levels of MePB, EtPB, PrPB, and BuPB in our cohort were, respectively, 1.2, 1.44, 2.17, and 1.3 times higher than those of the black subpopulation (Table S6). Caution should be exerted when comparing the current data set (2007/9) with the one from the NHANES study (2005/6),24 since multiple dissimilarities between both studies may impact comparisons, the principal factors being differences in the year of sampling and the composition of the respective subpopulations. Still, Figure 2 shows that exposure to MePB and PrPB is driven mostly by race/ethnicity (black), more so than sex (female), and rather than by age (20-59 years). However, additional factors may be causing the typically higher concentrations in our predominantly black cohort compared to the general population of the United States, and race/ethnicity may simply be a proxy for other factors driving elevated exposure, such as education, socio-economic status, geography and culture-dependent diet. Regardless, future work should focus on investigating whether elevated paraben body burdens may have implications for the health of women and those of ethnic minorities.
Figure 2.

Total (∑-), uncorrected urinary concentrations of MePB and PrPB in our cohort (n = 181) compared to those reported previously in the general population and in different subpopulations of the United States.24 The values above the plots represent the percentage of samples >MDL. The whiskers represent the 10th and 90th percentiles. NR = not reported.
When taking a global perspective and comparing exposure in our sample populations with exposures in other cohorts of pregnant women across the world, it becomes evident that the minority population studied here incurs high body burdens of certain parabens (Table 2). For MePB exposure, our immigrant population of predominantly-Caribbean descent ranked first, followed closely by another population from the Caribbean (Puerto Rico), when comparing the values of the median as well as the 25th and 75th percentiles (Table 2). Compared to the Canadian cohort (26.0 μg/L), for example, the median MePB concentration in our cohort was 10.7 times higher (279 μg/L); though it should be noted that the sample size in the Canadian study was very small (n = 9). Conversely, exposure to EtPB was remarkably low compared to other populations and was the lowest ever recorded for pregnant women (Table 2). Specifically, the median value for EtPB (1.44 μg/L) was 26.4 times lower than that for the Korean cohort (38.0 μg/L), which ranked first in exposure to EtPB. For PrPB, the situation is again highly similar compared to MePB, where our minority population ranks first followed again by the Puerto Rican cohort, when comparing the median, as well as 25th and 75th percentile values. For BuPB, the highest concentrations were reported for the Spanish cohort, and BuPB concentrations in our minority cohort were on the lower end, with median levels of our cohort (0.39 μg/L) ranking between Canada (0.25 μg/L) and Puerto Rico (0.4 μg/L). Hence, our cohort may indeed be at an elevated risk of suffering health outcomes, but specifically those associated with exposures to MePB and PrPB. The main sources of exposure to MePB and PrPB remain unidentified for our cohort; plausible sources include day-to-day consumer and personal care products known to contain these compounds. Overall, this global comparison suggests that paraben exposures cannot be generalized geographically, as they appear to be both country and population specific (Table 2). Rather, exposures to parabens likely are driven by the availability of country-specific products as well as population- and community-specific behaviors and factors.
Table 2.
Total (∑-), unadjusted urinary concentrations (μg/L) of MePB, EtPB, PrPB, and BuPB in different cohorts of pregnant women from across the globe. The cohorts were sorted according to the median values reported for for MePB.
| Location | Cohort Size (#) | MePB | EtPB | PrPB | BuPB | Reference | ||||
|---|---|---|---|---|---|---|---|---|---|---|
| DF (%) | Median (IQR) | DF (%) | Median (IQR) | DF (%) | Median (IQR) | DF (%) | Median (IQR) | |||
| Brooklyn, NY, USA | 181 | 100 | 279 (81.8-626) | 73.5 | 1.44 (<LOD-4.44) | 100 | 75.3 (23.1-180) | 65.7 | 0.39 (<LOD-1.68) | This study |
| Puerto Rico | 105 | 100 | 153 (57.6-381) | NR | NR (NR) | 99.3 | 36.7 (10.1-130) | 58.3 | 0.4 (<0.2-5.5) | Meeker et al.27 |
| Korea | 46 | 98 | 134 (31.7-475.0) | 100 | 38.0 (9.9-235.0) | 98 | 6.6 (0.37-55.2) | 28 | <LOD (<LOD-0.67) | Kang et al.18 |
| Spain | 120 | 100 | 191 (415.5a) | 87.6 | 8.8 (25.7a) | 98.3 | 29.8 (61.3a) | 90.1 | 2.4 (10.3a) | Casas et al.29 |
| USA | 129 | - | 135 (51.3-287) | - | NR | - | 22.8 (7.33-75.2) | - | 0.88 (0.25-2.88) | Smith et al.32 |
| France | 191 | 100 | 97.8 (NR) | 67.7 | 4.1 (NR) | 96.9 | 12.5 (NR) | 79.5 | 1.7 (NR) | Philippat et al.38 |
| Japan | 111 | 94 | 75.8 (27.4-164) | 81 | 7.53 (1.37-25.8) | 89 | 20.2 (7.73-84.6) | 54 | 0.59 (<0.46-3.34) | Shirai et al.31 |
| Canada | 9 | 100 | 25.98 (NR) | 100 | 9.83 (NR) | 100 | 2.48 (NR) | 100 | 0.25 (NR) | Genuis et al.27 |
DF: Detection Frequency; IQR: Interquartile range; NR: Not reported
data reflects the range of the IQR instead of the IQR itself.
Indicated in bold are the highest levels reported for the 25th and 75th percentiles, and the median
3.4 Parabens in umbilical cord blood plasma
Thirty-eight specimens of umbilical cord blood plasma from 36 women (33 of which also provided a urine sample) were screened for five parabens to assess the body burden of the neonate at the time of birth. The two additional samples (38 samples for 36 women) are the result of the delivery of twins for two participants. Cord blood plasma concentrations were determined after conjugate hydrolysis and are expressed as total concentrations in Table 3. Urine and cord blood samples were collected during different stages of pregnancy, limiting somewhat our ability to interpret the body burdens observed in both sample types. Still, significant correlations were observed for EtPB (Spearman's rho = 0.70) and BuPB (Spearman's rho = 0.36) when plotting both urinary and cord blood concentrations (>MDL samples only, n = 32 for MePB, 26 for EtPB, 17 for PrPB, and 13 for BuPB). Hence, significant correlations were found here between both matrices despite the time difference of several months. Future studies that are more focused on finding associations between multiple matrices should consider sampling these matrices concurrently and consider using Kendall”s correlation coefficients to provide better estimates of the association between both media (maternal urine and cord blood).
Table 3.
Total (∑-) concentrations (μg/L) of five parabens after conjugate hydrolysis in umbilical cord plasma collected at time of birth from 38 neonates.
| >MDL (%) | Percentile | Mean | |||||||
|---|---|---|---|---|---|---|---|---|---|
| 5th | 10th | 25th | 50th | 75th | 90th | 95th | |||
| MePB | 97.4 | 0.89 | 2.10 | 6.89 | 25.0 | 62.8 | 180 | 210 | 54.8 |
| EtPB | 76.3 | <0.15 | <0.15 | <0.15 | 0.36 | 0.56 | 1.11 | 3.82 | 0.70 |
| PrPB | 47.4 | <0.27 | <0.27 | <0.27 | <0.27 | 1.59 | 11.8 | 31.8 | 4.28 |
| BuPB | 18.4 | <0.09 | <0.09 | <0.09 | <0.09 | <0.09 | 0.16 | 0.26 | <0.09 |
| BePB | 0.0 | <0.10 | <0.10 | <0.10 | <0.10 | <0.10 | <0.10 | <0.10 | <0.10 |
| ∑-parabens | 97.4 | 1.10 | 2.51 | 7.08 | 25.9 | 67.5 | 192 | 250 | 59.8 |
MDL: Method Detection Limit
The lower molecular weight parabens (MePB and EtPB) showed high detection frequencies (≥95% and 76.3%) in cord blood plasma, whereas PrPB and BuPB were detected only in about half (47.4%) or less (18.4%) of the samples, respectively (Table 3). Comparing the detection frequencies for cord blood plasma with those for maternal urine (Figure S1) showed highly similar detection frequencies for the lower molecular weight parabens (MePB and EtPB), whereas the same comparison showed a relative depletion in cord blood for the larger, more hydrophobic ones (PrPB and BuPB). With this similarity in detection frequencies (i.e., >MDL) for MePB and EtPB, the observed relative depletion of the higher molecular weight parabens (PrPB, BuPB, and BePB) may be due to the additive effects of multiple factors, including dissimilarities in sampling periods, matrix and associated transport phenomena, method sensitivity, and especially, partitioning of higher molecular weight parabens onto the cellular fraction of whole cord blood. This last factor is likely to have but a minimal influence since most parabens occur as hydrophilic conjugated species (as shown in Section 3.4.).
Percentile concentrations of the different parabens in cord blood plasma (Table 3) were typically an order of magnitude lower than those observed in maternal urine. The relative lower occurrence of PrPB and BuPB in cord blood plasma could also be observed in the relative total concentrations of the individual parabens (Figure 1), where PrPB and BuPB went from average relative abundances of 23.9 ± 17.4% and 1.1 ± 3.5% in urine, respectively, to 4.1 ± 6.5% and 0.4 ± 1.3% in cord blood plasma, respectively. Conversely, MePB and EtPB increased in relative abundance, going from 72.6 ± 19.0% and 2.4 ± 6.6% in urine, respectively, to 91.1 ± 10.0% and 4.1 ± 6.1% in cord blood plasma, respectively (Figure 1). Given that paraben concentrations in maternal urine in the second and third trimesters are a good predictor for those extant at the time of birth, our results suggest that a combination of maternal detoxification (conjugation and hydrolysis) and selective partitioning or placental transfer may effectively mitigate the transfer of biologically-active, unconjugated parabens to the fetus, thereby protecting the fetus from otherwise higher exposure levels. Though the paraben concentrations in cord blood plasma were typically low (Table 3), we speculate that these concentrations may represent a steady-state body burden for the fetus because the body burdens are likely to be the result of frequent use of consumer products by the mother. It is known that maternal exposures and associated maternal body burdens result in a net body burden of the fetus to parabens because parabens were detected previously in human amniotic fluid36 as well as in the urine of neonates.18 Our study demonstrates that the transfer of parabens from the mother to the fetus occurs by means of cord blood.
Because the detection frequencies and measured concentrations in cord blood plasma were typically lower compared to those in maternal urine, our results suggest that cord blood plasma (like amniotic fluid)36 may not be the most suitable matrix for assessing fetal exposure using the currently available detection techniques. Based on our results, it is recommended to (i) analyze whole cord blood along with plasma to determine the absorbed fraction in addition to the bioavailable fraction, respectively, (ii) sample larger volumes of cord blood, thereby increasing the sensitivity of the analysis, (iii) sample maternal urine closer to the time of delivery, thereby avoiding uncertainties linked to exposure variability over time,27, 36 (iv) investigate the relationship between the levels extant in maternal urine and whole cord blood in the context of birth outcomes, and (v) investigate the levels in amniotic fluid and neonate urine along with those in cord blood. As in the current study, following the latter recommendation may be hampered by the fact that many cohort studies routinely collect plasma rather than whole blood, so sample availability can represent a limitation.
3.5 Free parabens in cord blood plasma
A random subset of 21 out of 38 cord blood plasma samples was analyzed for free parabens (i.e., without enzymatic hydrolysis of phase-II metabolites). Hence, this study is the first to report concentrations of free and total parabens in umbilical cord blood. Free parabens were detected for MePB, EtPB, and PrPB in 72.7, 45.5, and 31.8% of the 21 samples, respectively, but BuPB or BePB was not detected. In our cohort, free MePB, EtPB, and PrPB constituted 3.9%, 71.7%, and 6.4% (median values) or 4.9%, 72.0%, and 5.6% (geometric means), respectively, of the total concentrations. These relative concentrations of free parabens in cord blood plasma are similar to those reported for MePB and PrPB extant in urine, namely 5% and 2%, respectively for one study,23 and 57-98% and 1.4-12%, respectively for another study.45 Free EtPB was detected in 10 out of 22 samples, but in 3 of those cases, levels of free EtPB were found to exceed those of the total concentrations by 11-28%, and in 3 other cases both free and total EtPB was detected, but total EtPB could not be quantified (<0.15 μg/L). These findings are presumed to be due to the fact that in all 10 cases (where free EtPB was detected) both the free and total concentrations were typically close to the MDL (0.15 μg/L) and below 1 μg/L, and analytical determinations routinely incur variability of up to 30%. Despite the fact that these six cases were omitted from our relative abundance calculations presented above, our relative abundances for EtPB were substantially elevated compared to MePB and PrPB (Figure 1). One potential explanation for free EtPB levels being elevated may be differences in the rate of metabolism of paraben congeners by the human body. Although the fraction of free EtPB (~70%) is higher than for MePB (~4%) or PrPB (~6%), the relative abundances of the four parabens remained largely unchanged compared to their total levels in plasma (Figure 1). Thus, the findings for cord blood plasma reported here are consistent with previous reports where median percentages of free forms in urine were shown to account for 4-20% of the total forms, while varying between 0.1 and 92%.31 According to our results, the fetus is exposed to most of the EtPB in free form, but our low sample size severely limits the reliability of any conclusions as to its representativeness on a population level.
4. Conclusions
The sampled urban immigrant population was shown here to experience body burdens of some parabens, and in doing so, this work was the first to report cord blood plasma levels for parabens. A review of the literature in combination with our data shows that the extent of paraben exposure is distinct for individual parabens (rather than parabens as a collection), a finding presumably driven by a number of cultural- and country-specific factors. Hence, this work emphasizes the need to monitor exposure to parabens both as individual chemicals as well as on a community level. The strong variability in exposures between populations warrants an improved assessment of specific determinants of exposure for parabens whether occurring individually or as a mixture. The present work may serve as a foundation to begin exploring and identifying, in human populations, the potential health outcomes associated with exposure to individual parabens as well as to more complex mixtures, such as with their metabolite, PHBA, and other compounds with which they share pathways of toxicity. Future work should substantiate whether elevated exposure to the different parabens is associated with race/ethnicity and cultural background, and if fetal exposures impact fetal development.
Supplementary material
Highlights.
First report on parabens in human cord blood
Maternal and fetal body burdens are documented for population in Brooklyn, NY
Maternal body burdens in Brooklyn are higher than those reported for general U.S. population
Highest body burdens for methyl and propyl paraben reported worldwide
Paraben burdens vary in congeners by country and subpopulation
Acknowledgements
This project was supported in part by Award Numbers R01ES015445 and R01ES020889 from the National Institute of Environmental Health Sciences (NIEHS) and by the Virginia G. Piper Charitable Trust through award number LTR 05/01/12. The content is solely the responsibility of the authors and does not necessarily represent the official views of the NIEHS or the National Institutes of Health (NIH). This initial study also received funds from the New York Community Trust. The sponsors had no role in the study outside of funding. The funding sources were not involved in the execution or publication of the study.
Footnotes
Publisher's Disclaimer: This is a PDF file of an unedited manuscript that has been accepted for publication. As a service to our customers we are providing this early version of the manuscript. The manuscript will undergo copyediting, typesetting, and review of the resulting proof before it is published in its final citable form. Please note that during the production process errors may be discovered which could affect the content, and all legal disclaimers that apply to the journal pertain.
5. Supplementary Material
The Supplementary Material contains the descriptive statistics of the study population, an overview of the LC and MS parameters, and method performance characteristics, an overview of the individual concentrations of all analytes per sample type, and per participant, an overview of the correlation coefficients describing the associations between the total uncorrected concentrations of individual parabens in urine, a comparison of the total urinary concentrations of four parabens in the studied cohort compared to those reported previously for the general population of the U.S., and a figure comparing the detection frequencies in maternal urine and cord blood plasma. This material is available free of charge online.
References
- 1.Eriksson E, Andersen HR, Ledin A. Substance flow analysis of parabens in Denmark complemented with a survey of presence and frequency in various commodities. J Hazard Mater. 2008;156(1-3):240–59. doi: 10.1016/j.jhazmat.2007.12.022. [DOI] [PubMed] [Google Scholar]
- 2.Liao C, Kannan K. Concentrations and composition profiles of parabens in currency bills and paper products including sanitary wipes. Sci Total Environ. 2014;475:8–15. doi: 10.1016/j.scitotenv.2013.12.097. [DOI] [PubMed] [Google Scholar]
- 3.Liao C, Liu F, Kannan K. Occurrence of and dietary exposure to parabens in foodstuffs from the United States. Environ Sci Technol. 2013;47(8):3918–25. doi: 10.1021/es400724s. [DOI] [PubMed] [Google Scholar]
- 4.Guo Y, Kannan K. A survey of phthalates and parabens in personal care products from the United States and its implications for human exposure. Environ Sci Technol. 2013;47(24):14442–9. doi: 10.1021/es4042034. [DOI] [PubMed] [Google Scholar]
- 5.Bledzka D, Gromadzinska J, Wasowicz W. Parabens. From environmental studies to human health. Environ Int. 2014;67:27–42. doi: 10.1016/j.envint.2014.02.007. [DOI] [PubMed] [Google Scholar]
- 6.SCCS Opinion on parabens: Updated request for a scientific opinion on propyl- and butylparaben. Colipa nr. 2013 May 3;P82:50. 2013; p. [Google Scholar]
- 7.Green JL. Can bioinformed design promote healthy indoor ecosystems? Indoor Air. 2014;24(2):113–5. doi: 10.1111/ina.12090. [DOI] [PubMed] [Google Scholar]
- 8.van der Werf MJ, Overkamp KM, Muilwijk B, Coulier L, Hankemeier T. Microbial metabolomics: Toward a platform with full metabolome coverage. Analytical Biochemistry. 2007;370(1):17–25. doi: 10.1016/j.ab.2007.07.022. [DOI] [PubMed] [Google Scholar]
- 9.Boberg J, Taxvig C, Christiansen S, Hass U. Possible endocrine disrupting effects of parabens and their metabolites. Reprod Toxicol. 2010;30(2):301–12. doi: 10.1016/j.reprotox.2010.03.011. [DOI] [PubMed] [Google Scholar]
- 10.Isling LK, Boberg J, Jacobsen PR, Mandrup KR, Axelstad M, Christiansen S, Vinggaard AM, Taxvig C, Kortenkamp A, Hass U. Late life effects on rat reproductive system after developmental exposure to mixtures of endocrine disrupters. Reproduction. 2013 doi: 10.1530/REP-13-0448. [DOI] [PubMed] [Google Scholar]
- 11.Routledge EJ, Parker J, Odum J, Ashby J, Sumpter JP. Some alkyl hydroxy benzoate preservatives (parabens) are estrogenic. Toxicol Appl Pharmacol. 1998;153(1):12–9. doi: 10.1006/taap.1998.8544. [DOI] [PubMed] [Google Scholar]
- 12.Fukahori M, Akatsu S, Sato H, Yotsuyanagi T. Relationship between uptake of phydroxybenzoic acid esters by Escherichia coli and antibacterial activity. Chem Pharm Bull (Tokyo) 1996;44(8):1567–70. doi: 10.1248/cpb.44.1567. [DOI] [PubMed] [Google Scholar]
- 13.Pereira-Fernandes A, Demaegdt H, Vandermeiren K, Hectors TL, Jorens PG, Blust R, Vanparys C. Evaluation of a screening system for obesogenic compounds: screening of endocrine disrupting compounds and evaluation of the PPAR dependency of the effect. PLoS One. 2013;8(10):e77481. doi: 10.1371/journal.pone.0077481. [DOI] [PMC free article] [PubMed] [Google Scholar]
- 14.Hu P, Chen X, Whitener RJ, Boder ET, Jones JO, Porollo A, Chen J, Zhao L. Effects of parabens on adipocyte differentiation. Toxicol Sci. 2013;131(1):56–70. doi: 10.1093/toxsci/kfs262. [DOI] [PMC free article] [PubMed] [Google Scholar]
- 15.Meeker JD, Yang T, Ye X, Calafat AM, Hauser R. Urinary concentrations of parabens and serum hormone levels, semen quality parameters, and sperm DNA damage. Environ Health Perspect. 2011;119(2):252–7. doi: 10.1289/ehp.1002238. [DOI] [PMC free article] [PubMed] [Google Scholar]
- 16.Savage JH, Matsui EC, Wood RA, Keet CA. Urinary levels of triclosan and parabens are associated with aeroallergen and food sensitization. J Allergy Clin Immunol. 2012;130(2):453–60. e7. doi: 10.1016/j.jaci.2012.05.006. [DOI] [PMC free article] [PubMed] [Google Scholar]
- 17.Koeppe ES, Ferguson KK, Colacino JA, Meeker JD. Relationship between urinary triclosan and paraben concentrations and serum thyroid measures in NHANES 2007-2008. Sci Total Environ. 2013;445-446:299–305. doi: 10.1016/j.scitotenv.2012.12.052. [DOI] [PMC free article] [PubMed] [Google Scholar]
- 18.Kang S, Kim S, Park J, Kim HJ, Lee J, Choi G, Choi S, Kim S, Kim SY, Moon HB, Kim S, Kho YL, Choi K. Urinary paraben concentrations among pregnant women and their matching newborn infants of Korea, and the association with oxidative stress biomarkers. Sci Total Environ. 2013;461-462:214–21. doi: 10.1016/j.scitotenv.2013.04.097. [DOI] [PubMed] [Google Scholar]
- 19.Canosa P, Rodriguez I, Rubi E, Cela R. Determination of parabens and triclosan in indoor dust using matrix solid-phase dispersion and gas chromatography with tandem mass spectrometry. Anal Chem. 2007;79(4):1675–81. doi: 10.1021/ac061896e. [DOI] [PubMed] [Google Scholar]
- 20.Rudel RA, Dodson RE, Perovich LJ, Morello-Frosch R, Camann DE, Zuniga MM, Yau AY, Just AC, Brody JG. Semivolatile endocrine-disrupting compounds in paired indoor and outdoor air in two northern California communities. Environ Sci Technol. 2010;44(17):6583–90. doi: 10.1021/es100159c. [DOI] [PMC free article] [PubMed] [Google Scholar]
- 21.Wang L, Liao C, Liu F, Wu Q, Guo Y, Moon HB, Nakata H, Kannan K. Occurrence and human exposure of p-hydroxybenzoic acid esters (parabens), bisphenol A diglycidyl ether (BADGE), and their hydrolysis products in indoor dust from the United States and three East Asian countries. Environ Sci Technol. 2012;46(21):11584–93. doi: 10.1021/es303516u. [DOI] [PubMed] [Google Scholar]
- 22.Janjua NR, Mortensen GK, Andersson AM, Kongshoj B, Skakkebaek NE, Wulf HC. Systemic uptake of diethyl phthalate, dibutyl phthalate, and butyl paraben following whole-body topical application and reproductive and thyroid hormone levels in humans. Environ Sci Technol. 2007;41(15):5564–70. doi: 10.1021/es0628755. [DOI] [PubMed] [Google Scholar]
- 23.Ye X, Bishop AM, Reidy JA, Needham LL, Calafat AM. Parabens as urinary biomarkers of exposure in humans. Environ Health Perspect. 2006;114(12):1843–6. doi: 10.1289/ehp.9413. [DOI] [PMC free article] [PubMed] [Google Scholar]
- 24.Calafat AM, Ye X, Wong LY, Bishop AM, Needham LL. Urinary concentrations of four parabens in the U.S. population: NHANES 2005-2006. Environ Health Perspect. 2010;118(5):679–85. doi: 10.1289/ehp.0901560. [DOI] [PMC free article] [PubMed] [Google Scholar]
- 25.Frederiksen H, Jorgensen N, Andersson AM. Parabens in urine, serum and seminal plasma from healthy Danish men determined by liquid chromatography-tandem mass spectrometry (LC-MS/MS). J Expo Sci Environ Epidemiol. 2011;21(3):262–71. doi: 10.1038/jes.2010.6. [DOI] [PubMed] [Google Scholar]
- 26.Ye X, Zhou X, Wong LY, Calafat AM. Concentrations of bisphenol A and seven other phenols in pooled sera from 3-11 year old children: 2001-2002 National Health and Nutrition Examination Survey. Environ Sci Technol. 2012;46(22):12664–71. doi: 10.1021/es303109c. [DOI] [PMC free article] [PubMed] [Google Scholar]
- 27.Meeker JD, Cantonwine DE, Rivera-Gonzalez LO, Ferguson KK, Mukherjee B, Calafat AM, Ye X, Anzalota Del Toro LV, Crespo-Hernandez N, Jimenez-Velez B, Alshawabkeh AN, Cordero JF. Distribution, variability, and predictors of urinary concentrations of phenols and parabens among pregnant women in Puerto Rico. Environ Sci Technol. 2013;47(7):3439–47. doi: 10.1021/es400510g. [DOI] [PMC free article] [PubMed] [Google Scholar]
- 28.Tefre de Renzy-Martin K, Frederiksen H, Christensen JS, Boye Kyhl H, Andersson AM, Husby S, Barington T, Main KM, Jensen TK. Current exposure of 200 pregnant Danish women to phthalates, parabens and phenols. Reproduction. 2014;147(4):443–53. doi: 10.1530/REP-13-0461. [DOI] [PubMed] [Google Scholar]
- 29.Casas L, Fernandez MF, Llop S, Guxens M, Ballester F, Olea N, Irurzun MB, Rodriguez LS, Riano I, Tardon A, Vrijheid M, Calafat AM, Sunyer J, Project I. Urinary concentrations of phthalates and phenols in a population of Spanish pregnant women and children. Environ Int. 2011;37(5):858–66. doi: 10.1016/j.envint.2011.02.012. [DOI] [PubMed] [Google Scholar]
- 30.Engel LS, Buckley JP, Yang G, Liao LM, Satagopan J, Calafat AM, Matthews CE, Cai Q, Ji BT, Cai H, Engel SM, Wolff MS, Rothman N, Zheng W, Xiang YB, Shu XO, Gao YT, Chow WH. Predictors and Variability of Repeat Measurements of Urinary Phenols and Parabens in a Cohort of Shanghai Women and Men. Environ Health Perspect. 2014 doi: 10.1289/ehp.1306830. [DOI] [PMC free article] [PubMed] [Google Scholar]
- 31.Shirai S, Suzuki Y, Yoshinaga J, Shiraishi H, Mizumoto Y. Urinary excretion of parabens in pregnant Japanese women. Reprod Toxicol. 2013;35:96–101. doi: 10.1016/j.reprotox.2012.07.004. [DOI] [PubMed] [Google Scholar]
- 32.Smith KW, Braun JM, Williams PL, Ehrlich S, Correia KF, Calafat AM, Ye X, Ford J, Keller M, Meeker JD, Hauser R. Predictors and variability of urinary paraben concentrations in men and women, including before and during pregnancy. Environ Health Perspect. 2012;120(11):1538–43. doi: 10.1289/ehp.1104614. [DOI] [PMC free article] [PubMed] [Google Scholar]
- 33.Braun JM, Just AC, Williams PL, Smith KW, Calafat AM, Hauser R. Personal care product use and urinary phthalate metabolite and paraben concentrations during pregnancy among women from a fertility clinic. J Expo Sci Environ Epidemiol. 2013 doi: 10.1038/jes.2013.69. [DOI] [PMC free article] [PubMed] [Google Scholar]
- 34.Mortensen ME, Calafat AM, Ye X, Wong LY, Wright DJ, Pirkle JL, Merrill LS, Moye J. Urinary concentrations of environmental phenols in pregnant women in a pilot study of the National Children's Study. Environ Res. 2014;129:32–8. doi: 10.1016/j.envres.2013.12.004. [DOI] [PMC free article] [PubMed] [Google Scholar]
- 35.Jimenez-Diaz I, Vela-Soria F, Zafra-Gomez A, Navalon A, Ballesteros O, Navea N, Fernandez MF, Olea N, Vilchez JL. A new liquid chromatography-tandem mass spectrometry method for determination of parabens in human placental tissue samples. Talanta. 2011;84(3):702–9. doi: 10.1016/j.talanta.2011.01.075. [DOI] [PubMed] [Google Scholar]
- 36.Philippat C, Wolff MS, Calafat AM, Ye X, Bausell R, Meadows M, Stone J, Slama R, Engel SM. Prenatal exposure to environmental phenols: concentrations in amniotic fluid and variability in urinary concentrations during pregnancy. Environ Health Perspect. 2013;121(10):1225–31. doi: 10.1289/ehp.1206335. [DOI] [PMC free article] [PubMed] [Google Scholar]
- 37.Genuis SJ, Birkholz D, Curtis L, Sandau C. Paraben levels in an urban community of Western Canada. ISRN Toxicol. 2013;2013:507897. doi: 10.1155/2013/507897. [DOI] [PMC free article] [PubMed] [Google Scholar]
- 38.Philippat C, Mortamais M, Chevrier C, Petit C, Calafat AM, Ye X, Silva MJ, Brambilla C, Pin I, Charles MA, Cordier S, Slama R. Exposure to phthalates and phenols during pregnancy and offspring size at birth. Environ Health Perspect. 2012;120(3):464–70. doi: 10.1289/ehp.1103634. [DOI] [PMC free article] [PubMed] [Google Scholar]
- 39.Geer LA, Persad MD, Palmer CD, Steuerwald AJ, Dalloul M, Abulafia O, Parsons PJ. Assessment of prenatal mercury exposure in a predominately Caribbean immigrant community in Brooklyn, NY. J Environ Monit. 2012;14(3):1035–43. doi: 10.1039/c2em10835f. [DOI] [PubMed] [Google Scholar]
- 40.Hoepner LA, Whyatt RM, Just AC, Calafat AM, Perera FP, Rundle AG. Urinary concentrations of bisphenol A in an urban minority birth cohort in New York City, prenatal through age 7 years. Environ Res. 2013;122:38–44. doi: 10.1016/j.envres.2012.12.003. [DOI] [PMC free article] [PubMed] [Google Scholar]
- 41.Just AC, Adibi JJ, Rundle AG, Calafat AM, Camann DE, Hauser R, Silva MJ, Whyatt RM. Urinary and air phthalate concentrations and self-reported use of personal care products among minority pregnant women in New York city. J Expo Sci Environ Epidemiol. 2010;20(7):625–33. doi: 10.1038/jes.2010.13. [DOI] [PMC free article] [PubMed] [Google Scholar]
- 42.Teitelbaum SL, Britton JA, Calafat AM, Ye X, Silva MJ, Reidy JA, Galvez MP, Brenner BL, Wolff MS. Temporal variability in urinary concentrations of phthalate metabolites, phytoestrogens and phenols among minority children in the United States. Environ Res. 2008;106(2):257–69. doi: 10.1016/j.envres.2007.09.010. [DOI] [PubMed] [Google Scholar]
- 43.Perera FP, Rauh V, Tsai WY, Kinney P, Camann D, Barr D, Bernert T, Garfinkel R, Tu YH, Diaz D, Dietrich J, Whyatt RM. Effects of transplacental exposure to environmental pollutants on birth outcomes in a multiethnic population. Environ Health Perspect. 2003;111(2):201–5. doi: 10.1289/ehp.5742. [DOI] [PMC free article] [PubMed] [Google Scholar]
- 44.Pycke BF, Geer LA, Dalloul M, Abulafia O, Jenck AM, Halden RU. Human Fetal Exposure to Triclosan and Triclocarban in an Urban Population from Brooklyn, New York. Environ Sci Technol. 2014 doi: 10.1021/es501100w. [DOI] [PMC free article] [PubMed] [Google Scholar]
- 45.Wang L, Wu Y, Zhang W, Kannan K. Characteristic profiles of urinary p-hydroxybenzoic acid and its esters (parabens) in children and adults from the United States and China. Environ Sci Technol. 2013;47(4):2069–76. doi: 10.1021/es304659r. [DOI] [PubMed] [Google Scholar]
Associated Data
This section collects any data citations, data availability statements, or supplementary materials included in this article.