Abstract
The membrane-surface migration of curvature-inducing proteins in response to membrane curvature gradients has been investigated using Monte Carlo simulations of a curvilinear membrane model based on the Helfrich Hamiltonian. Consistent with theoretical and experimental data, we find the proteins that generate curvature can also sense the background membrane curvature, wherein they preferentially partition to the high curvature regions. The partitioning strength depends linearly on local membrane curvature and the slope (or the coupling constant) of the partitioning probability versus mean curvature depends on the membrane bending rigidity and instantaneous curvature field caused by different proteins. Our simulation study allows us to quantitatively characterize and identify the important factors affecting the coupling constant (slope), which may be difficult to determine in experiments. Furthermore, the membrane model is used to study budding of vesicles where it is found that in order to stabilize a mature vesicle with a stable ‘neck-region’ (or stable membrane overhangs), the area (extent) of the intrinsic curvature region needs to exceed a threshold-critical value. The migration and partitioning of curvature-inducing proteins in a budding vesicle with a stable neck (with a characteristic negative value of the Gaussian curvature) is investigated.
Keywords: Monte Carlo simulations, Helfrich Hamiltonian, curvilinear model, curvature inducing proteins, clathrin-mediated endocytosis (CME), epsin N-terminal homology (ENTH) domain proteins, Bin Amphysin Rvs (BAR) domain proteins
1. Introduction
Cellular processes, such as endocytosis and cell motility, depend on the dynamic induction of curvature in the cell membrane or internal compartments [1]. While phospholipid asymmetry can result in lipid bilayers with non-zero spontaneous curvature, some stable curved membranes [2] and bilayer remodelling processes are driven by proteins (such as those with the epsin N-terminal homology or ENTH domains, Bin Amphysin Rvs or BAR domains) with curvature-inducing and curvature-sensing properties. Curved membranes can also serve to recruit curvature-sensing proteins to drive cellular processes, and therefore understanding the migration of such curvature-inducing proteins in response to regions of membrane curvature is crucial to understanding the dynamics of these processes.
In the case of clathrin-mediated endocytosis, growth of the clathrin coat and membrane invagination proceed in tandem. Concomitantly with the addition of clathrin triskelia to the coat, curvature is induced by membrane-binding proteins in the plasma membrane around the coat, stabilizing a growing bud on the cell surface [3]. The initial membrane deformation occurs during the nucleation and growth of clathrin-coated pits (CCP) [4]. As the spherical bud begins to emerge, a tubular neck region with large negative Gaussian curvature begins to form in the membrane; this region is subject to a large curvature, which is thought to attract proteins containing curvature-sensing N-BAR domains such as amphiphysin and endophilin [5]. In the presence of this high degree of curvature, it is thought that amphiphysin localizes to the membrane and simultaneously recruits dynamin there [6,7]. Dynamin frees amphiphysin to produce a greater membrane curvature to tighten the neck region of the bud and allows the vesicle to bud/pinch-off completely. The driving forces for how such curvature-inducing and sensing proteins migrate in curved membrane topologies is the subject of this article.
Membrane phase and dynamical behaviour have been modelled both in atomistic detail and with coarse-grained models [8,9]. Modelling efforts have been successful in delineating individual interactions between the membrane and membrane-bound biomolecules [8,10], in describing micelle formation and vesicle fusion [11,12], and in characterizing the elastic properties of membranes [13]. Phenomenological theories based on generalized elasticity (Ginzburg–Landau) [14] have also been used to describe meso- and macroscopic behaviour of membranes, membrane undulations, and curvature modulations. These models have been extensively employed, and specific choices of the governing equations (e.g. the form for membrane free energy) have been validated based on experimental studies [15]. Mechanistic models for cell membrane deformation and vesicle budding in the cellular context based on the elastic free energy formulations have been proposed [16], and these studies have further motivated the development of models for protein diffusion in ruffled surfaces [17] and the simultaneous diffusion of protein and membrane dynamics [7,18–20].
Interestingly, migration of trans-membrane and peripheral curvature-inducing proteins can be driven via both static membrane curvature gradients and dynamic membrane fluctuations. These material fluxes result from the interplay between membrane curvature, membrane-tension, and membrane-entropy mediated chemical potential gradients. Several recently discovered protein membrane-binding domains have been postulated to assemble in a process that is driven by membrane curvature and membrane tension and in the process induce local deformations of the bilayer [21]. During the process of endocytosis, clustering of proteins with the ENTH domain in regions of background mean curvature [7] have been reported. This has motivated the study of aggregation and phase separation properties of generic inclusions on bilayer membranes [22]. It has been demonstrated that curvature-inducing proteins will aggregate and induce budding even in the absence of a direct attractive potential [12], and even in the face of a small repulsive force between proteins.
While closed-form solutions for interactions between more than two inclusions are difficult to obtain, simulations of protein migration in the presence of curvature fields can be highly instructive. Here, we employ a simulation methodology to investigate the behaviour of curvature-inducing inclusions on curved, thermally undulating membrane surfaces, in order to systematically identify protein partitionings versus curvature during vesicle budding. Section 2 describes the numerical implementation of the Monte Carlo method for membrane surface evolution at constant temperature and protein migration. The numerical results along with discussion are presented in Section 3, with concluding remarks provided in Section 4.
2. Methods
2.1. The Helfrich Hamiltonian
We model the energetics of protein-induced curvature on lipid bilayer membranes using the Helfrich Hamiltonian [23] which is described as:
| (1) |
where κ is the elastic bending rigidity, is the Gaussian curvature modulus, H = 1/2(c1 + c2) and K = c1 c2 are the mean and Gaussian curvatures, c1 and c2 are the two principal curvatures, and H0 is the spontaneous curvature of the membrane. Considering only those membrane shapes for which the overall membrane topology does not change, the contribution of Gaussian curvature to the Helfrich Hamiltonian in Equation (1) is a constant and therefore is neglected in our simulations. Within the Helfrich Hamiltonian, the effect of protein-induced curvature is treated through the spontaneous curvature H0 term [22] which, in general, is a spatially varying function, as discussed in detail in Section 2.3.
2.2. Triangulated curvilinear model for membrane
In our model the membrane surface is discretized by a triangulation system consisting of (N + 1)2 vertices connected by 3N2 + 2N links, here N is the number of links in each side of the square membrane. The total number of triangles is (2N2). Therefore the total Helfrich energy for bending elasticity associated with mean curvature (i.e. dropping the Gaussian curvature term) can be calculated by summation over all the vertices:
| (2) |
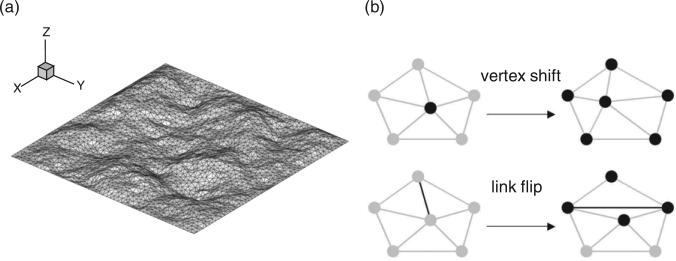
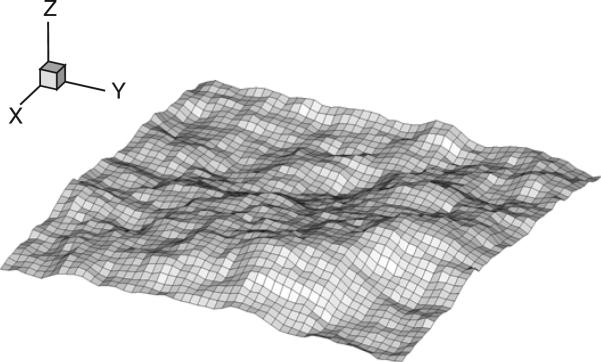
Here, A(v) is the average surface area around vertex v. The two principal curvatures at vertex v are computed very efficiently through the transformation between the global Cartesian frame and local Darboux frame, (see [24] for a detailed description). The inclusions influence membrane topology by inducing spontaneous curvature H0. The equilibrium properties of the membrane-inclusion system are evaluated using a Monte Carlo (MC) technique [24]. The MC steps are divided into two classes; Vertex shift: as indicated in Figure 1(b) (top), the vertex (circle in the left) is randomly selected and an attempt is made to move it to a new position. In this step, the mean curvatures and therefore the Helfrich energies on all the connecting vertices (circles in the right) are updated, based on which the attempt is accepted or rejected. The step-size of the vertex movement is adjusted to ensure the acceptance rate ~30–50%. Link flip: as indicated in Figure 1(b) (bottom), the link (line in the left) connecting two vertices is randomly selected and an attempt is made to flip to the pair of opposite vertices. During this step, the mean curvatures and therefore the Helfrich energies on four related vertices (circles in the right) are recalculated, based on which the attempt is accepted or rejected.
Figure 1.
(a) The membrane discretization in the triangulated curvilinear model and (b) schematic illustration of vertex shift and link flip moves.
For each of the movements, the energy of the new conformation is computed and the acceptance probability is based on the Metropolis criteria by comparing with old conformation energy. The duration of the simulation is measured in Monte Carlo steps and each step contains (N + 1)2 vertex shifts and (3N2 + 2N) link flips. The simulation size is 250 nm × 250 nm and a fixed boundary condition (where the membrane curvature at the boundaries is pinned to assume a zero value) is applied. The number of links in each side of the boundary is N = 50.
2.3. Model for protein migration on membrane
In this work, as shown in Figure 2, a number of diffusive curvature-inducing proteins are placed onto the membrane surface. We model the curvature inducing proteins as localized migrating intrinsic curvature fields. Direct protein–protein interactions are only limited to a no-overlap criteria due to a size exclusion (i.e. repulsive interactions on the scale of the size of the solvated protein) [22]. However, indirect protein–protein interactions are dominant as the curvature fields interact through the Helfrich energy mediated by membrane undulations and curvature. Based on experimental observation [25] that addition of proteins such as epsin possessing an ENTH domain to lipids leads to tubulation of vesicles, we model the membrane curvature induced by each epsin, i as a Gaussian function with a range bi and magnitude C0,i:
| (3) |
where xi and yi are the x and y coordinates of the ith epsin on the membrane. The nature of the curvature function, namely Gaussian, is chosen to mimic a localized presence of curvature; in earlier studies, we have explored the effect of different functions (namely Gaussian versus Cosine functions) and verified that the results are insensitive to the nature of the functions but only sensitive to the magnitude and the range of the curvature field [22,26]. The values of the magnitude and range of the curvature functions are chosen based on agreement with independent biophysical experiments; a detailed description is provided later in Section 3.1.3. The positions of epsins are evolved along the x, y plane using Monte Carlo moves; later in Section 3.2.2, we evolve the epsins along the curvilinear manifold rather than the x, y plane. When multiple proteins are present on the membrane, the resulting protein-induced membrane curvature is calculated as:
| (4) |
where Ne is the number of proteins present on the membrane. We choose bi = 8.3 nm while the value of C0,i was set to be 0.075 nm–1, consistent with the properties of epsin (ENTH domain) interacting with membranes, as described in our previous work [27]. Extensions to anisotropic structural effects reminiscent of proteins with N-BAR domains will also be briefly discussed in Section 3.2.3.
Figure 2.
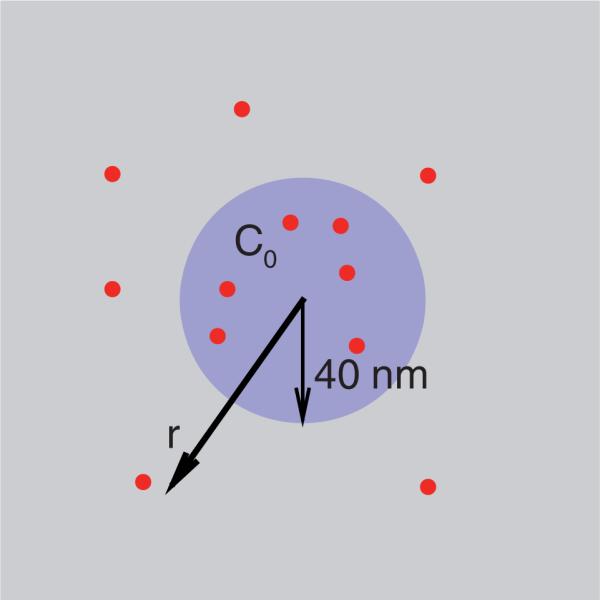
Schematic illustration of protein migration in response to the membrane curvature field: square – membrane patch; large circle – static intrinsic curvature field such as due to clathrin coat; dots – intrinsic curvature fields due to migrating proteins such as epsins.
In addition to the local curvature induced by proteins described above, a background curvature (see Figure 2) induced in the membrane such as due to presence of a clathrin coat is modelled as [28]:
| (5) |
where Γ (r0) is a function that is unity within a circular domain (centred at zero) of radius r0 and zero otherwise; r0 is the linear extent (radius) of the curvature-field induced by clathrin and projected on the x–y plane; and C0 is the magnitude of clathrin-induced curvature. It is to be noted that one rationale for imposing constant curvature due to the clathrin coat is that clathrin has an intrinsic pucker and can spontaneously assemble into cages in vitro at high concentrations; in addition, the clathrin lattice can bind curvature-inducing proteins and the assembly as a whole can provide a mean curvature field in the given area of the clathrin coat. Hence, in our simulations, we explore a range of C0 values. Finally the net intrinsic curvature at any position is then expressed as:
| (6) |
where the max operator denotes the maximum of the two values.
2.4. Monte Carlo evolution
Both epsin diffusion and membrane surface evolution are performed using Monte Carlo simulations at constant temperature. Each iteration consists of 50 × (N + 1)2 steps of membrane evolution and 50 × Ne steps of epsin diffusion. In each membrane evolution step, one vertex is randomly selected to proceed vertex shift and one link is randomly selected to proceed link flip, the procedures are described in Section 2.2. The total energy of the system is monitored and after the system reaches steady state, we average the results over 40,000 Monte Carlo steps and over four independent realizations to obtain statistics. The statistical error bars are calculated based on the four different realizations and reported as one standard deviation.
3. Results and discussion
3.1. Protein migration and partitioning in response to membrane curvature
We set up our models to investigate the migration of the curvature-inducing proteins (epsins with an ENTH domain) in response to the background (clathrin induced) membrane curvature deformations. The radius of the circular domain representing the clathrin coat is fixed at r0 = 40 nm and the magnitude of the clathrin induced curvature C0 is varied between 0.0 and 0.1 nm–1. The clathrin coat is fixed with its centre at 0. The number of epsins is fixed at Ne = 50; the epsins are allowed to migrate on the membrane.
3.1.1. Membrane profiles
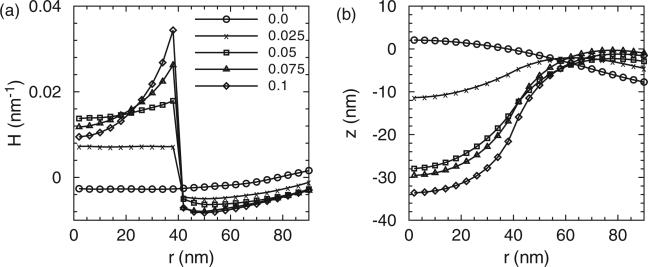
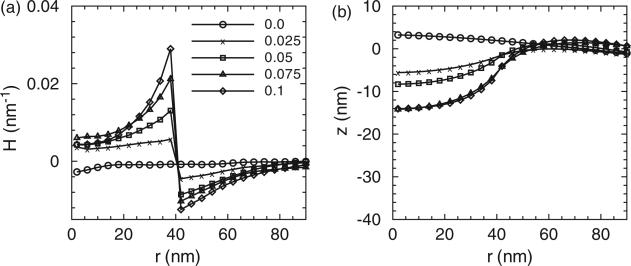
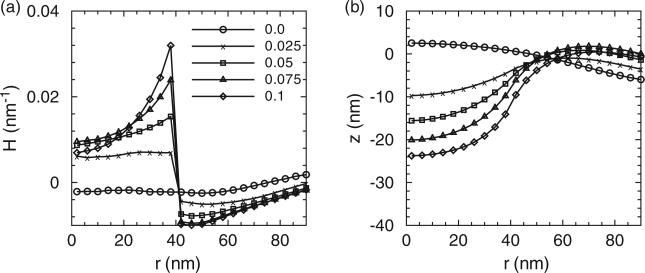
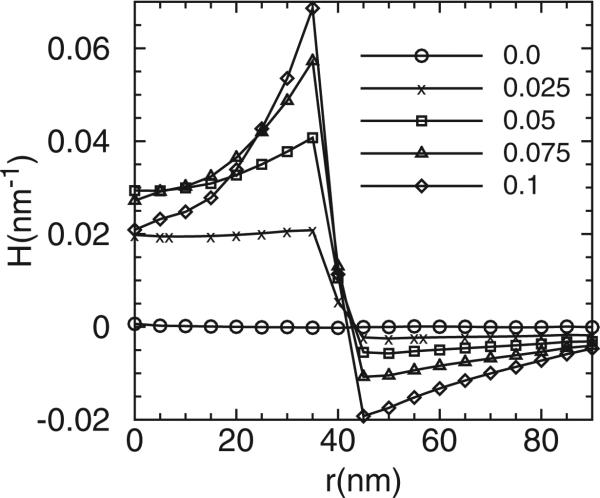
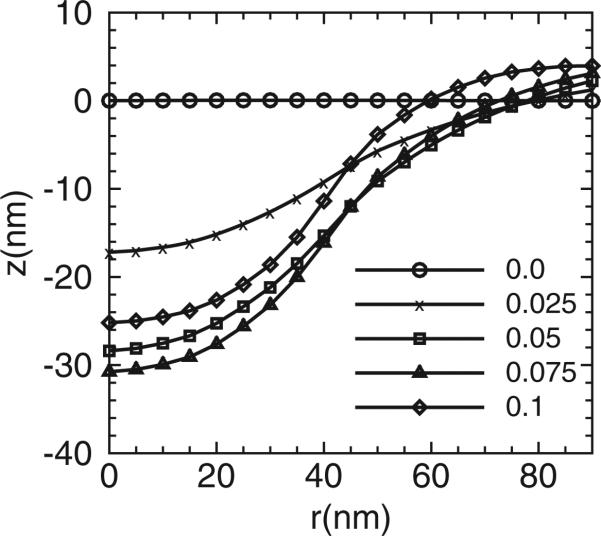
Figures 3–5 show (a) the distribution of membrane mean curvature H and (b) vertical displacement z as a function of distance from the centre for three different membrane bending rigidities. Different lines (symbols) are results from different values of C0 in units of nm–1. As illustrated, the magnitude of the mean curvature increases with C0 but the profiles are far from constant within the coat area. The vertical displacement distributions show the primary shapes of the membrane. The membrane shapes are smooth and we do not record formation of neck regions even at the highest C0; this is due to the implementation of the background curvature. The formation of the neck-region is discussed later in Section 3.2.1. As a consequence of the fixed boundary condition, H is slightly negative and z is slightly positive in the centre region for all the due to the presence of induced curvature by epsins even when C0 = 0.
Figure 3.
(a) The distribution of the mean curvature and (b) vertical membrane displacement as a function of distance from the membrane centre. Here r is the projected distance on the x, y plane and not the curvilinear distance along the membrane. Different lines (symbols) are results from different clathrin curvature C0. The membrane bending rigidity is κ = 20kBT. 50 epsins are included in our simulations.
Figure 5.
The (a) distribution of the mean curvature and (b) vertical membrane displacement as a function of distance from the membrane centre. Different lines (symbols) are results from different clathrin curvature C0. The membrane bending rigidity is κ = 5kBT.
3.1.2. Epsin partitioning
Recently, Capraro et al. [20] measured the distribution of the epsin N-terminal homology on cylindrical lipid membrane tethers by measuring the ratio of protein to lipid fluorescence intensities. The authors monitored the fluorescence intensities at different values of the externally applied membrane tension σ (or mean background curvature, see below), which was controlled by micropipette aspiration. The fluorescence intensities directly measure the relative local concentrations of the epsins, and the local mean curvature H of the membrane scales as H ~ σ1/2. The experimental measurements confirmed the linear dependence of the protein concentration with σ1/2, which led the authors to conclude that the epsins bind preferentially to high curvature membrane regions.
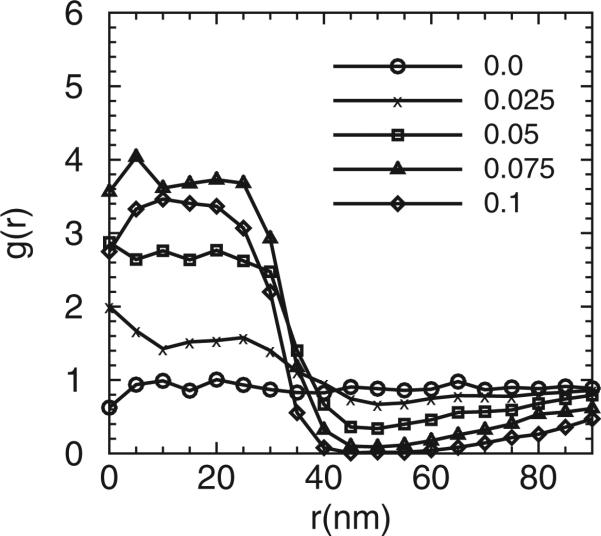
Using our MC simulations, we quantify the spatial distribution of the epsins in response to the clathrin-induced curvature as a partition coefficient g(r); g(r) effectively reflects the relative epsin concentrations at a given position r in a given system relative to the system without any background curvature. It is computed from a histogram of the number of epsins at a given radial position for a given C0 of the coat relative to the histogram for C0 = 0. Note that g(r) is a partition coefficient and is different from the radial distribution function.
Figure 6 shows the distributions of g(r) of the epsins at three different κ. Interestingly, as indicated, the epsins collectively not only generate curvature, but can also sense background curvature fields. The epsins tend to aggregate to the regions with high curvatures at r ≤ 40 nm. The extent of aggregation/partitioning strongly depends on the local curvature as well as the membrane bending rigidity.
Figure 6.
Epsin partitioning as a function of distance from the membrane centre for membrane bending rigidities of (a) 20kBT, (b) 10kBT and (c) 5kBT.
3.1.3. Parameter sensitivitity and comparison with experiment
In [20], an analytical expression for the dependence of epsin ENTH concentration on the local membrane curvature based on a mean-field model was derived. In the expression, the epsin ENTH segregation varies linearly with local curvature. The slope is determined by the curvature-composition coupling parameter, Λ, see below. By measuring the relative fluorescence intensity as a function of applied membrane tension , the linear dependence was recovered and by fitting the experimental data to the analytical expression, for the first time the coupling parameter Λ was determined. It has been shown [29] that Λ = –κCα under certain approximations of the spontaneous curvature model; here is the membrane bending rigidity and Cα is a fitted parameter related to the average spontaneous curvature of protein, α.
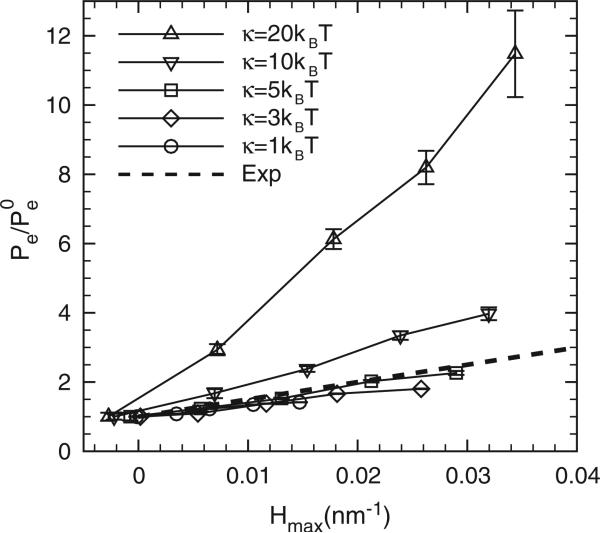
The generality of the membrane as well as the protein models allows us to investigate a wide range of tunable parameters affecting the sensitivity to protein partitioning (or Λ). To enable comparison with experiments [20], we quantify epsin partitioning in Figure 6 by computing the averaged epsin concentrations Pe at different C0s relative to the result of at C0 = 0 inside the clathrin coat r ≤ 40 nm; we then plot the data as a function of maximum mean curvature measured in Figures 3(a), 4(a) and 5(a). Figure 7 shows the epsin partitioning as a function of maximum clathrin curvature at different membrane bending rigidities κ. The thick dashed line is from the experimental data reported in [20]. The epsin partitioning varies linearly with the local background curvature and the slope depends on κ. By analysing the experimental data, the effective membrane bending rigidity was ~13kBT, however, as shown in Figure 7, our numerical data with κ = 5kBT show the best fit to the experimental results. The discrepancy can be explained by considering that Cα (a fitted parameter in the experiment) has a large bearing on the slope (in Figure 7), which is directly related to the curvature field of a single epsin employed in our calculations, see below.
Figure 4.
(a) The distribution of the mean curvature and (b) vertical membrane displacement as a function of distance from the membrane centre. Different lines (symbols) are results from different clathrin curvature C0. The membrane bending rigidity is κ = 10kBT.
Figure 7.
The effect of membrane bending rigidity κ on the epsin partitioning. The thick dashed line shows the experimental results from [20]. The error bars are based on four independent realizations.
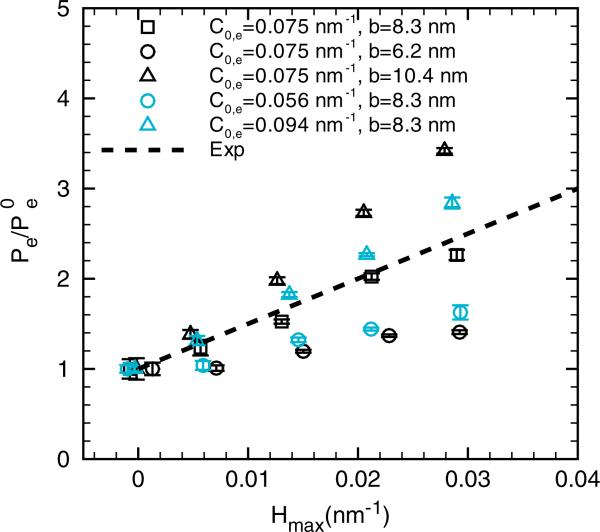
In our model, the epsin-induced curvature is controlled by two adjustable parameters: C0,e and b which define the two-dimensional Gaussian function. In principle, these two parameters should be determined from experimental data for each protein type. Indeed, as described in Section 2.3 and [27], these parameters are chosen for epsin based on independent biophysical experiments: in particular, C0,e was chosen as 1/R, where R is the characteristic radius of the cylindrical tubules induced by epsin, when mixed with phospholipids. Then the value b was chosen such that the induced membrane strain energy by a single epsin or ENTH domain is equal to its binding free energy with phosphoinositol bisphosphate (or PIP2), a lipid that ENTH domains bind to. The assmption behind the choice for b is that all of the binding free energy between ENTH domains and PIP2 contribute to the membrane strain, which is is clearly the upper limit on how much strain (or curvature) an ENTH domain can induce. In reality, the choice of b will be smaller because we expect that only a fraction of the binding free energy contributes to the membrane strain inducing the curvature. Hence, to assess sensitivity to these parameters, we fix κ at 5kBT and vary C0,e and b each by 25%. Figure 8 shows that clearly increasing the values of C0,e and b increase the slope, quantifying the sensitivity of the partitioning (or Λ) on the parameters determining the extent of protein-induced curvature. Noting the sensitivity, we can rationalize that for κ = 13kBT, a slightly smaller value of b (accounting for a smaller fraction of the binding free energy) can also yield a slope consistent with the experimentally measured slope. Hence, the significance of our sensitivity analysis is that it now provides a direct means to interpret what fraction of the total binding free energy contributes to straining the membrane (or inducing intrinsic curvature) for a given value of the bending rigidity. Our results also give a physical and quantitative interpretation to the fitted parameter Cα employed in the experimental study of Capraro et al. [20].
Figure 8.
The effect of epsin parameters C0,e and b on the epsin partitioning. The membrane bending rigidity is fixed at κ = 5 kBT. The thick dashed line shows the experimental results from [20]. The error bars are based on four independent realizations.
3.2. Protein partitioning during vesicle budding (endocytosis)
3.2.1. Effect of coat area on vesicle budding
Recently, Agrawal et al. [27] investigated the role of the curvature-inducing protein epsin in CME using a simple one-dimensional surface evolution model and identified a critical size of the coat area above which a fully mature vesicular bud with a clear neck region was stabilized. Their model also provided an estimate of the number of epsins required to stabilize the vesicular bud and reproduced the distribution of vesicular intermediates observed in experiments. However, the authors assumed axisymmetric geometries and neglected thermal effects. We implement the curvilinear model to study the CME, by considering a simulation domain of 500 nm × 500 nm. We fixed the membrane bending rigidity at κ = 20 kBT and the magnitude of the clathrin-induced curvature at H0 = 0.1 nm–1. Similar to the method in [27], we explored the effect of increasing clathrin coat area as the surfaced area of the deformed surface over which the background curvature is applied; we note that this area is different from the projected two-dimensional area that was applied in Section 2.3. In particular, for results described in this section, the coat area as well as the curvature fields in equations (3), (4), and (5), are applied along the curvilinear surface and not the projected x, y plane; see section 3.2.2. As the area of the clathrin coat was increased, the membrane profiles experience a spontaneous budding event: Figure 9 shows the the steady state membrane profiles at different areas of the clathrin coat (a) Ac = 1960 nm2, (b) 3850 nm2 and (c) 15,390 nm2. As shown, for the case of the largest coat area, a mature bud with a characteristic neck region is stabilized.
Figure 9.
The three-dimensional membrane profiles at different coat areas. (a) Ac = 1960 nm2, (b) Ac = 3850 nm2, and (c) Ac = 15,390 nm2; here κ = 20 kBT. We note that we have chosen to depict the buds to nucleate upwards. However, in the z(r) and z(s) plots, we depict the deformation as occurring downwards.
3.2.2. Epsin partitioning during vesicle budding
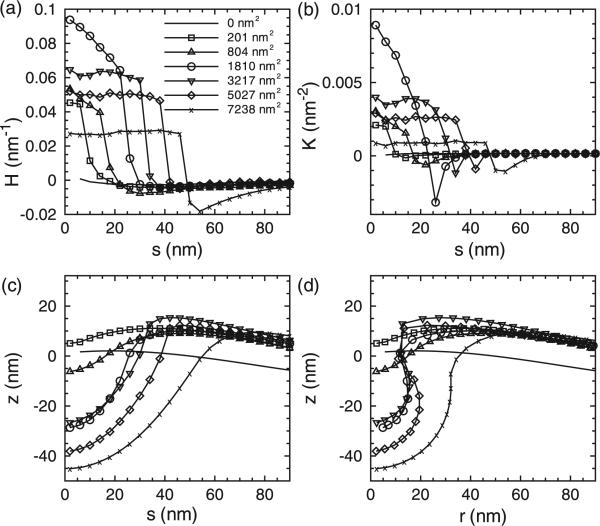
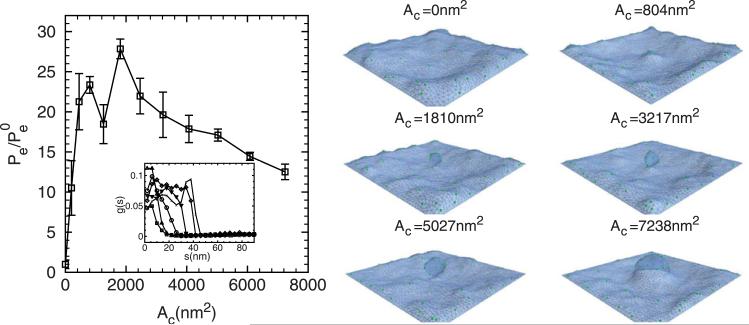
To study the epsin partitioning during the budding processes, we simultaneously evolve the epsins and the membrane such that the epsins move along the curvilinear manifold of the budding membrane; we denote this coordinate as s, i.e. along the membrane surface, as opposed to the projected distance r defined before. In this scenario, due to the large deformations near the neck region of the bud, the arc length s is a more suitable variable to monitor distances rather than the radial distance r; in this case, s = 0 defines the centre of the coat. In our simulations, the membrane bending rigidity is fixed at 20 kBT, the intrinsic curvature induced by clathrin C0 is set at 0.1 nm–1 and the clathrin coat area Ac is increased systematically; all the other parameters are kept the same as before. Figure 10 shows the mean curvature, Gaussian curvature and vertical displacement distributions as a function of arc length from the centre of the membrane/coat. Figure 11 shows the epsin partitioning for different clathrin coat areas, where (as described earlier) the epsin partitioning is calculated based on the epsin distribution as shown in the inset. As evident from the snapshots on the right, the segregation of epsins initially increases as the capsid develops and grows, and then plateaus as the bud is formed and gets extended beyond a threshold coat area. Our results in Figure 11 show that the partitioning of epsins in a growing bud occurs similar to that in a capsid (see Figure 6) indicating that the mean curvature still dominates the partitioning behaviour.
Figure 10.
The distributions of (a) mean curvature, (b) Gaussian curvature and (c) vertical displacement as a function of arc length s from the centre of the membrane. The membrane bending rigidity is κ = 20 kBT and the intrinsic clathrin curvature is fixed at C0 = 0.1 nm–1, different symbols represent results with different clathrin coat areas. 50 epsins moving along s were included in these simulations.
Figure 11.
The partitioning of the epsins during budding as a function of clathrin coat areas. The inset shows the epsin distribution as a function of arc length. We note that in the representative snapshots, we have chosen to depict the buds to nucleate upwards. However, in the z(r) and z(s) plots, we depict the deformation as occurring downwards. The membrane bending rigidity is κ = 20 kBT and the intrinsic clathrin curvature is fixed at C0 = 0.1 nm–1.
3.2.3. Anisotropic effect
As an extension of our model, we included the effect of anisotropy in curvature induction for certain proteins; in particular, the BAR domain proteins are believed to induce anisotropic curvature fields on membranes. In recent work, we modelled such anisotropic fields using elliptic curvature field functions [30] and determined the orientational angular distributions of the ellipses during the vesicle bud formation [30]. For an elliptical Gaussian curvature field with an aspect ratio of 3, we found that the orientational distribution of the ellipses was peaked at a preferencial angle indicating that the ellipses align with their major axis tangential to the locus traced by the neck constriction. These results suggest that while mean curvature fields play a leading role in determining protein partitioning, (negative) Gaussian curvature can also play a significant role in systems inducing anisotropic curvature fields by providing a driving force for orientational reconfigurations in the neck region. Such an effect is significant in enabling the self-assembly of neck-stabilizing proteins such as BAR domains and bud-pinchase proteins such as dynamin.
4. Conclusions
Monte Carlo simulations on a curvilinear model for membranes has been implemented to study the protein (epsin) migration and partitioning in response to membrane deformations induced by a background intrinsic (clathrin-induced) curvature. Our modelling and simulation results predict preferential epsin partitioning to high curvature regions of the membrane, suggesting that the curvature-inducing epsins can also sense curvature fields. The epsin concentration increases linearly with increase in local mean curvature field, which is consistent with recent theoretical and experimental studies [20]. The model allows us to quantitatively characterize the effects of the membrane bending rigidity κ and epsin-induced instantaneous curvature on the slope. The slope of epsin partitioning versus mean curvature increases with κ and the instantaneous curvature, which is in agreement with both the theoretical analysis and experimental measurements reported in [20].
The attractive feature of the curvilinear model is that it can overcome the small deformation limit in traditional linear models (see Appendix 1, supplementary material), and accommodate extreme deformations; as we demonstrate here, this feature enables the study of vesicle budding in the context of clathrin-mediated endocytosis. With respect to CME, we showed that a critical size (area) of the coat is required to stabilize a mature bud with a characteristic neck region. This result is consistent with our previous findings using one-dimensional axisymmetric surface evolution model [27]; moreover, we extend the results of the surface evolution study by (1) considering finite temperature effects, (2) protein partitioning on budding surfaces, and (3) the orientational assembly of proteins inducing anisotropic curvature fields. While cases (1) and (2) are dominated by regions of non-zero mean curvature, in case (3) the regions of negative Gaussian curvature (neck-regions) play a significant role. Our results quantify the thermodynamic driving forces determining the partitioning behaviour, which are very significant in understanding the spatial assembly of accessory (curvature-inducing) proteins in elementary cellular trafficking processes including CME.
Acknowledgements
We thank Dr. Ramakrishnan and Dr. Sunil Kumar for sharing the curvilinear MC code used in this study. This work was supported by National Institute of Health (NIH) Grants R01-EB006818, R01-HL087036, and National Science Foundation Grants CBET-0853389 and CBET-0853539. Computational resources were provided in part by the National Partnership for Advanced Computational Infrastructure under Grant No. MCB060006.
Appendix 1. Supplementary material: protein migration using linear membrane model
In addition to the Monte Carlo curvilinear membrane model discussed in this article, we also explore the possibility of applying the linear membrane model for studying of protein migration. As illustrated in Figure 12, in this model the membrane surface is discretized by a two-dimensional regular mesh and for small deformations, the membrane shape is approximated in a Monge or a Cartesian gauge as z = z(x, y). The resulting Helfrich Hamiltonian obtained by linearizing the expressions for the mean curvature and the differential area element in Equation~(1) is given by [22]:
| (7) |
Figure 12.
The membrane discretization in the Monge linear model.
The equilibrium sampling of membrane conformations according to the Boltzmann distribution for a given functional form of H0(x, y) is performed using the Time-Dependent Ginzburg Landau (TDGL) simulations, using a protocol employed in our previous work [22,31]. In this protocol, we generate new membrane configurations from existing ones by numerically integrating the equation:
| (8) |
where,
| (9) |
In Equation (8), t represents a fictitious time, M is a scalar mobility term and ξ is the thermal noise term, which is drawn randomly from a Gaussian distribution with zero mean and with variance depending on the temperature T, i.e. 〈ξ(r, t)〉 = 0 and 〈ξ(r, t)ξ(r′, t′)〉 = 2kBTMδ(t – t′)δ(r – r′). This ensures that membrane configurations generated by Equation (8) are consistent with the canonical ensemble with probability ∝ exp(–E/kBT).
Our simulations are performed for a square system with size of L × L in x, y dimensions, respectively, with periodic boundary conditions implemented in the xy plane. In this work, we have chosen L = 250 nm. For each system, the membrane is discretized using a 50 × 50 set of uniform spatial grid points in the xy plane. All the derivatives on the right-hand side of Equation (9) are approximated using a second-order centred-difference scheme. TDGL equations are then integrated in time using an explicit Euler scheme. We choose a value of M ( = 2.5 × 10⁻⁶ m2 s kg–1), this value was also used in our previous work [28]. The time-step of integration Δt is set to be 1 ps based on linear stability analysis [28]. Additionally, we note that our results for the equilibrium properties of the membrane have been verified to be independent of the value of the mobility term, M.
The linear model was set up to study the proteins’ (epsins with ENTH) migration in response to the background curvature C0. The clathrin coat is within a circular domain of 40 nm and the magnitude of the clathrin-induced curvature C0 is varied between 0.0 and 0.1 nm–1, the number of epsins is Ne = 10 and the membrane bending rigidity is fixed at κ = 20kBT. Figures 13 and 14 show the distribution of the membrane mean curvature and the vertical displacement respectively. The results are qualitatively similar to the results from the curvilinear model (Figure 3), but the mean curvature and vertical displacement are nearly zero within the centre region for the C0 = 0 case. This is due to the different treatment of the boundary conditions: in the linear model, the periodic boundary conditions are imposed while in the curvilinear model the fixed boundary conditions are used.
Figure 13.
The distribution of the mean curvature as a function of distance from the membrane centre. Different lines (symbols) represent results from different clathrin curvature C0.
Figure 14.
The distribution of the vertical membrane displacement as a function of distance from the membrane centre. Different lines (symbols) represent results from different clathrin curvature C0.
Figure 15 shows the distributions of the partition coefficient g(r) for different background curvatures C0. Similar to the results from the curvilinear model results (Figure 6), the epsins aggregate to the regions with high curvatures, and the aggregation increases with the magnitude of the local curvature at low curvatures (below 0.075 nm–1); this is consistent with the observations from the curvilinear model. However, at the highest curvature field (0.1 nm–1), the aggregation is decreased. This is inconsistent with the results from the curvilinear model and the experimental measurements [20], where they both observed a monotonic increase of epsin aggregation with local curvatures. This may reflect the breakdown of the small deformation assumption involved in the linear Monge model under large curvatures.
Figure 15.
Epsin partition as a function of distance from the membrane centre. Different lines (symbols) represent results from different clathrin curvature C0.
References
- 1.McMahon HT, Gallop JL. Nature. 2005;538:590. doi: 10.1038/nature04396. [DOI] [PubMed] [Google Scholar]
- 2.Hu JJ, Shibata Y, Voss C, Shemesh T, Li ZL, Coughlin M, Kozlov MM, Rapoport TA, Prinz WA. Science. 2008;319:1247. doi: 10.1126/science.1153634. [DOI] [PubMed] [Google Scholar]
- 3.Hinrichsen L, Meyerhoiz A, Groos S, Ungewickell EJ. Proc. Natl. Acad. Sci. U.S.A. 2006;103:8715. doi: 10.1073/pnas.0600312103. [DOI] [PMC free article] [PubMed] [Google Scholar]
- 4.Henne WM, Boucrot E, Meinecke M, Evergren E, Vallis Y, Mittal R, McMahon HT. Science. 2010;328:1281. doi: 10.1126/science.1188462. [DOI] [PMC free article] [PubMed] [Google Scholar]
- 5.Ringstad N, Gad H, Low P, Di-Paolo G, Brodin L, Shupliakov O, De-Camilli P. Neuron. 1999;24:143. doi: 10.1016/s0896-6273(00)80828-4. [DOI] [PubMed] [Google Scholar]
- 6.Takei K, Slepnev VI, Haucke V, De-Camilli P. Nat. Cell Biol. 1999;1:33. doi: 10.1038/9004. [DOI] [PubMed] [Google Scholar]
- 7.Roux A, Koster G, Lenz M, Sorre B, Manneville JB, Nassoy P, Bassereau P. Proc. Natl. Acad. Sci. U.S.A. 2010;107(9):4141. doi: 10.1073/pnas.0913734107. [DOI] [PMC free article] [PubMed] [Google Scholar]
- 8.Khelashvili GA, Pandit SA, Scott HL. J. Chem. Phys. 2005;123(3):034910. doi: 10.1063/1.1943412. [DOI] [PMC free article] [PubMed] [Google Scholar]
- 9.Nielsen SO, Lopez CF, Srinivas G, Klein ML. J. Phys.: Condens. Matter. 2004;16(15):R481. [Google Scholar]
- 10.Pandit SA, Bostick D, Berkowitz ML. Biophys. J. 2003;85(5):3120. doi: 10.1016/S0006-3495(03)74730-4. [DOI] [PMC free article] [PubMed] [Google Scholar]
- 11.Grafmuller A, Shillcock J, Lipowsky R. Phys. Rev. Lett. 2007;98(21):218101. doi: 10.1103/PhysRevLett.98.218101. [DOI] [PubMed] [Google Scholar]
- 12.Reynwar BJ, Illya G, Harmandaris VA, Muller MM, Kremer K, Deserno M. Nature. 2007;447:461. doi: 10.1038/nature05840. [DOI] [PubMed] [Google Scholar]
- 13.Marrink SJ, Mark AE. J. Phys. Chem. B. 2001;105(26):6122. [Google Scholar]
- 14.Safran SA. Adv. Phys. 1999;48:395. [Google Scholar]
- 15.Chakraborty AK, Dustin ML, Shaw AS. Nat. Immunol. 2003;4:933. doi: 10.1038/ni1003-933. [DOI] [PubMed] [Google Scholar]
- 16.Veksler A, Gov NS. Biophys. J. 2007;93(11):3798. doi: 10.1529/biophysj.107.113282. [DOI] [PMC free article] [PubMed] [Google Scholar]
- 17.Naji A, Brown FLH. J. Chem. Phys. 2007;126(23):235103. doi: 10.1063/1.2739526. [DOI] [PubMed] [Google Scholar]
- 18.Brown FLH. Q. Rev. Biophys. 2011;44(4):391. doi: 10.1017/S0033583511000047. [DOI] [PubMed] [Google Scholar]
- 19.Baumgart T, Hess ST, Webb WW. Nature. 2003;425:824. doi: 10.1038/nature02013. [DOI] [PubMed] [Google Scholar]
- 20.Capraro BR, Yoon Y, Cho W, Baumgart T. J. Am. Chem. Soc. 2010;132:1200. doi: 10.1021/ja907936c. [DOI] [PMC free article] [PubMed] [Google Scholar]
- 21.Saffarian S, Cocucci E, Kirchhausen T. PLoS Biol. 2009;7(9):e1000191. doi: 10.1371/journal.pbio.1000191. [DOI] [PMC free article] [PubMed] [Google Scholar]
- 22.Agrawal NJ, Weinstein J, Radhakrishnan R. Mol. Phys. 2008;106(11):1913. doi: 10.1080/00268970802365990. [DOI] [PMC free article] [PubMed] [Google Scholar]
- 23.Helfrich W, Naturforsch Z. C: J. Biosci. 1973;28:693. doi: 10.1515/znc-1973-11-1209. [DOI] [PubMed] [Google Scholar]
- 24.Ramakrishnan N, Sunil-Kumar P, Ipsen JH. Phys. Rev. E. 2010;81:041922. doi: 10.1103/PhysRevE.81.041922. [DOI] [PubMed] [Google Scholar]
- 25.Ford MG, Mills IG, Peter BJ, Vallis Y, Praefcke GJ, Evans PR, McMahon HT. Nature. 2002;419:361. doi: 10.1038/nature01020. [DOI] [PubMed] [Google Scholar]
- 26.Weinstein J, Radhakrishnan R. Mol. Phys. 2006;104:3653. doi: 10.1080/00268970600997580. [DOI] [PMC free article] [PubMed] [Google Scholar]
- 27.Agrawal NJ, Nukpezah J, Radhakrishnan R. PLoS Comput. Biol. 2010;6(9):e1000926. doi: 10.1371/journal.pcbi.1000926. [DOI] [PMC free article] [PubMed] [Google Scholar]
- 28.Agrawal NJ, Radhakrishnan R. Phys. Rev. E. 2009;80(9):011925. doi: 10.1103/PhysRevE.80.011925. [DOI] [PMC free article] [PubMed] [Google Scholar]
- 29.Tian A, Baumgart T. Biophys. J. 2009;96:2676. doi: 10.1016/j.bpj.2008.11.067. [DOI] [PMC free article] [PubMed] [Google Scholar]
- 30.Ramanan V, Agrawal NJ, Liu J, Eangles S, Toy R, Radhakrishnan R. Integr. Biol. 2011;3:803. doi: 10.1039/c1ib00036e. [DOI] [PMC free article] [PubMed] [Google Scholar]
- 31.Lee SJE, Hori Y, Groves JT, Dustin ML, Chakraborty AK. Trends Immunol. 2002;23(10):492. doi: 10.1016/s1471-4906(02)02285-8. [DOI] [PubMed] [Google Scholar]


