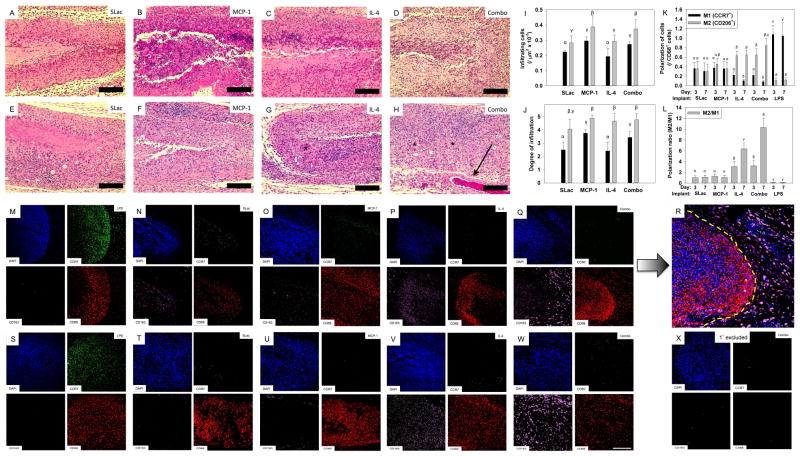
Figure 4. Characterization of cellular infiltrate.
H&E staining for infiltrating cells into SLac, MCP-1, IL-4 or Combo scaffolds, 3 day: A,B,C,D and 1 week: E, F, G, H, respectively. At early timepoints (3 day) cells can be seen infiltrating the implants with greatest infiltration in MCP-1 implants. All scaffolds show an increase in cellular infiltrate at the 7 day time points (I) and infiltration into the center of the scaffold (J), grey bar 3 day, black bar 7 day. Immunostaining to determine macrophage polarization at 3 day: M–R and 1 week: S–W. Majority of DAPI stained cells co-stain for macrophage marker CD68. LPS loaded scaffolds stain positive for CCR7 (M1 marker) and scaffolds loaded with IL-4 show increased staining for CD163 (M2 marker). (R) Composite image (of Q) showing influence of released cytokines (MCP-1 and IL-4) from scaffold (left of dotted yellow line) on recruitment and M2 polarization of macrophages in the vicinity of the implant (right of dotted yellow line). (K) Quantification of macrophage polarization showing increase in M2 polarization over time for IL-4 and combo scaffolds, (L). (X) Control: primary antibodies omitted. Full size images shown in Supplementary Figures 8–14. Similar Greek letter indicate no statistically significant difference (p<0.01). Scale bar: 200μm.

