

Total and noncalcified plaque indexes were associated with Framingham Risk Score and the 2013 American Heart Association risk score in asymptomatic individuals.
Abstract
Purpose
To assess the relationship between total, calcified, and noncalcified coronary plaque burdens throughout the entire coronary vasculature at coronary computed tomographic (CT) angiography in relationship to cardiovascular risk factors in asymptomatic individuals with low-to-moderate risk.
Materials and Methods
This HIPAA-compliant study had institutional review board approval, and written informed consent was obtained. Two hundred two subjects were recruited to an ongoing prospective study designed to evaluate the effect of HMG-CoA reductase inhibitors on atherosclerosis. Eligible subjects were asymptomatic individuals older than 55 years who were eligible for statin therapy. Coronary CT angiography was performed by using a 320–detector row scanner. Coronary wall thickness and plaque were evaluated in all epicardial coronary arteries greater than 2 mm in diameter. Images were analyzed by using dedicated software involving an adaptive lumen attenuation algorithm. Total plaque index (calcified plus noncalcified plaque) was defined as plaque volume divided by vessel length. Multivariable regression analysis was performed to determine the relationship between risk factors and plaque indexes.
Results
The mean age of the subjects was 65.5 years ± 6.9 (standard deviation) (36% women), and the median coronary artery calcium (CAC) score was 73 (interquartile range, 1–434). The total coronary plaque index was higher in men than in women (42.06 mm2 ± 9.22 vs 34.33 mm2 ± 8.35; P < .001). In multivariable analysis controlling for all risk factors, total plaque index remained higher in men than in women (by 5.01 mm2; P = .03) and in those with higher simvastatin doses (by 0.44 mm2/10 mg simvastatin dose equivalent; P = .02). Noncalcified plaque index was positively correlated with systolic blood pressure (β = 0.80 mm2/10 mm Hg; P = .03), diabetes (β = 4.47 mm2; P = .03), and low-density lipoprotein (LDL) cholesterol level (β = 0.04 mm2/mg/dL; P = .02); the association with LDL cholesterol level remained significant (P = .02) after additional adjustment for the CAC score.
Conclusion
LDL cholesterol level, systolic blood pressure, and diabetes were associated with noncalcified plaque burden at coronary CT angiography in asymptomatic individuals with low-to-moderate risk.
© RSNA, 2015
Introduction
Coronary artery disease (CAD) is the leading cause of death in men and women worldwide, accounting for 17 million deaths annually (1). Among all individuals who are diagnosed with CAD, 30%–50% are considered to have low-to-moderate risk of clinically important CAD according to current risk stratification tools (2,3). In an effort to further reduce the burden of atherosclerotic cardiovascular disease, updated guidelines for cholesterol-lowering therapy focus on aggressive lipid modification strategies to reduce the incidence of cardiovascular effects in both primary and secondary prevention care (4). At present, therapeutic strategies are focused on cardiovascular risk and serum cholesterol levels rather than on direct assessment of the extent of disease in the coronary arteries.
The current reference standard for quantification of atheroma is intravascular ultrasonography (US). However, the invasive nature of intravascular US limits its use to patients at high risk for CAD who are undergoing cardiac catheterization. Coronary artery calcium (CAC) score at computed tomography (CT) has been validated as an independent prognostic indicator of CAD (5,6). However, detection of “soft,” or noncalcified, plaque at coronary CT angiography may further enhance risk stratification and prognosis over the use of the CAC score alone (7–12). Recent analytic methods now allow quantification of atheroma throughout the entire coronary vasculature at coronary CT angiography (13,14). The CONFIRM registry (3) has reported the relationship of coronary CT angiography–defined atheroma in a large number of patients undergoing clinically indicated coronary CT angiography.
Most information to date about CAD and cardiovascular risk factors in asymptomatic individuals has been derived from the calcium score. We hypothesized that risk factors for the presence of noncalcified plaque may be different from those for the calcium score. In these analyses, we quantitatively evaluated the degree of atherosclerosis using an intravascular US–like method of quantification. Thus, the purpose of this study was to determine the relationship between total, calcified, and noncalcified coronary plaque burdens throughout the entire coronary vasculature at coronary CT angiography in relationship to cardiovascular risk factors in asymptomatic individuals with low-to-moderate risk.
Materials and Methods
Study Design
Two hundred two men and women older than 55 years who were eligible for statin therapy according to Adult Treatment Panel III guidelines were prospectively enrolled. The study was approved by our institutional review board, and written informed consent was obtained. Study subjects were evaluated as part of baseline assessment in the study Randomized Trial of Imaging Versus Risk Factor-Based Therapy for Plaque Regression (NCT01212900). Exclusion criteria included renal failure, concurrent non-statin lipid therapy. and hypersensitivity to iodinated contrast material. Thorough medical histories were obtained and physical examinations performed. Baseline analysis parameters included age, previous diagnosis of hypertension, diabetes, family history of premature cardiovascular death, past or present smoking history, systolic and diastolic blood pressure, body mass index, statin dose (expressed as simvastatin equivalent dose [15]), creatinine level, total cholesterol level, low-density lipoprotein (LDL) cholesterol level, high-density lipoprotein (HDL) cholesterol level, triglyceride level, and coronary imaging parameters. Framingham and American Heart Association (AHA) 2013 risk estimates were calculated by using on-treatment cholesterol values in patients who were taking statins at baseline, per current recommendations.
Image Acquisition
Each study subject underwent non–contrast material–enhanced CT for calcium scoring. CT was performed with a 320–detector row volumetric scanner (Aquilion ONE; Toshiba Medical Systems, Tustin, Calif) at a 0.5-mm section thickness. Unenhanced scanning parameters included a 350-msec gantry rotation, a 120-kV tube voltage, and a 140-mA tube current. CAC score was calculated by applying the Agatston method by using 3 mm of collimation at a 3-mm section increment (16). Coronary CT angiography was performed by using a 350-msec gantry rotation, a 100-kV tube voltage, and adaptive tube current (300–580 mA) that depended on the patient’s sex and body mass index. Intravenous iodinated contrast material (Isovue-370; Bracco Diagnostics, Singen, Germany) was administered on the basis of weight: For patients who weighed less than 59 kg, 50 mL was used; for patients who weighed 60–100 kg, 60 mL was used; and for patients who weighed more than 100 kg, 70 mL was used. Oral β-blockade drugs were administered if resting heart rate was greater than 70 beats per minute. A standard soft-tissue kernel (FC03) was used to reconstruct interpolated isotropic volume every 0.25 mm. The mean effective dose for coronary CT angiography was 4 mSv ± 2 (standard deviation).
Image Analysis
Plaque analysis was performed as previously described (13) using a QAngioCT workstation (Research Edition, version 2.0.5; Medis Medical Imaging Systems, Leiden, the Netherlands) by trained analysts (K.R., A.C.K., and P.P., each with 2 years of experience) who were overseen by a senior physician (C.T.S., with 5 years of experience). The coronary tree was automatically extracted, and each of the major vessels (the left anterior descending artery, the left circumflex artery, and the right coronary artery) were individually analyzed from the ostium to the point at which the internal vessel caliber decreased to less than 2.0 mm, exclusive of focal stenosis. Segmentation was performed according to AHA nomenclature (17). Segments with image artifact, stents, bypass vessels, or clips were excluded. Plaque nomenclature followed that of Miller et al (18). Proximal coronary segments were defined as C1, L1, L2, and R1 after Kwan et al (19). Analysis times ranged from 15 to 30 minutes per subject.
Automated longitudinal contouring of the inner lumen and outer wall was performed; results were manually adjusted when clear deviations were noted. Results of automated contouring of the inner lumen and outer wall were also reviewed on transverse reconstructed cross-sections of the artery on a section-by-section basis at 0.5-mm increments (Fig 1). Lumen attenuation was adaptively corrected on an individual-scan basis by using gradient filters in combination with the intensity values in the arteries, allowing for comparison between data sets (13).
Figure 1:

Images in 62-year-old man. Left: Coronary segmentation model of the coronary tree. Middle: A curved multiplanar reconstruction of the left anterior descending artery, with the lumen and external vessel walls marked. Right: Representative cross-sectional images, with green shading = noncalcified plaque.
Total plaque volume (calcified plus noncalcified plaque volume) was calculated by subtracting the lumen volume from the outer wall volume. The plaque burden per unit length was calculated as segmental plaque volume (in cubic millimeters) divided by the corresponding segment length (in millimeters), yielding the total plaque index (in square millimeters); noncalcified plaque index was calculated as the total volume index minus the calcified plaque index (in square millimeters).
Statistical Analysis
Sixty randomly selected scans were reanalyzed after a 3-month waiting period. Intraobserver (K.R.) and interobserver (K.R. and P.P.) reproducibility were analyzed for total plaque, calcified plaque, and noncalcified plaque components. Reproducibility was calculated by using intraclass correlation coefficients for intraobserver and interobserver analysis. Summary statistics for all continuous variables are reported as means ± standard deviations. Because the distribution of CAC was right skewed, the log-transformed CAC score [log(1 + absolute CAC score)] was used in the analysis. There was no significant difference in lumen attenuation between the three major coronary vessels (P = .38), so the mean lumen attenuation in the proximal right coronary artery was chosen as a representative value. Linear regression was used to identify factors that were associated with total plaque index, noncalcified plaque index, and CAC score after controlling for body size and lumen attenuation. Trivariate linear regression analysis was performed to examine the contribution of each factor, including age, sex, hypertension, systolic blood pressure, LDL cholesterol level, HDL cholesterol level, simvastatin dose equivalent, smoking and family history, creatinine level, and diabetes on total plaque index, noncalcified index, and CAC score after the adjustment for body size and lumen attenuation, while multivariable linear regression analyses were used to examine the joint effects of the above-mentioned 12 variables on the three outcome variables after adjustment for body size and lumen attenuation. P < .05 was considered to indicate a statistically significant difference. All statistical analysis was performed with R, version 3.0.2.
Results
Population Characteristics
Of the 208 individuals who were screened, a total of 202 asymptomatic subjects were included. Sixty-four percent were male, with a mean age of 65.5 years ± 6.9. The mean body mass index was 28.1 kg/m2 ± 7.3 (overweight category). About 59% of the subjects had a history of hypertension, 5.4% had diabetes, 29.3% had a family history of CAD, and 37.4% had a history of smoking. The mean Framingham risk score was 8.9 ± 5.1, and the mean AHA 2013 risk score was 12.1 ± 7.1. Demographic parameters are shown in Table 1.
Table 1.
Baseline Demographic Data and Laboratory and Imaging Measurements

Note.—Unless otherwise specified, data are means ± standard deviations, with ranges in parentheses. Data in three of the 202 initial subjects had to be discarded because of poor image quality. To convert cholesterol values to Système International (SI) units (millimoles per liter), multiply by 0.02586. To convert triglyceride levels to SI units (millimoles per liter), multiply by 0.01129. To convert creatinine levels to SI units (micromoles per liter), multiply by 88.4.
*Data are medians, with interquartile ranges in parentheses.
The median CAC score was 73 (interquartile range, 1–434). The left anterior descending coronary artery was found to be the most diseased vessel at visual analysis. Fifty-six subjects had a calcium score of 0. Quantification was performed in all three major vessels for 199 subjects. Three subjects’ data were excluded because of poor image quality due to motion artifact. Figure 2 shows the composition of total plaque according to CAC-score subgroup. Noncalcified plaque accounted for more than half of total plaque in each group. For very high CAC scores (>400), noncalcified plaque was approximately 67% of total plaque. For CAC scores from 11–100, noncalcified plaque was approximately 82% of total plaque volume.
Figure 2:

Graph shows total and noncalcified plaque composition (in square millimeters) as a function of CAC score. For very high CAC scores (>400), noncalcified plaque was approximately 67% of the total plaque index. For lower plaque scores (11–100), noncalcified plaque was approximately 82% of the total plaque index.
The Relationship of Plaque Burden to Risk Factors
Total plaque index was 23% greater in men than in women (42.06 mm2 ± 9.22 vs 34.33 mm2 ± 8.35, P ≤ .001) (Table 1); noncalcified plaque index was greater by 21% in men than in women (31.1 mm2 ± 6.6 vs 25.5 mm2 ± 6.7 mm2, P < .001). In minimally adjusted models (Table 2), total plaque index remained greater in men than in women (by 8.67 mm2, P < .001) and was associated with HDL cholesterol level (β = −0.09 mm2/mg/dL; P = .02), simvastatin equivalent dose (β = 0.5 mm2/10 mg; P = .01), and creatinine level (β = 11.2 mm2/mg/dL; P = .01). By comparison, Agatston CAC score showed similar associations as total plaque index but was not associated with HDL cholesterol level (Table 2) and was additionally associated with age and LDL cholesterol level. The 10-year Framingham risk score and AHA 2013 risk score were also positively associated with total coronary plaque index, noncalcified plaque index, and CAC score (Table 2).
Table 2.
Univariate Associations between Cardiovascular Risk Factors and Plaque Volume Index, Noncalcified Plaque Index, and CAC Score

Note.—Total plaque index and noncalcified plaque index were adjusted for lumen attenuation and body size (height).
In fully adjusted models (Table 3), total plaque index remained associated with male sex (β = 5.01 mm2, P = .03), and greater simvastatin dose equivalent (β = 0.44 mm2/10 mg eq; P = .02) but not serum creatinine level. Noncalcified plaque index was significantly associated with diabetes (β = 4.47 mm2, P = .03), greater systolic blood pressure (β = 0.8 mm2/10 mm Hg; P = .03), and higher LDL cholesterol level (β = 0.04 mm2/mg/dL; P = .02). When we additionally adjusted for CAC score, the noncalcified plaque index remained associated with LDL cholesterol level (β = 0.04 mm2/mg/dL; P = .02). In a sensitivity analysis, we substituted the ratio of total cholesterol to HDL cholesterol for LDL cholesterol level, and the total cholesterol–to–HDL cholesterol ratio was significant (P = .01, model not shown).
Table 3.
Multivariable Analysis of Cardiovascular Risk Factors in Relationship to Plaque Volume Index, Noncalcified Plaque Index, and Agatston CAC Score
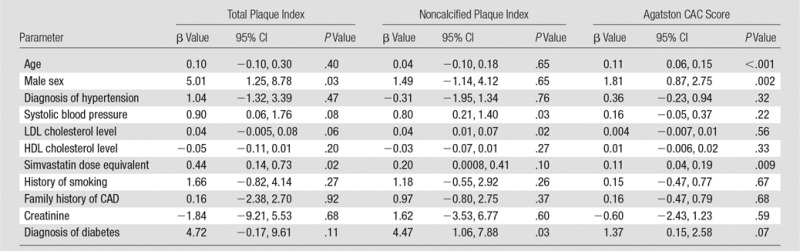
Note.—Total plaque index and noncalcified plaque index were adjusted for lumen attenuation and body size (height). CI = confidence interval.
We performed a similar assessment for CAC score in an adjusted model (Table 3). Major factors associated with greater CAC score in the multivariable model included age, sex, and simvastatin dose equivalent (Table 3). The calcified plaque index (the total plaque index minus the noncalcified plaque index) was uninformative (data not shown) and was associated only with male sex (3.94 mm2 greater compared with female sex, P = .005) in the adjusted model.
Proximal coronary segments (C1, L1, L2, and R1) contain larger-diameter vessels and thus may be more readily analyzed. We therefore repeated the above analyses as a sensitivity analysis using data from only the proximal coronary segments (Tables E1 and E2 [online]). The minimally and fully adjusted models (Tables E1 and E2, respectively [online]) showed similar relationships to risk factors as shown for the full coronary analyses.
Reproducibility
Table 4 shows that total plaque intraobserver reproducibility was excellent, with intraclass correlation coefficients ranging from −0.85 to 0.90. Intraobserver variability for plaque components was also very good, although slightly lower, ranging from 0.74 to 0.84.
Table 4.
Reproducibility of Imaging Variables
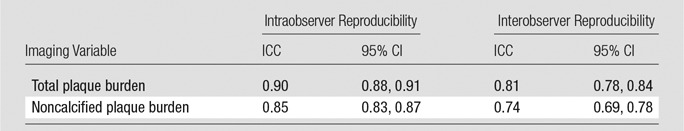
Note.—CI = confidence interval, ICC = intraclass correlation coefficient. Reproducibility was assessed for data in 60 randomly chosen subjects.
Discussion
Coronary plaque is ubiquitous in adults, but direct assessment of coronary atheroma volume has previously been routinely performed only in patients who are at high risk or symptomatic (3). Thus, the purpose of this study was to evaluate the clinical correlates of total coronary plaque burden at coronary CT angiography in asymptomatic individuals with low-to-moderate Framingham risk. An intravascular US–like assessment of plaque burden at coronary CT angiography (plaque volume divided by coronary artery length) for total and noncalcified plaque was highly reproducible between observers. Total and noncalcified plaque indexes were associated with Framingham risk score and AHA 2013 risk score in asymptomatic individuals. Key differences were found between CAC score and the plaque indexes. In adjusted models, noncalcified plaque was associated with LDL cholesterol level, diabetes, and systolic blood pressure; these variables were not associated with CAC score, as may have otherwise been expected. Age was a strong predictor of CAC score but not of noncalcified plaque burden. These results suggest that coronary CT angiography evaluation of coronary plaque burden may provide unique information from the CAC score.
A retrospective study of asymptomatic self-referred subjects undergoing coronary CT angiography in South Korea (20) used visual scoring of plaque as calcified, noncalcified, or mixed. Plaque was present in 43% of subjects; noncalcified plaque was present in 7.8% of plaques. C-reactive protein was associated with noncalcified plaque (odds ratio, 1.7). In the same cohort, a relationship between hypertension grade and greater likelihood of obstructive CAD was described (21). To our knowledge, clinical correlates of coronary CT angiography–defined atheroma in an asymptomatic U.S. cohort have not been previously described.
In the current study, both LDL cholesterol and total cholesterol–to–HDL cholesterol ratio were associated with noncalcified plaque index. LDL cholesterol level has long been identified as a key risk factor for coronary heart disease. The ASTEROID trial (22) showed the ability of intensive statin therapy to reduce intravascular US–quantified atheroma burden associated with reduction of LDL cholesterol. More recently, it has been shown that total cholesterol–to–HDL cholesterol ratio and LDL/HDL cholesterol ratio better predict cardiovascular outcomes than LDL cholesterol level alone (23). Other studies have also found the total cholesterol–to–HDL cholesterol ratio to be associated with carotid intima-media thickness (24).
The importance of the LDL cholesterol level for noncalcified plaque burden was further highlighted in the current study in relationship to the CAC score. Even when Agatston CAC score was forced into the prediction model for noncalcified plaque, LDL cholesterol level remained predictive of the noncalcified plaque burden. Interestingly, in our subjects with low-to-moderate Framingham risk, LDL cholesterol level was not associated with CAC score. These results are consistent with current concepts regarding high-intensity statin therapy leading to improved cardiovascular outcome by potentially modifying plaque burden. Further longitudinal studies will be needed to determine if indeed lower serum cholesterol levels are associated with reduced noncalcified plaque burden at coronary CT angiography.
Recent AHA guidelines emphasize the importance of lipid-lowering therapy with statins. With the new guidelines, it is estimated that the number of adults who warrant either consideration or recommendation for statin therapy will increase by 12.8 million (4,25). Although results of some studies (26) have shown that the CAC score does not change or may even increase during statin therapy, the effect of statin therapy on noncalcified plaque is still being investigated. Results of several early studies have indicated that coronary CT angiography may be useful for following changes in plaque. In a retrospective study, Zeb et al (27) evaluated 60 patients who were treated with statins. The noncalcified plaque volume was reduced after about 1 year, while calcified plaque volume was unchanged. Lehman et al (28) followed plaque with coronary CT angiography in 69 patients with acute coronary syndrome. That study showed an increase in plaque burden of 13%, driven by an increase in noncalcified plaque with no significant increase in calcified plaque. Papadopoulou and colleagues (29) prospectively recruited patients with acute coronary syndrome in the PROSPECT trial to undergo a second CT examination after 3 years; plaque volume increased by an average of 5.8%.
The current study highlights the use and potential of quantifying plaque burden to quantify progression or regression of coronary disease. Our study participants were aged 55 years and older without clinical indication for a clinical coronary CT angiography examination. The median CAC score was 73, and this corresponded to a total plaque index of 39 mm2 in a low-to-intermediate risk group. Ongoing longitudinal follow-up of subjects in this study will allow us to determine the effect of high-intensity statins on total plaque burden.
There were several limitations to this study. Intravascular US was not performed because study subjects had no clinical indication for invasive angiography. Although our results were highly reproducible, the results were obtained by using a specific software analysis package that has been validated and optimized in comparison with intravascular US (13,14). The relationship to other software packages is unknown. Our results regarding cross-sectional associations may not hold true in longitudinal data. Owing to the single-center recruitment, we cannot exclude a bias in subject selection. Other important variables, such as socioeconomic status, were not collected and therefore cannot be ruled out as possible confounders.
In summary, coronary CT angiography shows promise as a tool for quantifying total and noncalcified coronary artery plaque. Our results involving noninvasive intravascular US–like analysis of coronary plaque point to the importance of LDL cholesterol level as a significant biologic predictor of noncalcified plaque.
Advances in Knowledge
■ In asymptomatic individuals, noncalcified plaque index was positively correlated with systolic blood pressure (β = 0.80 mm2/10 mm Hg; P = .03), diabetes (β = 4.47 mm2; P = .03), and low-density lipoprotein cholesterol level (β = 0.04 mm2/mg/dL; P = .02).
■ Total and noncalcified plaque indexes, respectively, were positively correlated with Framingham risk score (β = 0.70, P < .001 and β = 0.51, P < .001) and 2013 American Heart Association risk score (β = 0.36, P < .001 and β = 0.20, P = .008) in asymptomatic individuals.
Implication for Patient Care
■ The results of this study support the use of coronary CT angiography to assess total and noncalcified plaque in individuals with elevated clinical risk markers, including elevated cholesterol levels, elevated blood pressure, and diabetes.
SUPPLEMENTAL TABLES
Received November 3, 2014; revision requested December 16; revision received February 14, 2015; accepted February 22; final version accepted February 27.
Current address: Knight Cardiovascular Institute, Oregon Health and Science University, Portland, Ore.
Funding: This research was supported by the National Institutes of Health (grants EB000072 and CL090019).
Disclosures of Conflicts of Interest: K.R. disclosed no relevant relationships. A.C.K. disclosed no relevant relationships. S.L. disclosed no relevant relationships. J.A.C.L. disclosed no relevant relationships. D.V. disclosed no relevant relationships. V.S. disclosed no relevant relationships. P.P. disclosed no relevant relationships. M.A.A. disclosed no relevant relationships. M.M. disclosed no relevant relationships. C.T.S. disclosed no relevant relationships. D.A.B. disclosed no relevant relationships.
Abbreviations:
- AHA
- American Heart Association
- CAC
- coronary artery calcium
- CAD
- coronary artery disease
- HDL
- high-density lipoprotein
- LDL
- low-density lipoprotein
References
- 1.Go AS, Mozaffarian D, Roger VL, et al. Executive summary: heart disease and stroke statistics—2013 update: a report from the American Heart Association. Circulation 2013;127(1):143–152. [DOI] [PubMed] [Google Scholar]
- 2.Kwan AC, Cater G, Vargas J, Bluemke DA. Beyond coronary stenosis: coronary computed tomographic angiography for the assessment of atherosclerotic plaque burden. Curr Cardiovasc Imaging Rep 2013;6(2):89–101. [DOI] [PMC free article] [PubMed] [Google Scholar]
- 3.Leipsic J, Taylor CM, Grunau G, et al. Cardiovascular risk among stable individuals suspected of having coronary artery disease with no modifiable risk factors: results from an international multicenter study of 5262 patients. Radiology 2013;267(3):718–726. [DOI] [PubMed] [Google Scholar]
- 4.Stone NJ, Robinson JG, Lichtenstein AH, et al. 2013 ACC/AHA guideline on the treatment of blood cholesterol to reduce atherosclerotic cardiovascular risk in adults: a report of the American College of Cardiology/American Heart Association Task Force on Practice Guidelines. Circulation 2014;129(25 Suppl 2):S1–S45. [DOI] [PubMed] [Google Scholar]
- 5.Criqui MH, Denenberg JO, Ix JH, et al. Calcium density of coronary artery plaque and risk of incident cardiovascular events. JAMA 2014;311(3):271–278. [DOI] [PMC free article] [PubMed] [Google Scholar]
- 6.McEvoy JW, Blaha MJ, Defilippis AP, et al. Coronary artery calcium progression: an important clinical measurement? a review of published reports. J Am Coll Cardiol 2010;56(20):1613–1622. [DOI] [PubMed] [Google Scholar]
- 7.Schlett CL, Ferencik M, Celeng C, et al. How to assess non-calcified plaque in CT angiography: delineation methods affect diagnostic accuracy of low-attenuation plaque by CT for lipid-core plaque in histology. Eur Heart J Cardiovasc Imaging 2013;14(11):1099–1105. [DOI] [PubMed] [Google Scholar]
- 8.Papadopoulou SL, Garcia-Garcia HM, Rossi A, et al. Reproducibility of computed tomography angiography data analysis using semiautomated plaque quantification software: implications for the design of longitudinal studies. Int J Cardiovasc Imaging 2013;29(5):1095–1104. [DOI] [PubMed] [Google Scholar]
- 9.Farzaneh-Far A, Steigner M, Kwong RY. Applications and limitations of cardiac computed tomography in the evaluation of coronary artery disease. Coron Artery Dis 2013;24(7):606–612. [DOI] [PubMed] [Google Scholar]
- 10.Knollmann F, Ducke F, Krist L, et al. Quantification of atherosclerotic coronary plaque components by submillimeter computed tomography. Int J Cardiovasc Imaging 2008;24(3):301–310. [DOI] [PubMed] [Google Scholar]
- 11.Hadamitzky M, Täubert S, Deseive S, et al. Prognostic value of coronary computed tomography angiography during 5 years of follow-up in patients with suspected coronary artery disease. Eur Heart J 2013;34(42):3277–3285. [DOI] [PubMed] [Google Scholar]
- 12.Nakazato R, Shalev A, Doh JH, et al. Aggregate plaque volume by coronary computed tomography angiography is superior and incremental to luminal narrowing for diagnosis of ischemic lesions of intermediate stenosis severity. J Am Coll Cardiol 2013;62(5):460–467. [DOI] [PubMed] [Google Scholar]
- 13.Boogers MJ, Broersen A, van Velzen JE, et al. Automated quantification of coronary plaque with computed tomography: comparison with intravascular ultrasound using a dedicated registration algorithm for fusion-based quantification. Eur Heart J 2012;33(8):1007–1016. [DOI] [PubMed] [Google Scholar]
- 14.de Graaf MA, Broersen A, Kitslaar PH, et al. Automatic quantification and characterization of coronary atherosclerosis with computed tomography coronary angiography: cross-correlation with intravascular ultrasound virtual histology. Int J Cardiovasc Imaging 2013;29(5):1177–1190. [DOI] [PubMed] [Google Scholar]
- 15.Relative LDL-lowering efficacy of statin and statin-based therapies . U.S. Food and Drug Administration. http://www.fda.gov/Drugs/DrugSafety/ucm256581.htm. Accessed December 20, 2014.
- 16.Agatston AS, Janowitz WR, Hildner FJ, Zusmer NR, Viamonte M, Jr, Detrano R. Quantification of coronary artery calcium using ultrafast computed tomography. J Am Coll Cardiol 1990;15(4):827–832. [DOI] [PubMed] [Google Scholar]
- 17.Yang G, Broersen A, Petr R, et al. Automatic coronary artery tree labeling in coronary computed tomographic angiography datasets. Comput Cardiol 2011;38:109–112. [Google Scholar]
- 18.Miller JM, Dewey M, Vavere AL, et al. Coronary CT angiography using 64 detector rows: methods and design of the multi-centre trial CORE-64. Eur Radiol 2009;19(4):816–828. [DOI] [PMC free article] [PubMed] [Google Scholar]
- 19.Kwan AC, May HT, Cater G, et al. Coronary artery plaque volume and obesity in patients with diabetes: the factor-64 study. Radiology 2014;272(3):690–699. [DOI] [PMC free article] [PubMed] [Google Scholar]
- 20.Yang DH, Kang JW, Kim HK, et al. Association between C-reactive protein and type of coronary arterial plaque in asymptomatic patients: assessment with coronary CT angiography. Radiology 2014;272(3):665–673. [DOI] [PubMed] [Google Scholar]
- 21.Im TS, Chun EJ, Lee MS, Adla T, Kim JA, Choi SI. Grade-response relationship between blood pressure and severity of coronary atherosclerosis in asymptomatic adults: assessment with coronary CT angiography. Int J Cardiovasc Imaging 2014;30(Suppl 2):105–112. [DOI] [PubMed] [Google Scholar]
- 22.Nissen SE, Nicholls SJ, Sipahi I, et al. Effect of very high-intensity statin therapy on regression of coronary atherosclerosis: the ASTEROID trial. JAMA 2006;295(13):1556–1565. [DOI] [PubMed] [Google Scholar]
- 23.Arsenault BJ, Rana JS, Stroes ES, et al. Beyond low-density lipoprotein cholesterol: respective contributions of non-high-density lipoprotein cholesterol levels, triglycerides, and the total cholesterol/high-density lipoprotein cholesterol ratio to coronary heart disease risk in apparently healthy men and women. J Am Coll Cardiol 2009;55(1):35–41. [DOI] [PubMed] [Google Scholar]
- 24.Yokoi H, Nohara R, Daida H, et al. Change in carotid intima-media thickness in a high-risk group of patients by intensive lipid-lowering therapy with rosuvastatin: subanalysis of the JART study. Int Heart J 2014;55(2):146–152. [DOI] [PubMed] [Google Scholar]
- 25.Pencina MJ, Navar-Boggan AM, Sr D’Agostino RB, et al. Application of new cholesterol guidelines to a population-based sample. N Engl J Med 2014;370(15):1422–1431. [DOI] [PubMed] [Google Scholar]
- 26.Houslay ES, Cowell SJ, Prescott RJ, et al. Progressive coronary calcification despite intensive lipid-lowering treatment: a randomised controlled trial. Heart 2006;92(9):1207–1212. [DOI] [PMC free article] [PubMed] [Google Scholar]
- 27.Zeb I, Li D, Nasir K, et al. Effect of statin treatment on coronary plaque progression: a serial coronary CT angiography study. Atherosclerosis 2013;231(2):198–204. [DOI] [PubMed] [Google Scholar]
- 28.Lehman SJ, Schlett CL, Bamberg F, et al. Assessment of coronary plaque progression in coronary computed tomography angiography using a semiquantitative score. JACC Cardiovasc Imaging 2009;2(11):1262–1270. [DOI] [PMC free article] [PubMed] [Google Scholar]
- 29.Papadopoulou SL, Neefjes LA, Garcia-Garcia HM, et al. Natural history of coronary atherosclerosis by multislice computed tomography. JACC Cardiovasc Imaging 2012;5(3 Suppl):S28–S37. [DOI] [PubMed] [Google Scholar]
Associated Data
This section collects any data citations, data availability statements, or supplementary materials included in this article.