Integration of visual characterization of emphysema and airway abnormalities with physiologic and quantitative CT assessment permits categorization of chronic obstructive pulmonary disease into distinct structurally and functionally defined subtypes.
Abstract
The purpose of this statement is to describe and define the phenotypic abnormalities that can be identified on visual and quantitative evaluation of computed tomographic (CT) images in subjects with chronic obstructive pulmonary disease (COPD), with the goal of contributing to a personalized approach to the treatment of patients with COPD. Quantitative CT is useful for identifying and sequentially evaluating the extent of emphysematous lung destruction, changes in airway walls, and expiratory air trapping. However, visual assessment of CT scans remains important to describe patterns of altered lung structure in COPD. The classification system proposed and illustrated in this article provides a structured approach to visual and quantitative assessment of COPD. Emphysema is classified as centrilobular (subclassified as trace, mild, moderate, confluent, and advanced destructive emphysema), panlobular, and paraseptal (subclassified as mild or substantial). Additional important visual features include airway wall thickening, inflammatory small airways disease, tracheal abnormalities, interstitial lung abnormalities, pulmonary arterial enlargement, and bronchiectasis.
© RSNA, 2015
Introduction
The term chronic obstructive pulmonary disease (COPD), currently defined on the basis of spirometric evidence of airway obstruction, encompasses several distinct but overlapping obstructive syndromes, including emphysema, chronic bronchitis, and reversible or irreversible small airways obstruction (1). The Global Obstructive Lung Disease (GOLD) system has been widely used to identify and classify the severity of postbronchodilator airflow limitation in COPD, with GOLD stage I referring to subjects with a ratio of forced expiratory volume in 1 second (FEV1) to forced vital capacity (FVC) of less than 0.7 but with preserved FEV1, and GOLD stages II, III, and IV when the FEV1/FVC ratio is less than 0.7 and FEV1 is less than 80%, 50%, and 30% of predicted, respectively (2). Individuals with identical GOLD stages may have different morphologic appearances at computed tomography (CT) (3). Some have extensive emphysema, whereas others with equal functional impairment have an airway-dominant phenotype with little or no emphysema. These morphologic differences may reflect important differences in the underlying pathophysiology and genomic profile of COPD. Furthermore, individual subtypes of emphysema may have different pathophysiologic importance. For example, Smith et al (4) showed that smokers with predominantly centrilobular emphysema (CLE) had a higher level of cigarette exposure, higher lung volumes, and lower lung diffusing capacity than those without emphysema. Conversely, smokers with a predominantly “panlobular” pattern of emphysema had a relatively lower body mass index than smokers without emphysema.
In addition, morphologic changes of emphysema and airways disease are found in a substantial proportion of subjects who do not meet the spirometric criteria for COPD (5). Standardized characterization of COPD and other smoking-related lung changes at CT is particularly important given the emerging role of reduced-dose CT in screening for lung cancer in cigarette smokers (6).
COPD is associated with irreversible structural pulmonary changes, including parenchymal destruction (emphysema), large airway remodeling, and reduction in the caliber and number of small airways in the lung (7). CT is a well-validated technique to visually and quantitatively assess the in vivo presence, pattern, and extent of emphysema (8–11). Bronchial wall thickness and the extent of emphysema at quantitative CT in patients with COPD are independent determinants of the degree of airflow obstruction at pulmonary function testing (12) and the risk of COPD exacerbations (13). Emphysema assessed quantitatively is also associated with increased all-cause mortality in patients with COPD (14). Quantitative CT assessment of expiratory gas trapping is emerging as a powerful predictor of the severity of airway obstruction in COPD (12,15,16). Furthermore, the observation that expiratory gas trapping correlates only weakly with histologic severity of emphysema strongly suggests that it is caused by obstruction in the smaller airways rather than emphysema (17). Quantification of low-attenuation areas, expiratory gas trapping, and airway wall thickness can help define specific COPD phenotypes with differing clinical and physiologic features (18).
The purpose of this statement is to define the phenotypic abnormalities recognizable at visual and quantitative evaluation of CT images in subjects with COPD. Although these abnormalities often overlap, we believe that identification and quantification of the predominant morphologic findings and their grouping into defined subtypes of COPD will improve diagnostic accuracy, help optimize treatment, facilitate genetic analysis, and provide a framework for data comparison in clinical trials. Given the focus on COPD and related phenotypes, discussion of other smoking-related lung conditions such as pulmonary Langerhans cell histiocytosis, lung cancer, and usual interstitial pneumonia is beyond the scope of this article. Although COPD unrelated to smoking (eg, COPD related to biomass fuel exposure) is not discussed herein, the same concepts likely apply to these conditions.
Technical Approach
CT Image Acquisition and Evaluation
CT is currently the most widely available and precise imaging method for the characterization of COPD. Chest radiography does not allow accurate morphologic assessment of COPD owing to limited resolution and superimposition of overlapping structures. Although magnetic resonance (MR) imaging, particularly with use of hyperpolarized gases, offers exciting possibilities for measuring alveolar dimensions (19–23), technical issues currently limit wide acceptance. With advances in fluorine MR imaging, some of these limitations may be eliminated (24). Other potentially promising MR imaging techniques, such as ultrashort echo time pulse sequences, oxygen-enhanced MR imaging, or the use of fluorinated gases, require validation in multicenter studies.
The appropriate CT technique for the evaluation of COPD should optimize visual assessment of the lung structure for emphysema and airways disease and help identify other complications of cigarette smoking, such as lung cancer, lung fibrosis, and Langerhans cell histiocytosis. Moreover, CT should facilitate quantitative evaluation of emphysema and airway wall thickening while using the minimum possible radiation dose. CT images should be viewed at window level settings suitable for lung evaluation (typically a window level of −700 HU and window width of 1500 HU). A narrower window width (750–1000 HU) may be useful for detecting or excluding early emphysema (25). Minimum intensity projections may help show the presence and extent of emphysema (26). Standard images from subjects with normal and abnormal findings may improve observer agreement in the visual characterization of CT changes (27).
Unenhanced volumetric thin-section CT is generally recommended for COPD characterization (28). Precise scanner calibration, ideally with a standardized CT phantom (29), is important for ensuring the accuracy of CT numbers (30,31). Scanner-specific protocols have been designed to compare quantitative CT indexes of parenchymal and airway status (32). A high-spatial-resolution reconstruction algorithm is better for visual assessment of the lungs (28), whereas a smoother reconstruction algorithm facilitates computerized analysis by reducing image noise (33,34). Submillimeter z-axis resolution, with overlapping section reconstructions, is recommended for optimal airway analysis (35,36). Expiratory CT, performed at functional residual capacity or at residual volume, is a powerful tool for determining the severity of airway obstruction in cigarette smokers (12,16,37,38) and can suggest tracheobronchomalacia, although this condition is better shown with dynamic expiratory imaging (39). In the absence of lung volume control with a pneumotachometer (40,41), it is critically important for the CT technologist to rehearse breathing instructions with the patient, encouraging a full deep inspiration to total lung capacity for the inspiratory acquisition and expiration to functional residual capacity or residual volume for the expiratory acquisition (42).
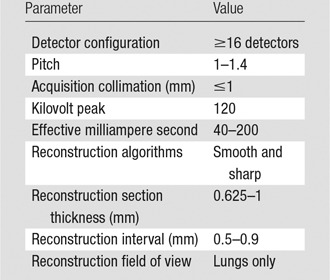
The CT radiation dose level used for the evaluation of COPD is driven by the balance between radiation dose and image quality. Adequate visual characterization can be achieved with reduced-dose CT acquisition techniques, as used for lung cancer screening (43,44). Excessive image noise with a reduced CT dose can simulate emphysema, particularly at quantitative CT (45,46), and may impair segmentation of the airways and quantitative evaluation of airway wall thickness. Given the older age profile of subjects with COPD and the importance of acquiring precise quantitative information, moderate radiation doses (<10 mSv) are probably acceptable. However, as CT detector technology and image reconstruction methods evolve, in combination with improvements in quantitative CT, it is likely that the required CT dose will further decrease. Several large multicenter studies (4,47–50) have used a range of settings for key scan acquisition parameters, and these are summarized in the Table. Expiratory CT may be performed with lower radiation exposure (tube current ≤50 mAs) because it is primarily used to quantify air trapping (51). Iterative reconstruction techniques are not currently recommended because the effects on quantitative and visual evaluation are uncertain at the time of writing (37,52).
CT Techniques Used for Visual and Quantitative Evaluation of COPD
Quantitative CT Image Analysis
The goals of quantitative CT in COPD are to quantify the presence and percentage of emphysema-like lung (low-attenuation areas), the lobar and zonal distribution of the low-attenuation regions, changes in airway walls and luminal caliber, and the severity of gas trapping at expiratory CT. A number of analysis platforms are available as commercial software and in academic institutions (36,53–55). A detailed discussion of quantitative CT methodology is beyond the scope of this article, but further details are available in recent review articles (54,56–58). Although quantitative CT provides useful information regarding emphysema, airways, and air trapping and provides a means of objectively characterizing and following these pathologic processes, visual assessment of CT scans remains important to describe patterns of altered lung structure in COPD and provides distinct phenotypes not currently identified with quantitative CT.
Visually Defined Subtypes of COPD
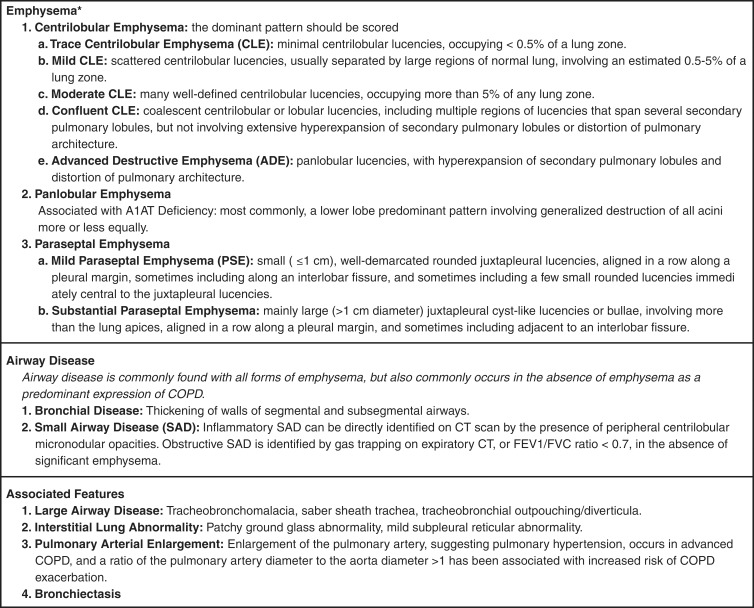
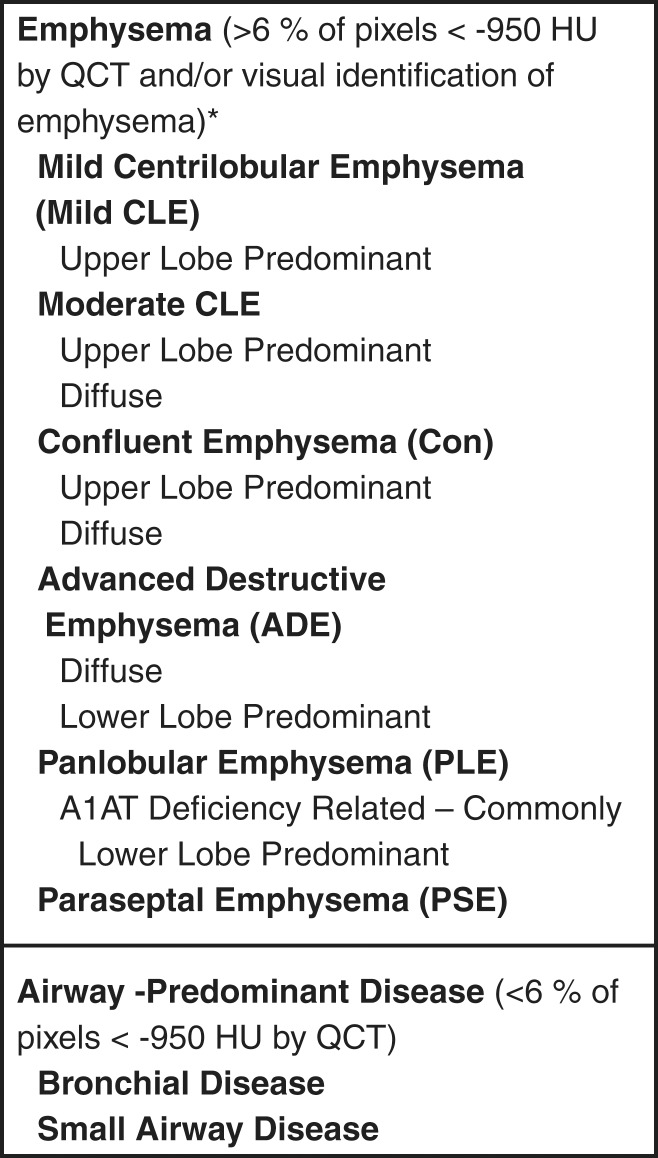
Figure 1 lists the visually defined phenotypes of emphysematous destruction as well as the airway changes seen in COPD. Figure 2 illustrates the gross abnormality and micro-CT features of the primary lesions of each of the major emphysematous phenotypes of COPD.
Figure 1:
Visually defined patterns of COPD at CT. * = If there are fewer than four to five small (≤1 cm) juxtapleural circumscribed areas of lucency in the apex of a lung, ignore. A1AT = α1-antitrypsin.
Figure 2:
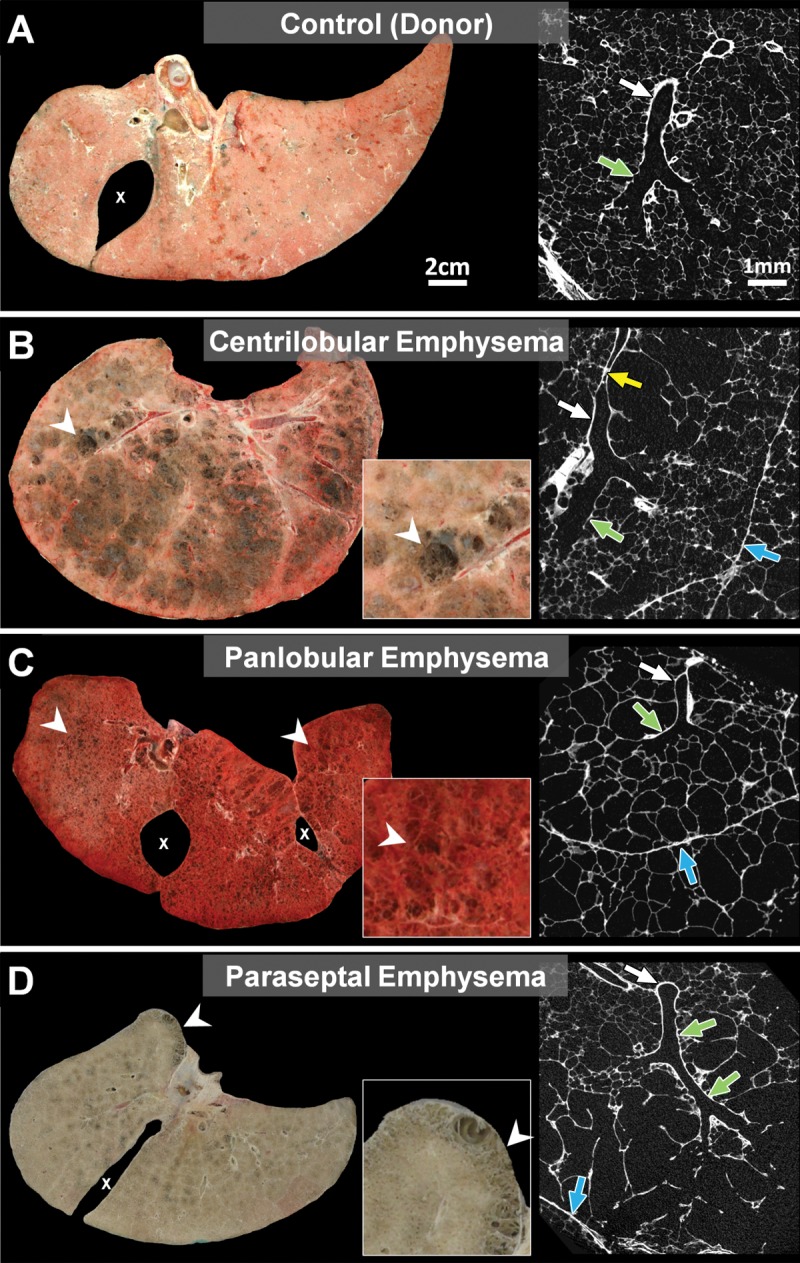
Comparison of frozen lung slices and micro-CT images from, A, donor (control) lung to lungs affected by, B, centrilobular, C, panlobular, or, D, paraseptal phenotypes of emphysematous destruction. A, Micro-CT image of control lung shows a terminal bronchiole (white arrow) connecting to respiratory bronchiole (green arrow) supplying alveoli of normal size. B, Extensive centrilobular destruction (arrowheads) is seen in lung slice, and micro-CT scan of primary lesion shows dilatation and destruction of proximal respiratory bronchioles (green arrow), with sparing of alveoli near lobular septa (blue arrow). Moreover, terminal bronchiole leading into centrilobular lesion is narrowed (yellow arrow) and then opens up again (white arrow), a feature that can be better appreciated in video associated with the article by McDonough et al (7). C, In contrast, the panlobular phenotype of emphysema in this case of α1-antitrypsin deficiency shows relatively mild destruction of gross specimen (arrowheads), and micro-CT scan shows uniform destruction of alveoli extending right up to lobular septa (blue arrow). Terminal bronchiole (white arrow) and respiratory bronchiole (green arrow) are normal. D, Paraseptal phenotype of emphysema shows typical lesions (arrowheads) beneath pleural surface on gross specimen, and micro-CT scan shows that alveoli adjacent to lobular septa are dilated and destroyed, with sparing of center of lobule. Terminal bronchiole (white arrow) and respiratory bronchiole (green arrow) are normal. Images from control lung and lung affected by PSE came from organ donors and were released for research when judged to be unsuitable for transplantation, whereas lungs affected by CLE and panacinar emphysema were donated by patients treated by means of lung transplantation. The protocol for the preparation of the specimens is fully described in reference 7. x on A, C, and D indicates interlobar fissure(s).
CLE
McLean in Australia (59–62) and Leopold and Gough in the United Kingdom (63) provided the first pathologic descriptions of CLE and showed that the primary lesion is produced by dilation and destruction of respiratory bronchioles within a single acinus. Furthermore, they both demonstrated that the centrilobular lesions are formed by coalescence of several primary lesions. Subsequently, the destruction spreads to the entire lung lobule and fuses many destroyed lobules together to produce a pattern of coalescent destruction that sometimes disintegrates to form large bullous lesions. By performing three-dimensional reconstructions of serial histologic sections of 90 individual centrilobular spaces, Leopold and Gough (63) showed that all CLE lesions had a supplying bronchiole lined with abnormal epithelium that was associated with varying degrees of airway wall thickening and lumen narrowing. In addition, they also described widespread evidence of bronchiolitis ranging from active cellular infiltration to fibrosis. In a subsequent study, they used fine particulate lead dust bronchograms to confirm that some centrilobular spaces filled easily from the conducting airways and suggested that the pathways between the mainstem bronchus and the centrilobular spaces were shorter in those with emphysema than in normal airways (64). Others used this same technique to visualize CLE, showing that the areas of CLE are hypercompliant and reach their maximum volume at very low transpulmonary pressures and that the resistance to collateral ventilation falls to very low levels in regions of emphysematous destruction (65). More recent studies based on micro-CT confirmed earlier observations that the supplying bronchioles often follow a tortuous pathway to reach the centrilobular space (7) (see video in article by McDonough et al [7]). More importantly, they also showed a remarkable reduction in the total number of terminal bronchioles per lung, from 22 300 ± 3900 per adult human lung in control subjects to 2400 ± 600 per lung when CLE was present. This study provided histologic evidence that it was surviving airways with thickened walls (see figure 4 in the article by Klein et al [5]) that supplied the terminal bronchioles. Most importantly, micro-CT measurements showed that the reduction in terminal bronchioles occurred before the onset of emphysematous destruction. Collectively, these data support the hypothesis that bronchiolitis is the earliest lesion in COPD and suggest that CLE is formed distal to surviving bronchioles, supported by collateral ventilation of acini within the same lobule that lost terminal bronchioles (7).
At CT, CLE is characterized by small well-defined or poorly defined areas of low attenuation surrounded by normal lung. Centrilobular pulmonary arteries or arterioles, which are often seen traversing the hypoattenuated areas, mark the center of each lobule (9). This pattern of emphysema correlates well with pathologically demonstrated CLE (59,66–68) and with micro-CT measurements of the primary lesions (Fig 2, B). This is the most common type of smoking-related emphysema and is usually upper lung predominant (Figs 3, 4). The low-attenuation areas may range from less than 1 mm to more than 3 cm in diameter.
Figure 3:
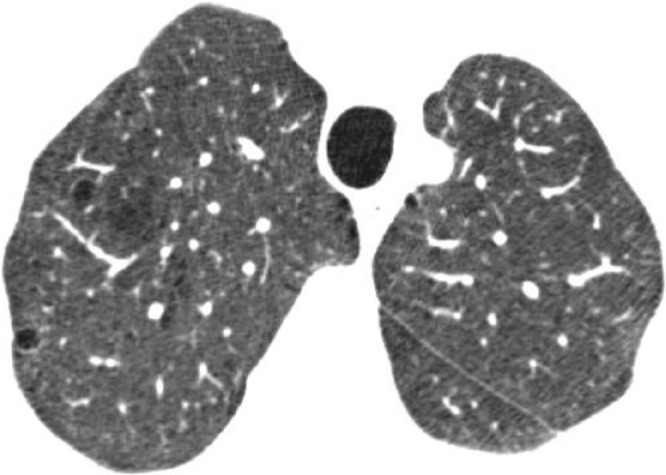
Mild CLE. CT scan in patient with GOLD stage I COPD shows scattered centrilobular lucencies, separated by large regions of normal lung, involving an estimated 0.5% of upper lung zone.
Figure 4:
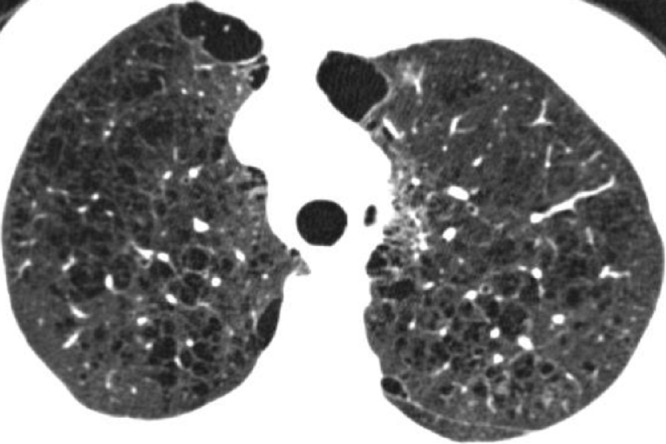
Moderate CLE. CT scan in patient with GOLD stage I COPD shows many well-defined centrilobular lucencies that occupy more than 5% of upper lung zone. PSE is seen in anteromedial right and left lungs.
Severe Emphysema
Confluent emphysema.—As CLE becomes more severe, the areas of low attenuation become confluent (Fig 5) and the centrilobular distribution becomes less apparent. In most cases, the areas of low attenuation have no visible walls; however, very thin walls may be seen—particularly when the areas of emphysema are extensive. The apparent walls in such cases probably represent atelectasis or interlobular septa adjacent to the emphysematous spaces. Confluent emphysema may be differentiated from advanced destructive emphysema by the presence of a preserved rim of normal lung attenuation intervening between areas of lung destruction, and by the absence of lobular hyperexpansion, architectural distortion, or splaying or decreased caliber of vessels.
Figure 5:
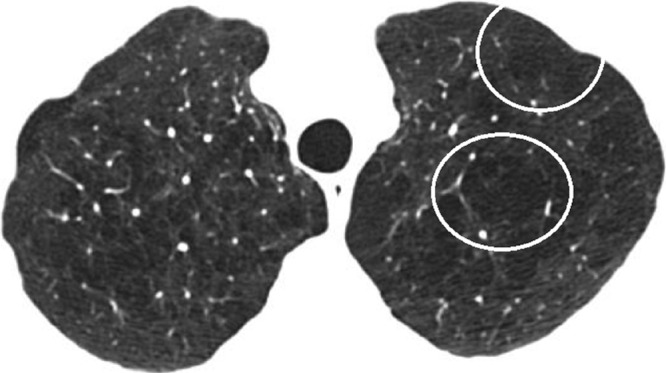
Confluent CLE. CT scan in patient with GOLD stage I COPD shows multiple lucencies that span several secondary pulmonary lobules (circled in left lung) but are not associated with extensive hyperexpansion of secondary pulmonary lobules or distortion of pulmonary architecture.
Advanced destructive emphysema.—Advanced destructive emphysema is manifested as a generalized decrease of attenuation of the lung without focal hypoattenuation (Fig 6) and represents an advanced stage of CLE. Interlobular septa are often preserved and splayed, facilitating the identification of pulmonary lobular hyperexpansion. In addition, the more central pulmonary vessels are often distorted, splayed, and narrowed with decreased branching (architectural distortion). Although this pattern may be indistinguishable at CT from the panlobular pattern described below, and the term panlobular has been previously used to describe this entity (4,69), we prefer to use the term advanced destructive emphysema because it may not represent histologic panlobular emphysema (PLE).
Figure 6:
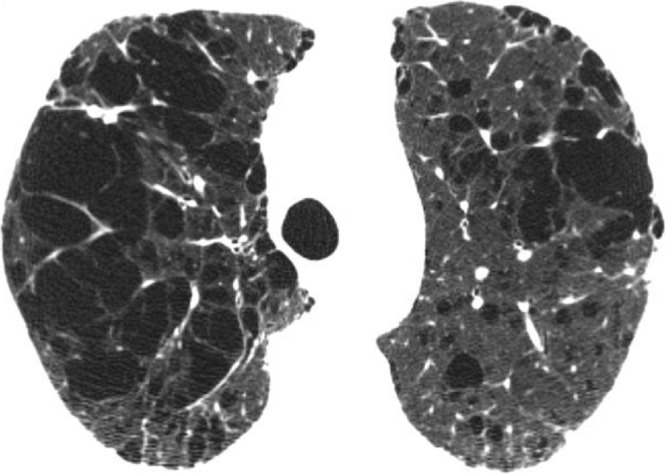
Advanced destructive emphysema. CT scan in patient with GOLD stage I COPD shows hyperexpansion of secondary pulmonary lobules with distortion of pulmonary architecture.
PLE
PLE specifically refers to diffuse emphysematous destruction across the lobule (Fig 2, C). Wyatt et al (70) first described this pattern, which was subsequently linked to low circulating levels of α1-antitrypsin (71). It is now known that low levels of α1-antitrypsin are produced by a genetic defect in the α1-antitrypsin gene that causes the protein to misfold after it is produced, causing it to accumulate in liver cells, where it stimulates inflammation and subsequent cirrhosis without being secreted into the circulating blood (72). In general, the extent and severity of alveolar destruction in PLE is milder than that in CLE, but it affects all of the acini within a lung lobule more or less equally (see the gross pathology and micro-CT images of the primary lesion in Fig 2, C).
PLE has also been reported in the absence of α1-antitrypsin deficiency (73), including in intravenous drug abuse (74). In cigarette smokers, mixtures of PLE and CLE can be found within the same lungs (69). Under these conditions, Kim et al (69) have suggested that PLE is less likely to be associated with small airway obstruction than CLE. However, micro-CT studies of α1-antitrypsin deficiency indicate that both CLE and PLE are associated with narrowing and destruction of the terminal bronchioles in end-stage COPD (7).
At CT, advanced PLE in association with α1-antitrypsin deficiency often occurs in a lower lobe–predominant distribution (Fig 7) (75,76). (CLE may also be found in cigarette smokers with α1-antitrypsin deficiency.) Earlier stages of PLE are quite difficult to identify at CT, and quantitative CT may be preferred.
Figure 7:
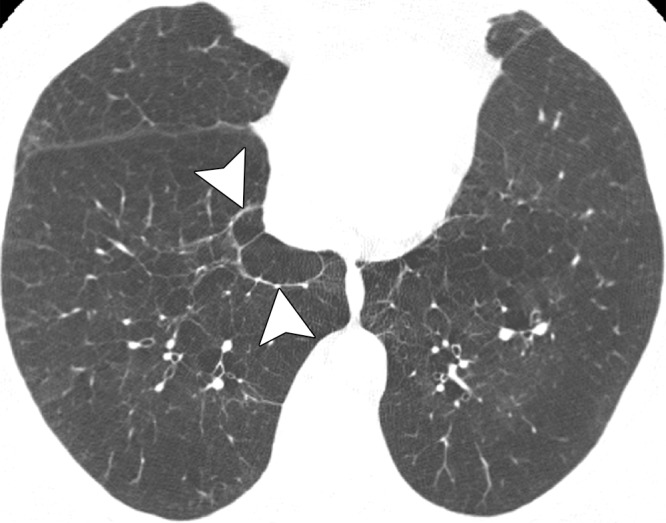
PLE related to α1-antitrypsin deficiency. CT scan through lower lungs shows widespread confluent areas of hyperlucency spanning one or several lobules. Some lobules, outlined by intact interlobular septa, appear hyperexpanded (arrowheads).
Paraseptal Emphysema
Heard (77) used the term paraseptal emphysema (PSE) to describe emphysematous lesions caused by selective destruction of the distal acinus (Fig 2, D), and subsequent reports have used it to describe lesions located near the pleural surface close to the chest wall and in the interlobar fissures. In some cases, multiple destroyed acini coalesce to form striking lesions just under the pleural surface on CT scans. Its relative frequency in radiology-based studies like COPDGene suggest that it has been underappreciated in studies of postmortem and surgically resected lungs, perhaps because these specimens are rarely properly inflated before being examined. However, PSE is often not associated with significant symptoms or physiologic impairment (4).
PSE is characterized at CT by subpleural and peribronchovascular foci of low attenuation separated by intact interlobular septa thickened by associated mild fibrosis (78) (Figs 8, 9). PSE has a special predilection for peripheral subpleural lobules along the mediastinal and peripheral pleura and fissures, usually most marked in the middle and upper lungs and along the mediastinum. CT shows subpleural areas of low attenuation with a well-defined wall. Rows of PSE may mimic honeycombing, but the size of the cysts is larger than that of honeycomb cysts and architectural distortion and other signs of fibrosis are not present. In our experience, PSE is commonly associated with marked thickening of the walls of proximal bronchi and bronchioles, suggesting a significant airway inflammatory component. PSE occurs across the entire spectrum of minimal involvement to severe parenchymal obstruction and can be progressive. Because minimal subpleural emphysematous abnormality is quite common even in nonsmokers (79,80), it is reasonable to ignore or discount the presence of up to four or five small cysts (≤1 cm) at the lung apices.
Figure 8:
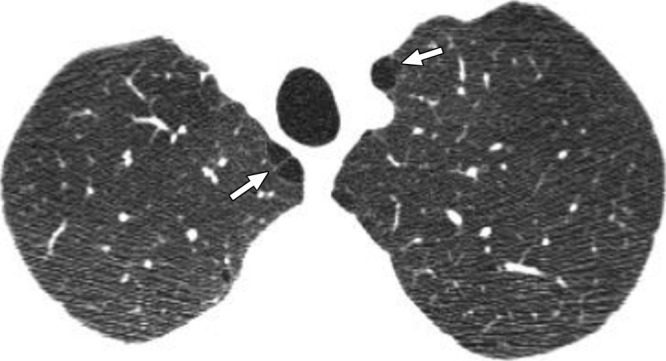
Mild PSE. CT scan in smoker without COPD shows subpleural foci of low attenuation separated by intact interlobular septa along the mediastinum (arrows), measuring less than 1 cm.
Figure 9:
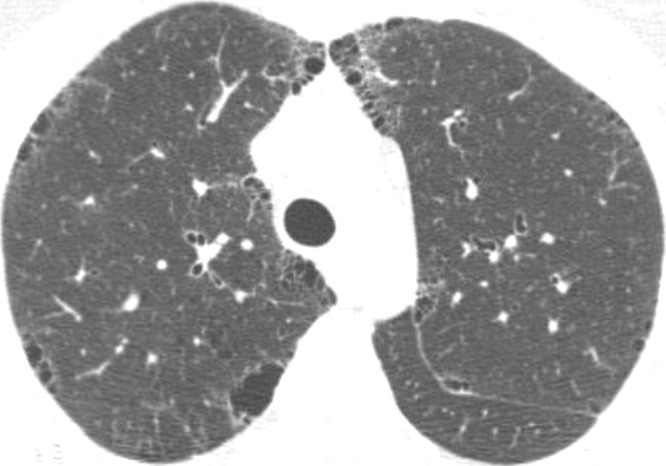
Substantial PSE. CT scan in patient with GOLD stage I COPD shows numerous well-demarcated areas of subpleural emphysema along chest wall and mediastinal pleural margins.
Bullae (avascular low-attenuation areas >1 cm in diameter, with a thin but perceptible wall) are found in all types of emphysema (81) but are most commonly associated with PSE. Bullae are often located in the upper lobes in both CLE and PSE but are more evenly distributed in the lungs of patients with advanced destructive emphysema (76). Bullae may be large enough to cause reduced expansion of the adjacent lung parenchyma, which may sometimes result in sufficient atelectasis to appear as a masslike opacity (82). The term giant bullous emphysema has been used to describe the presence of bullae occupying at least one-third of a hemithorax (83).
Bronchial Wall Thickening
Bronchial wall thickening is commonly observed in heavy cigarette smokers (84), particularly those with chronic bronchitis, presumably because of bronchial inflammation and remodeling. It may be visually identified at CT by a relative increase in bronchial wall thickness compared with the bronchial lumen and with the diameter of adjacent pulmonary arteries (85); however, this CT feature is subjective and associated with substantial interobserver variation (80,86). It is probably best assessed by comparison with visual standards obtained from subjects with normal (Fig 10) and abnormal (Fig 11) findings (27).
Figure 10:
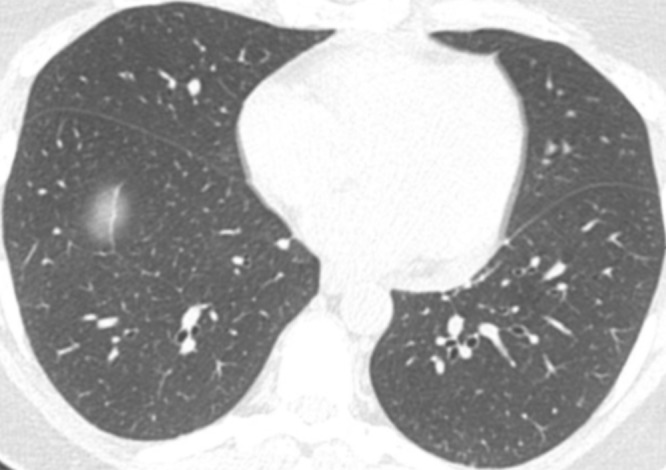
Normal bronchial walls. CT scan in asymptomatic nonsmoker with normal spirometric findings demonstrates normal airways.
Figure 11:
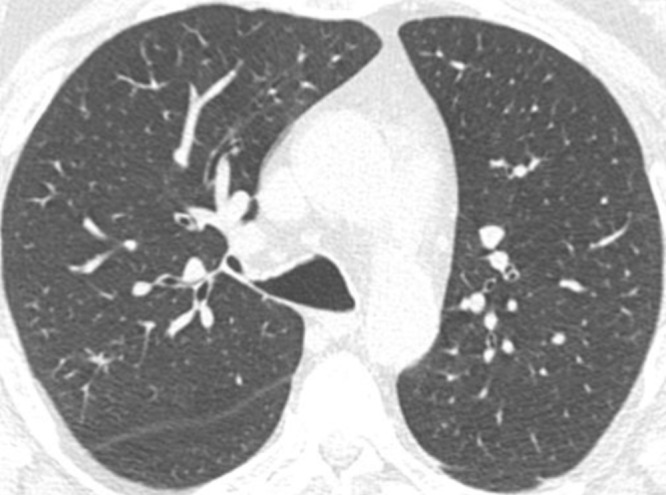
Bronchial wall thickening. CT scan in cigarette smoker demonstrates marked thickening of segmental and subsegmental airways but no emphysema.
Quantitative CT of airway dimensions is less subjective than visual evaluation. Quantitative CT of subsegmental airway dimensions can provide an estimate of small airway remodeling (87), probably because the same pathophysiologic process that causes small airway obstruction also takes place in large airways.
Increased thickness of airway walls is associated with the presence of COPD (88), with reversibility of airway obstruction (89), and with symptoms of chronic bronchitis (90). In patients with COPD, bronchial wall thickening is an important independent predictor of FEV1 (91,92) and of the risk of acute exacerbation (13).
Small Airways Disease
Cigarette smoking has distinct effects on the small airways that may be visible both pathologically and at CT. Niewoehner et al (93) showed that a characteristic form of respiratory bronchiolitis was present in the lungs of young persons who died suddenly outside the hospital. Although most of these lesions were observed in smokers, they were also found in nonsmokers. The authors postulated that this form of bronchiolitis was a precursor to CLE. Myers et al (94) reported a similar but more severe form of respiratory bronchiolitis as the only finding at lung biopsies performed in six patients with clinical and radiologic evidence of interstitial lung disease. That was confirmed by other authors (95). Respiratory bronchiolitis is dominated by infiltrating mononuclear cells containing large numbers of macrophages with brown to black “smokers” inclusion bodies that stain positively with periodic acid Schiff and iron stains. These inclusions are thought to be based on abnormal lysosomal function of macrophages in smokers (96). Respiratory bronchiolitis is also commonly found in lung specimens removed as a treatment for lung cancer (97). The decrease in FEV1 in COPD has also been related to a persistent infiltration of inflammatory immune cells into the walls of purely conducting airways, with a tendency to form tertiary lymphoid organs in the later stages of COPD (98). A decrease in FEV1 has also been associated with a reduction in terminal bronchiolar number and thickening of the walls of the bronchi that survive (7). Collectively, these data suggest that the region of the lung where the smaller purely conducting airways transition into respiratory bronchioles, alveolar ducts, and sacs is susceptible to the inhalation of a variety of toxic particles and gases, primarily but not exclusively derived from tobacco smoking.
Small airway disease is often an important major component of both emphysema-predominant disease and airway-predominant disease involving larger airways (bronchi). Isolated small airway disease can also occur as a primary expression of COPD. Physiologic identification of small airway disease is difficult. CT can be helpful in identifying signs of inflammatory small airway disease and small airway obstruction.
Inflammatory small airway disease.—Inflammation in and around the small airways in patients with COPD can cause the airways to become visible at CT as poorly defined centrilobular nodules of ground-glass attenuation (Fig 12) (99–101). Pathologically, this process commonly corresponds with respiratory bronchiolitis (24). CLE and bronchial wall thickening are frequent associated findings. The centrilobular nodules of respiratory bronchiolitis may progress to CLE (102). Unless it is severe, centrilobular nodularity is a subjective visual finding and the boundary between normal and abnormal may be difficult to set. For this reason, substantial observer variation has been found in the assessment of centrilobular nodularity (73). The small centrilobular nodules of respiratory bronchiolitis are sometimes associated with patchy areas of ground-glass opacity that reflect respiratory bronchiolitis–interstitial lung disease or desquamative interstitial pneumonia (100).
Figure 12:
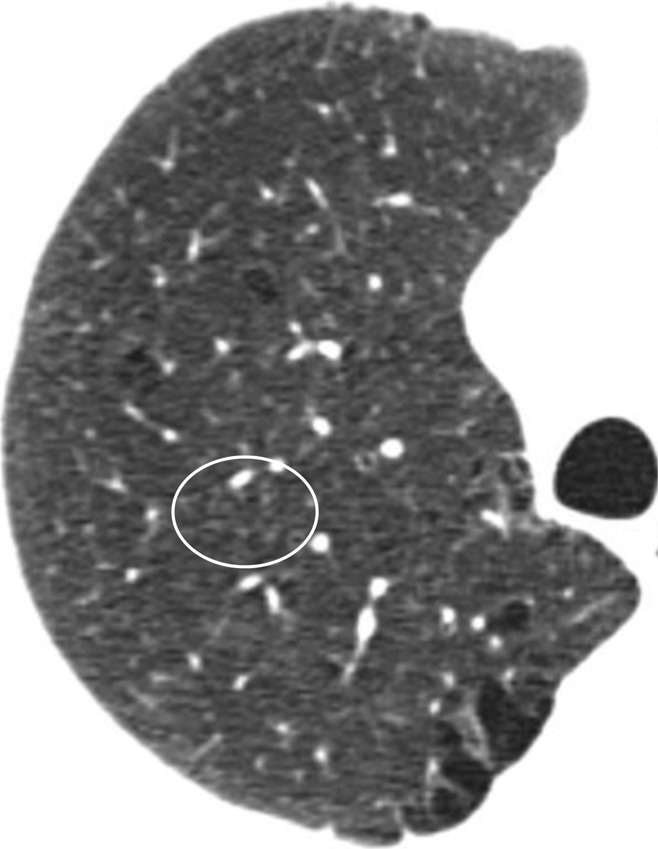
Widespread small centrilobular nodules. Centrilobular nodules (circled) in cigarette smoker are suggestive of respiratory bronchiolitis. Mild CLE and PSE are also present.
Obstructive small airway disease.—Obstructive small airway disease, in the absence of significant emphysema (defined in this analysis as quantitative CT extent of low-attenuation area <6%) may be identified by finding gas trapping at expiratory CT and/or by identifying physiologic obstruction (low FEV1 with low FEV1/FVC consistent with GOLD grades II, III, and IV).
At expiratory CT in healthy subjects, the lung attenuation usually increases in a homogeneous fashion. Air trapping, recognized as patchy or diffuse preservation of lung attenuation at expiratory CT (Fig 13), is common in cigarette smokers (12,103–106). Mechanisms of air trapping identified at CT may include prolonged lung emptying because of bronchiolar narrowing and dropout (7) and/or emphysematous destruction with loss of the elastic recoil force required to drive air out of the lungs (17,107).
Figure 13a:
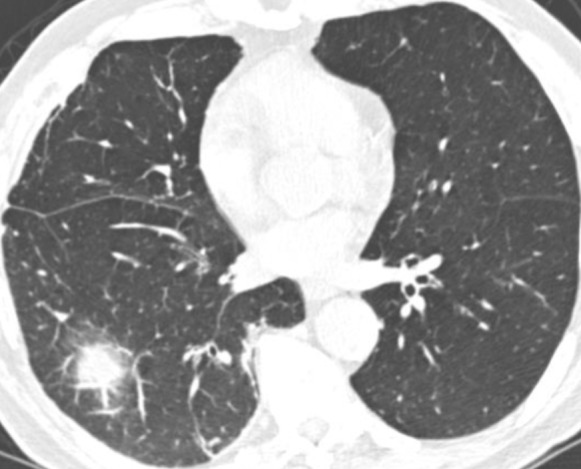
Gas trapping at expiratory CT. (a) Inspiratory and (b) expiratory CT scans in patient with severe airway obstruction (GOLD stage III) but only minimal emphysema. Lung attenuation fails to increase on expiratory scan, which is indicative of diffuse gas trapping owing to small airway obstruction.
Figure 13b:
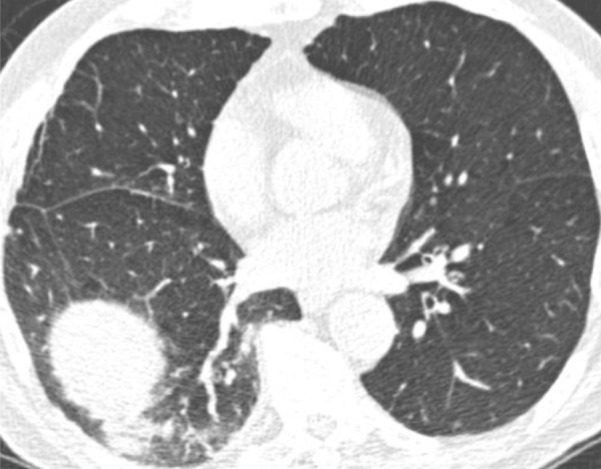
Gas trapping at expiratory CT. (a) Inspiratory and (b) expiratory CT scans in patient with severe airway obstruction (GOLD stage III) but only minimal emphysema. Lung attenuation fails to increase on expiratory scan, which is indicative of diffuse gas trapping owing to small airway obstruction.
The resistance in the small conducting airways smaller than 2 mm in diameter accounts for only 10%–20% of total lower airway resistance in healthy subjects (108–110). In lungs affected by COPD, however, small airway resistance increases substantially (109,110)—particularly in subjects with COPD who have minimal emphysematous destruction (110). Micro-CT has shown that the number of terminal bronchioles is reduced to as little as 10% of control values in the end stage of the CLE phenotype of COPD and to 25% of control values in the end stage of the PLE phenotype of COPD (7). This degree of reduction in numbers of terminal bronchioles probably makes a very important contribution to the increase in small airways resistance in COPD.
Other Important CT Features in Cigarette Smokers and in COPD
Interstitial Lung Abnormalities
In addition to centrilobular nodules, CT scans obtained in cigarette smokers may show abnormalities compatible with infiltrative lung disease, including ground-glass and reticular abnormalities. In a study of 2416 COPDGene participants who were cigarette smokers, an interstitial lung abnormality was found in 194 subjects (8%) (111). The prevalence of an interstitial abnormality increased with age, tobacco exposure, and current smoking. Although the interstitial abnormalities were usually asymptomatic, subjects with an interstitial abnormality were more likely to have a restrictive lung deficit and were less likely to meet the GOLD criteria for COPD. Similar changes were also seen in 2563 cigarette smokers in the MESA Lung Study and in the National Lung Screening Trial (112,113). Although detailed pathologic correlation is not available, these interstitial abnormalities likely correspond to variable combinations of respiratory bronchiolitis, airspace enlargement with fibrosis, and smoking-related interstitial fibrosis (114–116).
Pulmonary Vascular Disease
Pulmonary hypertension can be a complication of advanced COPD and may be due to hypoxic vasoconstriction, pulmonary vascular obliteration, sleep apnea, or left heart abnormality. This important comorbidity is an important predictor of hospitalization and death in COPD (117). Pulmonary hypertension can be identified at CT with the ratio of the diameters of the pulmonary artery and aorta (118,119). Enlargement of the pulmonary artery as determined by a pulmonary artery–aorta ratio of more than 1 was recently shown to be an independent risk factor for exacerbations in patients with COPD (120).
Abnormalities of the Trachea and Central Bronchi
Tracheobronchomalacia, defined as a reduction in the tracheal luminal cross-sectional area by more than 80% at dynamic expiratory imaging, is found in about 20% of patients with COPD but is not correlated with physiologic impairment (39). Indeed, the degree of tracheal collapse at end expiration in patients with COPD does not appear to be significantly different from that of control subjects (121). However, narrowing of the trachea in the coronal plane (saber-sheath trachea) is associated with COPD—particularly with more advanced stages of COPD (121–123). Diverticula or outpouching from the central airways may also be present; although the prevalence of bronchial diverticula is not different in patients with COPD than in control subjects (124), an increased number of diverticula is associated with a history of cigarette smoking (125) and with symptoms of cough (126).
Bronchiectasis
Bronchiectasis is defined at CT as a dilated bronchial lumen relative to the adjacent pulmonary artery, lack of bronchial tapering, or identification of bronchi within 1 cm of the pleural surface (81). The reported prevalence of bronchiectasis at CT in subjects with COPD ranges from 27% (127,128) to 58% (129). Differences in prevalence may relate to differing populations and the variation in criteria for the diagnosis of bronchiectasis. Bronchiectasis is most commonly cylindrical in character (129). The presence of bronchiectasis is associated with more severe airflow obstruction and with hospital admission for exacerbation (129).
Summary
Integration of visual characterization of emphysema and airway abnormalities with physiologic and quantitative CT assessment permits categorization of COPD into distinct structurally and functionally defined subtypes. These include identification of patients with five different patterns of emphysema-predominant subtypes and two patterns of airway-predominant subtypes (Fig 14). In addition, quantitative CT analysis is important to determine the severity of emphysema and the magnitude of expiratory gas trapping. The subjectivity of visual determinations of emphysema severity and gas trapping suggests that the combination of visual scoring and quantitative CT is essential to define these structure- and/or function-based COPD subtypes. Visual and quantitative CT evaluation will identify a substantial amount of disease in subjects with mild or absent physiologic evidence of airway obstruction. Use of consistent CT technique is required to characterize and quantify COPD subtypes in a manner that can help determine the progression of specific patterns of disease over time.
Figure 14:
CT-defined subtypes of COPD. Most subjects with emphysema have significant airway disease. Airway-predominant disease represents subjects with minimal or no emphysema as defined at quantitative CT (QCT ). * =There is a group of subjects without visually defined emphysema who have more than 6% of pixels less than −950 HU at quantitative CT. Further work is needed to understand the importance of this finding, and these individuals cannot currently be classified. A1AT = α1-antitrypsin.
Clearly, this classification must be regarded as a work in progress, and a number of areas can be identified for future research, including observer variation of the visual classification system, outcomes of the CT-defined phenotypes, histologic correlations of CT patterns, effect of aging on visual and quantitative features in the lung, CT phenotyping of nonsmoking-related COPD (eg, COPD related to biomass fuel), and clinical importance of increased quantitative measures of emphysema in subjects without visual emphysema.
Advance in Knowledge
■ Visually based classification of the CT appearances in chronic obstructive pulmonary disease (COPD) provides complementary information to quantitative CT.
Implication for Patient Care
■ Combined quantitative and visual assessment of CT may contribute to improved personalized care of patients with COPD.
Acknowledgments
Acknowledgments
We are grateful to Dragos Vasilescu, PhD, and Stijn Verleden, PhD, for preparing the images in Figure 2.
Received July 16, 2014; revision requested September 2; revision received October 28; accepted November 24; final version accepted February 16, 2015.
Funding: This research was supported by grants R01 HL089897 and R01 HL089856 from the National Heart, Lung, and Blood Institute.
Disclosures of Conflicts of Interest: D.A.L. Activities related to the present article: disclosed no relevant relationships. Activities not related to the present article: is a paid consultant for Perceptive Imaging, Boehringer Ingelheim, Genetech, Gilead, and Intermune; received a grant from Centocor and Siemens. Other relationships: disclosed no relevant relationships. J.H.M.A. disclosed no relevant relationships. J.C.H. disclosed no relevant relationships. P.A.G. disclosed no relevant relationships. H.U.K. Activities related to the present article: disclosed no relevant relationships. Activities not related to the present article: received a grant from Siemens and Boehringer Ingelheim; receives personal fees for being on speakers bureau from Siemens, Boehringer Ingelheim, Bracco, Bayer, Novartis, and Almirall; is on the board at Siemens; receives fees from Siemens for the provision and evaluation of hardware and software; received fees from Boehringer Ingelheim for expert testimony; received fees from Boehringer Ingelheim for educational presentation. Other relationships: disclosed no relevant relationships. A.A.B. Activities related to the present article: disclosed no relevant relationships. Activities not related to the present article: is a paid consultant for Spiration and Olympus; receives payment for lectures including service on speakers bureaus from ATS; receives royalties from Elsevier. Other relationships: disclosed no relevant relationships. R.G.B. Activities related to the present article: disclosed no relevant relationships. Activities not related to the present article: received a grant from Alpha 1 Foundation; received royalties from UpToDate. Other relationships: disclosed no relevant relationships. T.V.C. disclosed no relevant relationships. J.R.G. disclosed no relevant relationships. P.A.G. disclosed no relevant relationships. H.C. Activities related to the present article: disclosed no relevant relationships. Activities not related to the present article: is a paid consultant for GSK; has grants/grants pending from GSK and Spiration. Other relationships: disclosed no relevant relationships. E.A.H. Activities related to the present article: disclosed no relevant relationships. Activities not related to the present article: is a member of the CT Advisory Board of Siemens Healthcare; is a paid consultant for GSK and Novartis. Other relationships: has patents with VIDA diagnostics through the University of Iowa; is founder and shareholder of VIDA Diagnostics. J.D.N. Activities related to the present article: disclosed no relevant relationships. Activities not related to the present article: is a paid consultant for VIDA Diagnostics and GlaxoSmithKline; has stock options in VIDA Diagnostics; received a grant from Roche Pharmaceutical and Siemens Healthcare. Other relationships: has a patent with VIDA Diagnostics. M.P. disclosed no relevant relationships. E.K.S. Activities related to the present article: disclosed no relevant relationships. Activities not related to the present article: received a grant and personal fees from GlaxoSmithKline; received personal fees from Merck; received travel expenses from Novartis. Other relationships: disclosed no relevant relationships. J.D.C. disclosed no relevant relationships.
Abbreviations:
- CLE
- centrilobular emphysema
- COPD
- chronic obstructive pulmonary disease\
- FEV1
- forced expiratory volume in 1 second
- FVC
- forced vital capacity
- GOLD
- Global Obstructive Lung Disease
- PLE
- panlobular emphysema
- PSE
- paraseptal emphysema
References
- 1.Petty TL, Weinmann GG. Building a national strategy for the prevention and management of and research in chronic obstructive pulmonary disease. National Heart, Lung, and Blood Institute Workshop Summary. Bethesda, Maryland, August 29–31, 1995. JAMA 1997;277(3):246–253. [DOI] [PubMed] [Google Scholar]
- 2.Fabbri LM, Hurd SS; GOLD Scientific Committee. Global strategy for the diagnosis, management and prevention of COPD: 2003 update. Eur Respir J 2003;22(1):1–2. [DOI] [PubMed] [Google Scholar]
- 3.Friedlander AL, Lynch D, Dyar LA, Bowler RP. Phenotypes of chronic obstructive pulmonary disease. COPD 2007;4(4):355–384. [DOI] [PubMed] [Google Scholar]
- 4.Smith BM, Austin JH, Newell JD, Jr, et al. Pulmonary emphysema subtypes on computed tomography: the MESA COPD study. Am J Med 2014;127(1):94.e7–e23. [DOI] [PMC free article] [PubMed] [Google Scholar]
- 5.Klein JS, Gamsu G, Webb WR, Golden JA, Müller NL. High-resolution CT diagnosis of emphysema in symptomatic patients with normal chest radiographs and isolated low diffusing capacity. Radiology 1992;182(3):817–821. [DOI] [PubMed] [Google Scholar]
- 6.Mets OM, Schmidt M, Buckens CF, et al. Diagnosis of chronic obstructive pulmonary disease in lung cancer screening computed tomography scans: independent contribution of emphysema, air trapping and bronchial wall thickening. Respir Res 2013;14(1):59. [DOI] [PMC free article] [PubMed] [Google Scholar]
- 7.McDonough JE, Yuan R, Suzuki M, et al. Small-airway obstruction and emphysema in chronic obstructive pulmonary disease. N Engl J Med 2011;365(17):1567–1575. [DOI] [PMC free article] [PubMed] [Google Scholar]
- 8.Müller NL, Staples CA, Miller RR, Abboud RT. “Density mask:” an objective method to quantitate emphysema using computed tomography. Chest 1988;94(4):782–787. [DOI] [PubMed] [Google Scholar]
- 9.Murata K, Itoh H, Todo G, et al. Centrilobular lesions of the lung: demonstration by high-resolution CT and pathologic correlation. Radiology 1986;161(3):641–645. [DOI] [PubMed] [Google Scholar]
- 10.Madani A, Zanen J, de Maertelaer V, Gevenois PA. Pulmonary emphysema: objective quantification at multi–detector row CT—comparison with macroscopic and microscopic morphometry. Radiology 2006;238(3):1036–1043. [DOI] [PubMed] [Google Scholar]
- 11.Coxson HO, Rogers RM, Whittall KP, et al. A quantification of the lung surface area in emphysema using computed tomography. Am J Respir Crit Care Med 1999;159(3):851–856. [DOI] [PubMed] [Google Scholar]
- 12.Schroeder JD, McKenzie AS, Zach JA, et al. Relationships between airflow obstruction and quantitative CT measurements of emphysema, air trapping, and airways in subjects with and without chronic obstructive pulmonary disease. AJR Am J Roentgenol 2013;201(3):W460–W470. [DOI] [PMC free article] [PubMed] [Google Scholar]
- 13.Han MK, Bartholmai B, Liu LX, et al. Clinical significance of radiologic characterizations in COPD. COPD 2009;6(6):459–467. [DOI] [PubMed] [Google Scholar]
- 14.Johannessen A, Skorge TD, Bottai M, et al. Mortality by level of emphysema and airway wall thickness. Am J Respir Crit Care Med 2013;187(6):602–608. [DOI] [PubMed] [Google Scholar]
- 15.Galbán CJ, Han MK, Boes JL, et al. Computed tomography–based biomarker provides unique signature for diagnosis of COPD phenotypes and disease progression. Nat Med 2012;18(11):1711–1715. [DOI] [PMC free article] [PubMed] [Google Scholar]
- 16.Mets OM, Buckens CF, Zanen P, et al. Identification of chronic obstructive pulmonary disease in lung cancer screening computed tomographic scans. JAMA 2011;306(16):1775–1781. [DOI] [PubMed] [Google Scholar]
- 17.Gevenois PA, De Vuyst P, Sy M, et al. Pulmonary emphysema: quantitative CT during expiration. Radiology 1996;199(3):825–829. [DOI] [PubMed] [Google Scholar]
- 18.Mohamed Hoesein FA, Schmidt M, Mets OM, et al. Discriminating dominant computed tomography phenotypes in smokers without or with mild COPD. Respir Med 2014;108(1):136–143. [DOI] [PubMed] [Google Scholar]
- 19.Fain SB, Panth SR, Evans MD, et al. Early emphysematous changes in asymptomatic smokers: detection with 3He MR imaging. Radiology 2006;239(3):875–883. [DOI] [PubMed] [Google Scholar]
- 20.Gierada DS, Woods JC, Jacob RE, et al. Emphysema quantification in inflation-fixed lungs using low-dose computed tomography and 3He magnetic resonance imaging. J Comput Assist Tomogr 2010;34(5):773–779. [DOI] [PMC free article] [PubMed] [Google Scholar]
- 21.Lutey BA, Lefrak SS, Woods JC, et al. Hyperpolarized 3He MR imaging: physiologic monitoring observations and safety considerations in 100 consecutive subjects. Radiology 2008;248(2):655–661. [DOI] [PMC free article] [PubMed] [Google Scholar]
- 22.Sukstanskii AL, Yablonskiy DA. In vivo lung morphometry with hyperpolarized 3He diffusion MRI: theoretical background. J Magn Reson 2008;190(2):200–210. [DOI] [PMC free article] [PubMed] [Google Scholar]
- 23.Mugler JP, 3rd, Altes TA. Hyperpolarized 129Xe MRI of the human lung. J Magn Reson Imaging 2013;37(2):313–331. [DOI] [PMC free article] [PubMed] [Google Scholar]
- 24.Halaweish AF, Moon RE, Foster WM, et al. Perfluoropropane gas as a magnetic resonance lung imaging contrast agent in humans. Chest 2013;144(4):1300–1310. [DOI] [PubMed] [Google Scholar]
- 25.Friedman PJ. Imaging studies in emphysema. Proc Am Thorac Soc 2008;5(4):494–500. [DOI] [PMC free article] [PubMed] [Google Scholar]
- 26.Remy-Jardin M, Remy J, Gosselin B, Copin MC, Wurtz A, Duhamel A. Sliding thin slab, minimum intensity projection technique in the diagnosis of emphysema: histopathologic-CT correlation. Radiology 1996;200(3):665–671. [DOI] [PubMed] [Google Scholar]
- 27.Kim SS, Seo JB, Lee HY, et al. Chronic obstructive pulmonary disease: lobe-based visual assessment of volumetric CT by using standard images—comparison with quantitative CT and pulmonary function test in the COPDGene study. Radiology 2013;266(2):626–635. [DOI] [PMC free article] [PubMed] [Google Scholar]
- 28.Mayo JR. CT evaluation of diffuse infiltrative lung disease: dose considerations and optimal technique. J Thorac Imaging 2009;24(4):252–259. [DOI] [PubMed] [Google Scholar]
- 29.Sieren JP, Newell JD, Judy PF, et al. Reference standard and statistical model for intersite and temporal comparisons of CT attenuation in a multicenter quantitative lung study. Med Phys 2012;39(9):5757–5767. [DOI] [PMC free article] [PubMed] [Google Scholar]
- 30.Parr DG, Stoel BC, Stolk J, Nightingale PG, Stockley RA. Influence of calibration on densitometric studies of emphysema progression using computed tomography. Am J Respir Crit Care Med 2004;170(8):883–890. [DOI] [PubMed] [Google Scholar]
- 31.Newell JD, Jr, Sieren J, Hoffman EA. Development of quantitative computed tomography lung protocols. J Thorac Imaging 2013;28(5):266–271. [DOI] [PMC free article] [PubMed] [Google Scholar]
- 32.Sieren J, Hoffman EA, Baumhauer H, et al. CT imaging protocol standardization for use in a multicenter study: SPIROMICS [abstr]. In: Radiological Society of North America Scientific Assembly and Annual Meeting Program. Oak Brook, Ill: Radiological Society of North America, 2011; 262. [Google Scholar]
- 33.Gierada DS, Bierhals AJ, Choong CK, et al. Effects of CT section thickness and reconstruction kernel on emphysema quantification relationship to the magnitude of the CT emphysema index. Acad Radiol 2010;17(2):146–156. [DOI] [PMC free article] [PubMed] [Google Scholar]
- 34.Ley-Zaporozhan J, Ley S, Weinheimer O, et al. Quantitative analysis of emphysema in 3D using MDCT: influence of different reconstruction algorithms. Eur J Radiol 2008;65(2):228–234. [DOI] [PubMed] [Google Scholar]
- 35.Tschirren J, Hoffman EA, McLennan G, Sonka M. Segmentation and quantitative analysis of intrathoracic airway trees from computed tomography images. Proc Am Thorac Soc 2005;2(6):484–487, 503–504. [DOI] [PMC free article] [PubMed] [Google Scholar]
- 36.Lo P, van Ginneken B, Reinhardt JM, et al. Extraction of airways from CT (EXACT’09). IEEE Trans Med Imaging 2012;31(11):2093–2107. [DOI] [PubMed] [Google Scholar]
- 37.Mets OM, Willemink MJ, de Kort FP, et al. The effect of iterative reconstruction on computed tomography assessment of emphysema, air trapping and airway dimensions. Eur Radiol 2012;22(10):2103–2109. [DOI] [PMC free article] [PubMed] [Google Scholar]
- 38.Hersh CP, Washko GR, Estépar RS, et al. Paired inspiratory-expiratory chest CT scans to assess for small airways disease in COPD. Respir Res 2013;14(1):42. [DOI] [PMC free article] [PubMed] [Google Scholar]
- 39.Boiselle PM, Michaud G, Roberts DH, et al. Dynamic expiratory tracheal collapse in COPD: correlation with clinical and physiologic parameters. Chest 2012;142(6):1539–1544. [DOI] [PMC free article] [PubMed] [Google Scholar]
- 40.Kalender WA, Rienmüller R, Seissler W, Behr J, Welke M, Fichte H. Measurement of pulmonary parenchymal attenuation: use of spirometric gating with quantitative CT. Radiology 1990;175(1):265–268. [DOI] [PubMed] [Google Scholar]
- 41.Fuld MK, Grout RW, Guo J, Morgan JH, Hoffman EA. Systems for lung volume standardization during static and dynamic MDCT-based quantitative assessment of pulmonary structure and function. Acad Radiol 2012;19(8):930–940. [DOI] [PMC free article] [PubMed] [Google Scholar]
- 42.Bankier AA, O’Donnell CR, Boiselle PM. Quality initiatives: respiratory instructions for CT examinations of the lungs: a hands-on guide. RadioGraphics 2008;28(4):919–931. [DOI] [PubMed] [Google Scholar]
- 43.Ley-Zaporozhan J, Ley S, Krummenauer F, Ohno Y, Hatabu H, Kauczor HU. Low dose multi-detector CT of the chest (iLEAD Study): visual ranking of different simulated mAs levels. Eur J Radiol 2010;73(2):428–433. [DOI] [PubMed] [Google Scholar]
- 44.Gietema HA, Müller NL, Fauerbach PV, et al. Quantifying the extent of emphysema: factors associated with radiologists’ estimations and quantitative indices of emphysema severity using the ECLIPSE cohort. Acad Radiol 2011;18(6):661–671. [DOI] [PubMed] [Google Scholar]
- 45.Zaporozhan J, Ley S, Weinheimer O, et al. Multi-detector CT of the chest: influence of dose onto quantitative evaluation of severe emphysema: a simulation study. J Comput Assist Tomogr 2006;30(3):460–468. [DOI] [PubMed] [Google Scholar]
- 46.Madani A, De Maertelaer V, Zanen J, Gevenois PA. Pulmonary emphysema: radiation dose and section thickness at multidetector CT quantification—comparison with macroscopic and microscopic morphometry. Radiology 2007;243(1):250–257. [DOI] [PubMed] [Google Scholar]
- 47.Regan EA, Hokanson JE, Murphy JR, et al. Genetic epidemiology of COPD (COPDGene) study design. COPD 2010;7(1):32–43. [DOI] [PMC free article] [PubMed] [Google Scholar]
- 48.Coxson HO, Dirksen A, Edwards LD, et al. The presence and progression of emphysema in COPD as determined by CT scanning and biomarker expression: a prospective analysis from the ECLIPSE study. Lancet Respir Med 2013;1(2):129–136. [DOI] [PubMed] [Google Scholar]
- 49.Vestbo J, Anderson W, Coxson HO, et al. Evaluation of COPD longitudinally to identify predictive surrogate end-points (ECLIPSE). Eur Respir J 2008;31(4):869–873. [DOI] [PubMed] [Google Scholar]
- 50.Couper D, LaVange LM, Han M, et al. Design of the subpopulations and intermediate outcomes in copd study (SPIROMICS). Thorax 2014;69(5):491–494. [DOI] [PMC free article] [PubMed] [Google Scholar]
- 51.Bankier AA, Schaefer-Prokop C, De Maertelaer V, et al. Air trapping: comparison of standard-dose and simulated low-dose thin-section CT techniques. Radiology 2007;242(3):898–906. [DOI] [PubMed] [Google Scholar]
- 52.Nishio M, Matsumoto S, Ohno Y, et al. Emphysema quantification by low-dose CT: potential impact of adaptive iterative dose reduction using 3D processing. AJR Am J Roentgenol 2012;199(3):595–601. [DOI] [PubMed] [Google Scholar]
- 53.Zach JA, Newell JD, Jr, Schroeder J, et al. Quantitative computed tomography of the lungs and airways in healthy nonsmoking adults. Invest Radiol 2012;47(10):596–602. [DOI] [PMC free article] [PubMed] [Google Scholar]
- 54.Hackx M, Bankier AA, Gevenois PA. Chronic obstructive pulmonary disease: CT quantification of airways disease. Radiology 2012;265(1):34–48. [DOI] [PubMed] [Google Scholar]
- 55.Lee YK, Oh YM, Lee JH, et al. Quantitative assessment of emphysema, air trapping, and airway thickening on computed tomography. Lung 2008;186(3):157–165. [DOI] [PubMed] [Google Scholar]
- 56.Paré PD, Nagano T, Coxson HO. Airway imaging in disease: gimmick or useful tool? J Appl Physiol (1985) 2012;113(4):636–646. [DOI] [PMC free article] [PubMed] [Google Scholar]
- 57.Xie X, de Jong PA, Oudkerk M, et al. Morphological measurements in computed tomography correlate with airflow obstruction in chronic obstructive pulmonary disease: systematic review and meta-analysis. Eur Radiol 2012;22(10):2085–2093. [DOI] [PMC free article] [PubMed] [Google Scholar]
- 58.Lynch DA, Al-Qaisi MA. Quantitative computed tomography in chronic obstructive pulmonary disease. J Thorac Imaging 2013;28(5):284–290. [DOI] [PMC free article] [PubMed] [Google Scholar]
- 59.McLean K. The histology of localized emphysema. Australasian annals of medicine. 1957;6(4):282–294. [DOI] [PubMed] [Google Scholar]
- 60.McLean K. The histology of generalized pulmonary emphysema. II. Diffuse emphysema. Australas Ann Med 1957;6(3):203–217. [DOI] [PubMed] [Google Scholar]
- 61.McLean KH. The histology of generalized pulmonary emphysema. I. The genesis of the early centrolobular lesion: focal emphysema. Australas Ann Med 1957;6(2):124–140. [DOI] [PubMed] [Google Scholar]
- 62.McLean KH. The macroscopic anatomy of pulmonary emphysema. Australas Ann Med 1956;5(2):73–88. [DOI] [PubMed] [Google Scholar]
- 63.Leopold JG, Gough J. The centrilobular form of hypertrophic emphysema and its relation to chronic bronchitis. Thorax 1957;12(3):219–235. [DOI] [PMC free article] [PubMed] [Google Scholar]
- 64.Leopold JG, Gough J. Post-mortem bronchography in the study of bronchitis and emphysema. Thorax 1963;18:172–177. [Google Scholar]
- 65.Hogg JC, Nepszy SJ, Macklem PT, Thurlbeck WM. Elastic properties of the centrilobular emphysematous space. J Clin Invest 1969;48(7):1306–1312. [DOI] [PMC free article] [PubMed] [Google Scholar]
- 66.Foster WL, Jr, Gimenez EI, Roubidoux MA, et al. The emphysemas: radiologic-pathologic correlations. Radiographics 1993;13(2):311–328. [DOI] [PubMed] [Google Scholar]
- 67.Foster WL, Jr, Pratt PC, Roggli VL, Godwin JD, Halvorsen RA, Jr, Putman CE. Centrilobular emphysema: CT-pathologic correlation. Radiology 1986;159(1):27–32. [DOI] [PubMed] [Google Scholar]
- 68.Hruban RH, Meziane MA, Zerhouni EA, et al. High resolution computed tomography of inflation-fixed lungs: pathologic-radiologic correlation of centrilobular emphysema. Am Rev Respir Dis 1987;136(4):935–940. [DOI] [PubMed] [Google Scholar]
- 69.Kim WD, Eidelman DH, Izquierdo JL, Ghezzo H, Saetta MP, Cosio MG. Centrilobular and panlobular emphysema in smokers: two distinct morphologic and functional entities. Am Rev Respir Dis 1991;144(6):1385–1390. [DOI] [PubMed] [Google Scholar]
- 70.Wyatt JP, Fischer VW, Sweet HC. Panlobular emphysema: anatomy and pathodynamics. Dis Chest 1962;41(3):239–259. [DOI] [PubMed] [Google Scholar]
- 71.Laurell CB, Eriksson S. The electrophoretic α1-globulin pattern of serum in α1-antitrypsin deficiency. Scand J Clin Lab Invest 1963;15(2):132–140. [Google Scholar]
- 72.Perlmutter DH, Brodsky JL, Balistreri WF, Trapnell BC. Molecular pathogenesis of alpha-1-antitrypsin deficiency–associated liver disease: a meeting review. Hepatology 2007;45(5):1313–1323. [DOI] [PubMed] [Google Scholar]
- 73.Lehman A, Mattman A, Sin D, et al. Emphysema in an adult with galactosialidosis linked to a defect in primary elastic fiber assembly. Mol Genet Metab 2012;106(1):99–103. [DOI] [PubMed] [Google Scholar]
- 74.Stern EJ, Frank MS, Schmutz JF, Glenny RW, Schmidt RA, Godwin JD. Panlobular pulmonary emphysema caused by i.v. injection of methylphenidate (ritalin): findings on chest radiographs and CT scans. AJR Am J Roentgenol 1994;162(3):555–560. [DOI] [PubMed] [Google Scholar]
- 75.Copley SJ, Wells AU, Müller NL, et al. Thin-section CT in obstructive pulmonary disease: discriminatory value. Radiology 2002;223(3):812–819. [DOI] [PubMed] [Google Scholar]
- 76.Guest PJ, Hansell DM. High resolution computed tomography (HRCT) in emphysema associated with alpha-1-antitrypsin deficiency. Clin Radiol 1992;45(4):260–266. [DOI] [PubMed] [Google Scholar]
- 77.Heard BE. A pathological study of emphysema of the lungs with chronic bronchitis. Thorax 1958;13(2):136–149. [DOI] [PMC free article] [PubMed] [Google Scholar]
- 78.Satoh K, Kobayashi T, Misao T, et al. CT assessment of subtypes of pulmonary emphysema in smokers. Chest 2001;120(3):725–729. [DOI] [PubMed] [Google Scholar]
- 79.Mets OM, van Hulst RA, Jacobs C, van Ginneken B, de Jong PA. Normal range of emphysema and air trapping on CT in young men. AJR Am J Roentgenol 2012;199(2):336–340. [DOI] [PubMed] [Google Scholar]
- 80.COPDGene CT Workshop Group , Barr RG, Berkowitz EA, et al. A combined pulmonary-radiology workshop for visual evaluation of COPD: study design, chest CT findings and concordance with quantitative evaluation. COPD 2012;9(2):151–159. [DOI] [PMC free article] [PubMed] [Google Scholar]
- 81.Hansell DM, Bankier AA, MacMahon H, McLoud TC, Müller NL, Remy J. Fleischner society: glossary of terms for thoracic imaging. Radiology 2008;246(3):697–722. [DOI] [PubMed] [Google Scholar]
- 82.Gierada DS, Glazer HS, Slone RM. Pseudomass due to atelectasis in patients with severe bullous emphysema. AJR Am J Roentgenol 1997;168(1):85–92. [DOI] [PubMed] [Google Scholar]
- 83.Stern EJ, Webb WR, Weinacker A, Müller NL. Idiopathic giant bullous emphysema (vanishing lung syndrome): imaging findings in nine patients. AJR Am J Roentgenol 1994;162(2):279–282. [DOI] [PubMed] [Google Scholar]
- 84.Park JS, Brown KK, Tuder RM, Hale VA, King TE, Jr, Lynch DA. Respiratory bronchiolitis–associated interstitial lung disease: radiologic features with clinical and pathologic correlation. J Comput Assist Tomogr 2002;26(1):13–20. [DOI] [PubMed] [Google Scholar]
- 85.Ooi GC, Khong PL, Chan-Yeung M, et al. High-resolution CT quantification of bronchiectasis: clinical and functional correlation. Radiology 2002;225(3):663–672. [DOI] [PubMed] [Google Scholar]
- 86.Grenier P, Mourey-Gerosa I, Benali K, et al. Abnormalities of the airways and lung parenchyma in asthmatics: CT observations in 50 patients and inter- and intraobserver variability. Eur Radiol 1996;6(2):199–206. [DOI] [PubMed] [Google Scholar]
- 87.Nakano Y, Wong JC, de Jong PA, et al. The prediction of small airway dimensions using computed tomography. Am J Respir Crit Care Med 2005;171(2):142–146. [DOI] [PubMed] [Google Scholar]
- 88.Berger P, Perot V, Desbarats P, Tunon-de-Lara JM, Marthan R, Laurent F. Airway wall thickness in cigarette smokers: quantitative thin-section CT assessment. Radiology 2005;235(3):1055–1064. [DOI] [PubMed] [Google Scholar]
- 89.Kitaguchi Y, Fujimoto K, Kubo K, Honda T. Characteristics of COPD phenotypes classified according to the findings of HRCT. Respir Med 2006;100(10):1742–1752. [DOI] [PubMed] [Google Scholar]
- 90.Orlandi I, Moroni C, Camiciottoli G, et al. Chronic obstructive pulmonary disease: thin-section CT measurement of airway wall thickness and lung attenuation. Radiology 2005;234(2):604–610. [DOI] [PubMed] [Google Scholar]
- 91.Aziz ZA, Wells AU, Desai SR, et al. Functional impairment in emphysema: contribution of airway abnormalities and distribution of parenchymal disease. AJR Am J Roentgenol 2005;185(6):1509–1515. [DOI] [PubMed] [Google Scholar]
- 92.Hasegawa M, Nasuhara Y, Onodera Y, et al. Airflow limitation and airway dimensions in chronic obstructive pulmonary disease. Am J Respir Crit Care Med 2006;173(12):1309–1315. [DOI] [PubMed] [Google Scholar]
- 93.Niewoehner DE, Kleinerman J, Rice DB. Pathologic changes in the peripheral airways of young cigarette smokers. N Engl J Med 1974;291(15):755–758. [DOI] [PubMed] [Google Scholar]
- 94.Myers JL, Veal CF, Jr, Shin MS, Katzenstein AL. Respiratory bronchiolitis causing interstitial lung disease: a clinicopathologic study of six cases. Am Rev Respir Dis 1987;135(4):880–884. [DOI] [PubMed] [Google Scholar]
- 95.Yousem SA, Colby TV, Gaensler EA. Respiratory bronchiolitis–associated interstitial lung disease and its relationship to desquamative interstitial pneumonia. Mayo Clin Proc 1989;64(11):1373–1380. [DOI] [PubMed] [Google Scholar]
- 96.Monick MM, Powers LS, Walters K, et al. Identification of an autophagy defect in smokers’ alveolar macrophages. J Immunol 2010;185(9):5425–5435. [DOI] [PMC free article] [PubMed] [Google Scholar]
- 97.Hogg JC, Wright JL, Wiggs BR, Coxson HO, Opazo Saez A, Paré PD. Lung structure and function in cigarette smokers. Thorax 1994;49(5):473–478. [DOI] [PMC free article] [PubMed] [Google Scholar]
- 98.Hogg JC, Chu F, Utokaparch S, et al. The nature of small-airway obstruction in chronic obstructive pulmonary disease. N Engl J Med 2004;350(26):2645–2653. [DOI] [PubMed] [Google Scholar]
- 99.Gruden JF, Webb WR. CT findings in a proved case of respiratory bronchiolitis. AJR Am J Roentgenol 1993;161(1):44–46. [DOI] [PubMed] [Google Scholar]
- 100.Heyneman LE, Ward S, Lynch DA, Remy-Jardin M, Johkoh T, Müller NL. Respiratory bronchiolitis, respiratory bronchiolitis–associated interstitial lung disease, and desquamative interstitial pneumonia: different entities or part of the spectrum of the same disease process? AJR Am J Roentgenol 1999;173(6):1617–1622. [DOI] [PubMed] [Google Scholar]
- 101.Okada F, Ando Y, Yoshitake S, et al. Clinical/pathologic correlations in 553 patients with primary centrilobular findings on high-resolution CT scan of the thorax. Chest 2007;132(6):1939–1948. [DOI] [PubMed] [Google Scholar]
- 102.Remy-Jardin M, Edme JL, Boulenguez C, Remy J, Mastora I, Sobaszek A. Longitudinal follow-up study of smoker’s lung with thin-section CT in correlation with pulmonary function tests. Radiology 2002;222(1):261–270. [DOI] [PubMed] [Google Scholar]
- 103.Crausman RS, Ferguson G, Irvin CG, Make B, Newell JD, Jr. Quantitative chest computed tomography as a means of predicting exercise performance in severe emphysema [published correction appears in Acad Radiol 1995;2(10):870]. Acad Radiol 1995;2(6):463–469. [DOI] [PubMed] [Google Scholar]
- 104.Eda S, Kubo K, Fujimoto K, Matsuzawa Y, Sekiguchi M, Sakai F. The relations between expiratory chest CT using helical CT and pulmonary function tests in emphysema. Am J Respir Crit Care Med 1997;155(4):1290–1294. [DOI] [PubMed] [Google Scholar]
- 105.Lee KW, Chung SY, Yang I, Lee Y, Ko EY, Park MJ. Correlation of aging and smoking with air trapping at thin-section CT of the lung in asymptomatic subjects. Radiology 2000;214(3):831–836. [DOI] [PubMed] [Google Scholar]
- 106.Matsuoka S, Kurihara Y, Yagihashi K, Hoshino M, Watanabe N, Nakajima Y. Quantitative assessment of air trapping in chronic obstructive pulmonary disease using inspiratory and expiratory volumetric MDCT. AJR Am J Roentgenol 2008;190(3):762–769. [DOI] [PubMed] [Google Scholar]
- 107.Mead J, Turner JM, Macklem PT, Little JB. Significance of the relationship between lung recoil and maximum expiratory flow. J Appl Physiol 1967;22(1):95–108. [DOI] [PubMed] [Google Scholar]
- 108.Macklem PT, Mead J. Resistance of central and peripheral airways measured by a retrograde catheter. J Appl Physiol 1967;22(3):395–401. [DOI] [PubMed] [Google Scholar]
- 109.Hogg JC, Macklem PT, Thurlbeck WM. Site and nature of airway obstruction in chronic obstructive lung disease. N Engl J Med 1968;278(25):1355–1360. [DOI] [PubMed] [Google Scholar]
- 110.Yanai M, Sekizawa K, Ohrui T, Sasaki H, Takishima T. Site of airway obstruction in pulmonary disease: direct measurement of intrabronchial pressure. J Appl Physiol (1985) 1992;72(3):1016–1023. [DOI] [PubMed] [Google Scholar]
- 111.Washko GR, Lynch DA, Matsuoka S, et al. Identification of early interstitial lung disease in smokers from the COPDGene study. Acad Radiol 2010;17(1):48–53. [DOI] [PMC free article] [PubMed] [Google Scholar]
- 112.Jin GY, Lynch D, Chawla A, et al. Interstitial lung abnormalities in a CT lung cancer screening population: prevalence and progression rate. Radiology 2013;268(2):563–571. [DOI] [PMC free article] [PubMed] [Google Scholar]
- 113.Lederer DJ, Enright PL, Kawut SM, et al. Cigarette smoking is associated with subclinical parenchymal lung disease: the Multi-Ethnic Study of Atherosclerosis (MESA)-lung study. Am J Respir Crit Care Med 2009;180(5):407–414. [DOI] [PMC free article] [PubMed] [Google Scholar]
- 114.Reddy TL, Mayo J, Churg A. Respiratory bronchiolitis with fibrosis: high-resolution computed tomography findings and correlation with pathology. Ann Am Thorac Soc 2013;10(6):590–601. [DOI] [PubMed] [Google Scholar]
- 115.Katzenstein AL, Mukhopadhyay S, Zanardi C, Dexter E. Clinically occult interstitial fibrosis in smokers: classification and significance of a surprisingly common finding in lobectomy specimens. Hum Pathol 2010;41(3):316–325. [DOI] [PubMed] [Google Scholar]
- 116.Yamada T, Nakanishi Y, Homma T, et al. Airspace enlargement with fibrosis shows characteristic histology and immunohistology different from usual interstitial pneumonia, nonspecific interstitial pneumonia and centrilobular emphysema. Pathol Int 2013;63(4):206–213. [DOI] [PubMed] [Google Scholar]
- 117.Chaouat A, Naeije R, Weitzenblum E. Pulmonary hypertension in COPD. Eur Respir J 2008;32(5):1371–1385. [DOI] [PubMed] [Google Scholar]
- 118.Murray TI, Boxt LM, Katz J, Reagan K, Barst RJ. Estimation of pulmonary artery pressure in patients with primary pulmonary hypertension by quantitative analysis of magnetic resonance images. J Thorac Imaging 1994;9(3):198–204. [DOI] [PubMed] [Google Scholar]
- 119.Ng CS, Wells AU, Padley SP. A CT sign of chronic pulmonary arterial hypertension: the ratio of main pulmonary artery to aortic diameter. J Thorac Imaging 1999;14(4):270–278. [DOI] [PubMed] [Google Scholar]
- 120.Wells JM, Washko GR, Han MK, et al. Pulmonary arterial enlargement and acute exacerbations of COPD. N Engl J Med 2012;367(10):913–921. [DOI] [PMC free article] [PubMed] [Google Scholar]
- 121.Lee HJ, Seo JB, Chae EJ, et al. Tracheal morphology and collapse in COPD: correlation with CT indices and pulmonary function test. Eur J Radiol 2011;80(3):e531–e535. [DOI] [PubMed] [Google Scholar]
- 122.Greene R, Lechner GL. “Saber-sheath” trachea: a clinical and functional study of marked coronal narrowing of the intrathoracic trachea. Radiology 1975;115(2):265–268. [DOI] [PubMed] [Google Scholar]
- 123.Gupta PP, Yadav R, Verma M, Agarwal D, Kumar M. Correlation between high-resolution computed tomography features and patients’ characteristics in chronic obstructive pulmonary disease. Ann Thorac Med 2008;3(3):87–93. [DOI] [PMC free article] [PubMed] [Google Scholar]
- 124.Higuchi T, Takahashi N, Shiotani M, et al. Main bronchial diverticula in the subcarinal region: their relation to airflow limitations. Acta Radiol 2012;53(1):44–48. [DOI] [PubMed] [Google Scholar]
- 125.Miyara T, Oshiro Y, Yamashiro T, Kamiya H, Ogawa K, Murayama S. Bronchial diverticula detected by multidetector-row computed tomography: incidence and clinical features. J Thorac Imaging 2011;26(3):204–208. [DOI] [PubMed] [Google Scholar]
- 126.Sverzellati N, Ingegnoli A, Calabrò E, et al. Bronchial diverticula in smokers on thin-section CT. Eur Radiol 2010;20(1):88–94. [DOI] [PubMed] [Google Scholar]
- 127.Bafadhel M, Umar I, Gupta S, et al. The role of CT scanning in multidimensional phenotyping of COPD. Chest 2011;140(3):634–642. [DOI] [PMC free article] [PubMed] [Google Scholar]
- 128.O’Brien C, Guest PJ, Hill SL, Stockley RA. Physiological and radiological characterisation of patients diagnosed with chronic obstructive pulmonary disease in primary care. Thorax 2000;55(8):635–642. [DOI] [PMC free article] [PubMed] [Google Scholar]
- 129.Martínez-García MA, Soler-Cataluña JJ, Donat Sanz Y, et al. Factors associated with bronchiectasis in patients with COPD. Chest 2011;140(5):1130–1137. [DOI] [PubMed] [Google Scholar]


