

Abstract
Because it is unknown whether 24-h energy expenditure (EE) responses to dietary extremes will identify phenotypes associated with weight regulation, the aim of this study was to determine whether such responses to fasting or overfeeding are associated with future weight change. The 24-h EE during energy balance, fasting, and four different overfeeding diets with 200% energy requirements was measured in a metabolic chamber in 37 subjects with normal glucose regulation while they resided on our clinical research unit. Diets were given for 24 h each and included the following: 1) low protein (3%), 2) standard (50% carbohydrate, 20% protein), 3) high fat (60%), and 4) high carbohydrate (75%). Participants returned for follow-up 6 months after the initial measures. The decrease in 24-h EE during fasting and the increase with overfeeding were correlated. A larger reduction in EE during fasting, a smaller EE response to low-protein overfeeding, and a larger response to high-carbohydrate overfeeding all correlated with weight gain. The association of the fasting EE response with weight change was not independent from that of low protein in a multivariate model. We identified the following two independent propensities associated with weight gain: a predilection for conserving energy during caloric and protein deprivation and a profligate response to large amounts of carbohydrates.
Introduction
Human overfeeding studies (1–5) suggest that there is a considerable interindividual variation in the energy cost of weight gain. In a prior cross-sectional study (5), the increase in energy expenditure (EE) with overfeeding and the decrease with fasting (FST) were found to be correlated in a small group of 14 male subjects. Our group has previously shown that the EE response to overfeeding varies considerably among individuals but is consistent and reproducible within individuals. This individual contribution explains more of the observed variability in the EE changes with overfeeding than changes to the macronutrient content of the diet (6). These studies seem to indicate that phenotypic differences may exist in the EE responses to FST or overfeeding that may affect susceptibility to weight gain. As overeating or caloric restriction are necessary to alter weight, perturbations in energy balance (EB) may be needed to uncover responses that signify an energy-conserving physiology versus a physiology that is better able to resist weight gain. We now extend our previous findings by addressing the question of whether this interindividual variation in EE changes relates to future weight change.
During overfeeding, the metabolic response depends, in part, on the macronutrient composition of the diet in addition to the contribution from interindividual variation (6). Although it has been proposed that low-protein diets might magnify differences in the propensity to obesity (2,7), a recent study (8) has shown that the EE response is smaller and fat mass (FM) gain is similar when overeating low-protein diets compared with normal-protein diets. Further, high-carbohydrate diets have been shown to have a greater EE increase during overfeeding compared with high-fat diets (9). In addition, a single large high-carbohydrate meal has been shown to activate brown adipose tissue (10). Differences in the short-term (24-h) EE response to overeating diets varying in macronutrient content may therefore facilitate the identification of human phenotypes with increased susceptibility to future weight gain. We hypothesized that a larger reduction in EE during FST and a smaller increase in EE during 24 h of overfeeding would be associated with weight gain at 6 months in free-living, healthy individuals who had not been counseled on any lifestyle changes. In addition, we hypothesized that varying the macronutrient content of the overfeeding diet might identify macronutrient-specific differences in the EE response to overfeeding that would be more strongly associated with future weight change.
Research Design and Methods
Subjects
Volunteers were recruited from the Phoenix, AZ, area between 2007 and 2013 and were admitted to our clinical research unit (CRU) for 25 days to participate in an inpatient study exploring the metabolic responses to FST and overfeeding. Among the 59 individuals who completed the baseline CRU admission, 37 had follow-up data for body weight 6 months after CRU discharge and were included in the present analysis (Fig. 1). This report represents a preplanned analysis of an ongoing study when a target sample size of 37 subjects had completed the 6-month follow-up to provide 90% power (α = 0.05) to detect a simple correlation of 0.5 between the percentage change in EE with overfeeding or FST and the primary end point of body weight change at follow-up. These 37 individuals did not differ from the larger initial group with regard to demographics, anthropometrics, and 24-h EE measures. All subjects reported a stable weight for at least 6 months and were healthy according to history, physical examination, electrocardiogram, and laboratory test results. None of the subjects had a vegetarian or gluten-free lifestyle, and none had a known food allergy. All women were premenopausal and not pregnant. All volunteers provided informed, written consent. The experimental protocol was approved by the Institutional Review Board of the National Institute of Diabetes and Digestive and Kidney Diseases.
Figure 1.

Flow diagram of participant progress through the study.
Upon CRU admission, volunteers were given a weight-maintaining diet (WMD) consisting of 50% carbohydrates, 30% fats, and 20% proteins, with total caloric content based on previously derived equations specific to our CRU that include weight, BMI, and sex (11). Morning weight was checked daily, and the WMD was adjusted as necessary throughout the CRU stay to maintain a stable weight (±1%). The WMD was given throughout the stay except on the days when subjects had 24-h EE assessments. Volunteers were asked to consume all food given to them, and to engage only in sedentary activities for the duration of their stay on the CRU. Body composition was measured using DXA (DPX-1; Lunar Corp, Madison, WI). After 3 days on the WMD, a 75-g oral glucose tolerance test was performed. Only individuals with normal glucose regulation (12) were eligible to participate. Plasma glucose concentrations were measured using an enzymatic oxygen-rate method (Beckman Glucose Analyzer 2; Beckman Instruments, Brea, CA) (n = 7) or the comparable Analox GM9 glucose oxidase method (Analox Instruments USA, Lunenburg, MA) (n = 30).
EE Measures and Dietary Interventions
Each volunteer completed seven 24-h EE assessments in a whole-room indirect calorimeter: two eucaloric assessments (the first eucaloric measurement in the metabolic chamber [EB0] and EB) followed by five EE measurements during the dietary interventions described below (Fig. 2). There was a 3-day washout period between each dietary intervention to allow any residual effects of the 24-h dietary intervention to wane. The average coefficient of variation (CV) of the volunteers’ body weight prior to the dietary interventions was 0.94 ± 0.48%, indicating that body weight was stable (<1%) during the admission period.
Figure 2.

Study diagram of the clinical study.
For all diets, volunteers were given breakfast at 0700 h and entered the calorimeter 1 h later. Further meals were provided inside the calorimeter at 1100, 1600, and 1900 h through a two-door airlock. Total energy intake of the four meals given during EB0 was 80% of the WMD to account for reduced activity in the calorimeter (13). To increase the precision of the EE measure during EB, energy intake during the second eucaloric measurement (EB) was equal to the 24-h EE value measured in EB0. The 24-h EE from this second eucaloric assessment (EB), which was used as the baseline comparator, was then doubled to determine the number of kilocalories given for the subsequent overfeeding diets (200% energy requirements).
Volunteers completed in randomized order five intervention diets, each of which was administered for only 24 h, as follows: fasting (FST); low-protein overfeeding with 51% carbohydrate, 46% fat, and 3% protein (LPF); standard overfeeding with 50% carbohydrate, 30% fat, and 20% protein (SOF); high-fat, normal-protein overfeeding with 20% carbohydrate, 60% fat, and 20% protein; and high-carbohydrate, normal-protein overfeeding with 75% carbohydrate, 5% fat, and 20% protein (CNP) (Fig. 2). The macronutrient composition of each diet was determined using The Food Processor software (ESHA Research, Salem, OR). Subjects returned all uneaten portions to the metabolic kitchen for weighing, so that actual intake by macronutrient could be calculated. Five (2% of total 222 chamber sessions) EE measurements (1 standard, 2 high-fat, and 2 high-carbohydrate diet) were excluded as <95% of food was consumed.
Ambient temperature averaged 23.6 ± 1.4°C. The average O2 consumption and CO2 production were used to calculate the 24-h EE and respiratory quotient (RQ), as previously described (6). The RQ was used as a proxy for the carbohydrate-to-fat oxidation ratio. Quality control tests were performed monthly, and demonstrated mean recoveries of 99 ± 3% (CV 3.6%) and 98 ± 3% (CV 3.4%) for O2 and CO2, respectively. EB was the difference between caloric intake and 24-h EE. Spontaneous physical activity (SPA) was detected by radar sensors and WAS expressed as the percentage of time in which motion was detected.
Follow-up Visit
Upon completion of the EE assessments, participants were not provided with any lifestyle counseling and were advised to return to their usual habits. They were, however, provided with the results of their DXA scan and oral glucose tolerance test. Participants were discharged from the CRU and were asked to return at a scheduled 6-month follow-up visit for the measurement of weight and body composition.
Statistical Analysis
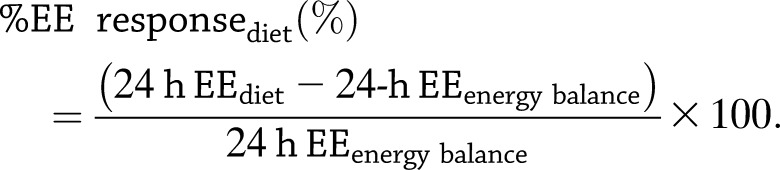
Statistical analyses were performed using the SAS version 9.2 (SAS Institute, Cary, NC). The α value was set at 0.05. Data are presented as the mean ± SD. The Shapiro-Wilks test was used to assess the normality of the data. Data were scanned for potential outliers using the methods of Grubbs (14) and Tukey (15), and the generalized extreme Studentized deviate test (16). No outliers were identified. Differences between groups were evaluated using Student t test or χ2 analyses for continuous and categorical variables, respectively. Ethnic differences were assessed by one-way ANOVA. To normalize the EE response to body size, the percentage change in 24-h EE (%EE) during each dietary intervention was calculated as the difference divided by the 24-h EE during EB and expressed as a percentage, as follows:
 |
Pearson correlations were used to determine the correlations between normally distributed continuous variables, and Spearman correlations were used for non-normally distributed variables. For some analyses, the EE responses to the four overfeeding diets were averaged per person to understand the general effects of overfeeding. Associations with the response to overfeeding were determined from mixed models, accounting for repeated measures and including the variables age, sex, ethnicity, percentage of body fat, and diet. Differences between diets were adjusted for multiple comparisons using the Tukey range test.
Significant correlations between EE responses to FST and overfeeding with weight change were followed-up with regression models to adjust for age, sex, ethnicity, and baseline weight. All results were confirmed using the percentage weight change per month in place of absolute weight change. Similar models were calculated for the absolute changes in FM and fat-free mass (FFM), including initial baseline measures as covariates. Multivariate regression models were created to determine the independence of the identified associations. Adjusting for SPA did not substantially change any results; thus, only findings using unaltered 24-h EE are reported.
Results
Subjects Characteristics
General, anthropometric, and EE characteristics of the study population during EB are shown in Table 1. Body composition, 24-h EE, and the percentage change in EE with FST or overfeeding did not differ between ethnic groups.
Table 1.
Demographic, anthropometric, and metabolic characteristics of the study group during EB and at the 6-month follow-up
| Whole study group (n = 37) | Men (n = 27) | Women (n = 10) | P value* | |
|---|---|---|---|---|
| Ethnicity | 7 AA, 11 W, 9 H, 10 NA | 2 AA, 8 W, 8 H, 9 NA | 5 AA, 3 W, 1 H, 1 NA | 0.02† |
| Age (years) | 36.1 ± 9.6 (19.3, 54.1) | 36.7 ± 10.3 (19.3, 54.1) | 34.7 ± 7.8 (21.3, 44.7) | 0.58 |
| Body weight (kg) | 77.8 ± 11.8 (56.4, 107.8) | 78.4 ± 10.3 (60.6, 103.5) | 76.1 ± 15.9 (56.4, 107.8) | 0.60 |
| Height (cm) | 172.7 ± 6.4 (156.8, 185.0) | 175.2 ± 5.1 (161.5, 185.0) | 166.1 ± 4.8 (156.8, 170.0) | <0.001 |
| BMI (kg/m2) | 26.1 ± 4.0 (18.3, 39.1) | 25.6 ± 3.4 (18.3, 33.4) | 27.6 ± 5.5 (20.7, 39.1) | 0.19 |
| Body fat (%) | 28.2 ± 11.4 (6.9, 53.8) | 23.4 ± 8.2 (6.9, 36.4) | 41.2 ± 8.3 (24.2, 53.8) | <0.001 |
| FM (kg) | 22.5 ± 11.2 (4.9, 56.9) | 18.8 ± 8.0 (4.9, 33.0) | 32.4 ± 13.0 (13.6, 56.9) | <0.001 |
| FFM (kg) | 55.3 ± 9.5 (34.2, 79.4) | 59.6 ± 6.9 (46.9, 79.4) | 43.7 ± 4.2 (34.2, 50.9) | <0.001 |
| FST glucose (mg/dL) | 92.2 ± 4.6 (80.0, 99.0) | 92.1 ± 5.0 (80.0, 99.0) | 92.5 ± 3.4 (89.0, 99.0) | 0.82 |
| 2-h glucose (mg/dL) | 102.6 ± 20.2 (46.0, 133.0) | 102.9 ± 21.5 (46.0, 133.0) | 101.8 ± 17.3 (80.0, 132.0) | 0.88 |
| 24-h energy intake (kcal/day) | 2,063 ± 278 (1,529, 2,645) | 2,146 ± 247 (1,658, 2,645) | 1,838 ± 235 (1,529, 2,249) | 0.002 |
| 24-h EE (kcal/day) | 2,036 ± 281 (1,502, 2,575) | 2,116 ± 261 (1,616, 2,575) | 1,822 ± 223 (1,502, 2,290) | 0.003 |
| 24-h EB (kcal/day) | 26.4 ± 69.3 (−117, 169) | 30.5 ± 69.9 (−117, 159) | 15.5 ± 70.1 (−52, 169) | 0.57 |
| Body weight change (kg) | 1.2 ± 4.4 (−6.1, 11.2) | 1.4 ± 4.6 (−6.1, 11.2) | 0.8 ± 4.2 (−5.2, 8.4) | 0.71 |
| Body weight change (%) | 1.5 ± 5.6 (−7.2, 14.1) | 1.8 ± 5.8 (−6.8, 14.1) | 0.8 ± 5.2 (−7.2, 8.6) | 0.63 |
| FM change (kg) | 0.1 ± 3.7 (−9.3, 8.6) | 0.2 ± 4.0 (−9.3, 8.6) | −0.4 ± 2.9 (−4.5, 4.7) | 0.66 |
| FFM change (kg) | 0.7 ± 2.2 (−2.6, 6.6) | 0.7 ± 2.1 (−1.9, 6.6) | 0.8 ± 2.3 (−2.6, 4.1) | 0.96 |
Data are presented as the mean ± SD (minimum, maximum values), unless otherwise indicated. AA, African American; H, Hispanic; NA, Native American; W, white.
*P values are for differences between men and women as determined by Student t test.
†Ethnic differences between sexes were assessed by χ2 test.
24-h EE Response to FST or Overfeeding
Compared with EB, the %EE decreased with FST (−8.5 ± 5.0%; P < 0.001) and increased with overfeeding (Table 2, Fig. 3B). The average percentage increase in 24-h EE during the four overfeeding diets (9.0 ± 4.0%) correlated with the percentage decrease in 24-h EE with FST (r = 0.55, P = 0.001) (Fig. 4A). Individually, the percentage decrease in 24-h EE with FST correlated with the %EE during low-protein overfeeding (r = 0.46, P = 0.006) (Fig. 4B). The percentage increase in 24-h EE during high-carbohydrate overfeeding correlated with the %EE responses to the high-fat, normal-protein (r = 0.53, P = 0.002) and standard overfeeding (r = 0.38, P = 0.02) diets, as well as with the percentage decrease in 24-h EE with FST (r = 0.40, P = 0.02). The mean %EE response to overfeeding (the average of all four diets) was inversely related to the percentage of body fat (r = −0.43, P = 0.008). In a mixed model accounting for repeated measures, adjusting for age, sex, and ethnicity, and including only the four overfeeding diets, diet (P < 0.001) and the percentage of fat (β = −0.12%, P = 0.03) were independent determinants of the %EE.
Table 2.
Extent of 24-h EE responses during eucaloric feeding, 200% overfeeding with diets varying in macronutrient content, and FST
| Diet | 24-h FQ (ratio) | 24-h RQ (ratio) | 24-h EE (kcal/day) | Change in 24-h EE (%) | TEF (%) | 24-h SPA (%) |
|---|---|---|---|---|---|---|
| EB | 0.86 | 0.87 ± 0.03 | 2,036 ± 281 | N/A | 8.4 ± 4.9‡ | 5.4 ± 3.3 |
| FST | 0.71 | 0.79 ± 0.03* | 1,857 ± 224* | −8.5 ± 5.0‡ | N/A | 5.0 ± 3.7 |
| LPF | 0.85 | 0.91 ± 0.05* | 2,093 ± 299* | 2.8 ± 4.9† | 5.7 ± 2.7‡ | 5.7 ± 4.1 |
| SOF | 0.86 | 0.89 ± 0.04* | 2,251 ± 339* | 10.9 ± 5.7‡ | 9.9 ± 3.3‡ | 5.9 ± 3.3 |
| HPF | 0.78 | 0.83 ± 0.04* | 2,186 ± 319* | 8.7 ± 4.9‡ | 8.7 ± 3.0‡ | 5.6 ± 3.7 |
| CNP | 0.93 | 0.94 ± 0.05* | 2,330 ± 321* | 14.4 ± 5.3‡ | 11.8 ± 3.5‡ | 6.5 ± 4.2 |
Data are presented as the mean ± SD, unless otherwise indicated. FQ, food quotient; HPF, high-fat overfeeding; N/A, not applicable; TEF, thermic effect of food. The FQ (i.e., the expected 24-h RQ based on the macronutrients in each diet) was calculated from published equations (6). The %EE was calculated with respect to the 24-h EE during EB. The TEF of each diet was calculated by subtracting the 24-h EE during FST from the 24-h EE during the relevant dietary intervention, and then was expressed as a percentage of the corresponding total caloric intake.
*P < 0.05 by Tukey range test compared with EB.
†P < 0.05 vs. 0.
‡P < 0.0001 vs. 0.
Figure 3.

Macronutrient composition of the dietary interventions (A) and related 24-h EE response (B). Protein, carbohydrate, and fat content of the diets are expressed in grams based on a representative diet for an individual requiring 2,000 kcal for EB and 4,000 kcal for overfeeding (A). The 24-h EE response to each dietary intervention is expressed as the percentage change compared with the 24-h EE measured during EB (B). Error bars represent the mean with SD.
Figure 4.

Inverse relationships between the 24-h EE response to FST and the average change in 24-h EE during overfeeding (A) and during low-protein overfeeding (B). The 24-h EE response to FST and to overfeeding is expressed as the percentage change compared with the 24-h EE measured during EB. The average change in 24-h EE during overfeeding was calculated as the mean value across the four overfeeding diets. The best-fit line is displayed in both panels. Vertical and horizontal lines indicate points with no change in 24-h EE compared with EB.
Determinants of Future Weight Change
Changes in body weight and body composition at follow-up (6.5 ± 0.9 months, range 5.2–9.2 months) are shown in Table 1. The variance in weight change at 6 months was normally distributed (P = 0.44, Shapiro-Wilks test) around a mean increase of 1.2 ± 4.4 kg (range −6.1 to 11.2 kg) without any suspected outliers. There was no difference between sexes or ethnicities in body weight change.
A greater reduction in 24-h EE during FST was associated with weight gain at 6 months (r = −0.35, P = 0.04) (Fig. 5A), and this was still true after adjustment for age, sex, ethnicity, and baseline weight (β = −0.32 kg per 1% difference in 24-h EE response, P = 0.05). Similarly, the %EE response during low-protein overfeeding at baseline was negatively associated with absolute body weight change (r = −0.55, P = 0.001) (Fig. 5B), and this held true after adjustment for age, sex, ethnicity, and baseline weight (β = −0.42 kg per 1% increase in 24-h EE response, P = 0.01). There was no association between the change in body weight and the average %EE during the three overfeeding diets with 20% protein content (r = 0.16, P = 0.35), and the EE responses to standard (r = 0.03, P = 0.86) or high-fat, normal-protein (r = 0.06, P = 0.75) overfeeding were also not associated with weight change. The EE response to high-carbohydrate, normal-protein overfeeding was positively associated with weight change at follow-up (r = 0.33, P = 0.05, β = 0.41 kg per 1% increase in 24-h EE, P = 0.009 adjusted for age, sex, ethnicity, and baseline weight) (Fig. 5C). In a multivariate model, both the 24-h EE responses to low-protein (β = −0.44 kg per 1% difference in 24-h EE response, P = 0.004) and high-carbohydrate, normal-protein (β = 0.38 kg per 1% difference in 24-h EE response, P = 0.003) overfeeding, but not the 24-h EE response to FST (β = −0.15 kg per 1% difference in the 24-h EE response, P = 0.18), were independently associated with weight change at follow-up. Results did not change with serial adjustment for age, sex, ethnicity, or baseline weight. The EE response to FST was only significantly associated with weight change when the 24-h EE response to low-protein overfeeding was removed from the multivariate model.
Figure 5.

Associations between body weight change after 6 months and the 24-h EE responses to overfeeding and FST. Inverse associations between weight change at 6 months after discharge from the CRU and the change in 24-h EE with FST (A) and during low-protein overfeeding (B). C: Positive relationship between the increase of 24-h EE with high-carbohydrate overfeeding and weight change (two high-carbohydrate diets were excluded as <95% of the food was consumed). D: Inverse relationship between RQ during 24 h of FST and weight change. The mean follow-up time was 6.5 ± 0.9 months with a weight change of 1.2 ± 4.2 kg (range −6.1 to 11.2 kg). No point met the statistical criteria to be an outlier. All associations were still significant (P < 0.05) when excluding the subjects with the greatest weight change. The results for weight change, expressed as a percentage of the baseline weight, are as follows: %EE response to FST (r = −0.36, P = 0.03), low-protein overfeeding (r = −0.51, P = 0.007), high-carbohydrate overfeeding (r = 0.34, P = 0.05), and RQ during FST (r = −0.44, P = 0.006).
To further illustrate the independent effects of the EE response to low-protein and high-carbohydrate overfeeding on weight change, we categorized subjects in four subgroups according to the median %EE during these two overfeeding diets (Fig. 6). Subjects with a higher-than-median EE response during high-carbohydrate overfeeding and a lower-than-median EE response during low-protein overfeeding (n = 7) gained more weight compared with those with the opposing EE responses (n = 6) (mean difference 7% increase in their baseline weight, P = 0.007), despite similar baseline body weight (P = 0.80). The 24-h EE response to low-protein overfeeding was associated with changes in both FM (r = −0.48, P = 0.004) and FFM (r = −0.36, P = 0.04) at 6 months; however, the EE response to high-carbohydrate overfeeding was associated only with the FM change (r = 0.37, P = 0.04), but not with the FFM change (P = 0.6).
Figure 6.

Phenotypes of 6-month weight change based on the 24-h EE responses to low-protein and high-carbohydrate overfeeding. Subjects were categorized into four subgroups according to the median %EE during low-protein and high-carbohydrate, normal-protein overfeeding (two high-carbohydrate diets were excluded as <95% of the food was consumed). Subjects with a lower-than-median EE response during low-protein overfeeding and a higher-than-median response during high-carbohydrate, normal-protein overfeeding gained more weight compared with those with the opposing EE responses (mean difference 7% increase in their baseline weight, P = 0.007). The mean follow-up time was 6.5 ± 0.9 months, with a weight change of 1.2 ± 4.2 kg (range −6.1 to 11.2 kg).
The 24-h RQ during FST (r = −0.41, P = 0.01), but not during any overfeeding diet (all P > 0.2), was negatively associated with weight change (Fig. 5D), and this was still true after adjustment for age, sex, ethnicity, and baseline weight (β = −0.56 kg per 0.01 change in FST RQ, P = 0.01). The FST RQ was associated with the FFM change at 6 months (r = −0.34, P = 0.05), but not with the change in FM (r = −0.26, P = 0.14). There was no association between the 24-h RQ and either the %EE (P = 0.14) or the absolute 24-h EE (P = 0.23) during FST. Neither the EE response to low-protein overfeeding diet nor the response to the high-carbohydrate overfeeding diet was correlated with the FST RQ. In a full model including all observed associations with weight change, only the percentage changes in 24-h EE during low-protein overfeeding (β = −0.46, P = 0.002) and high-carbohydrate overfeeding (β = 0.39, P = 0.006) remained independent predictors of weight change at 6 months. All results were similar if the data set was limited to men only. All longitudinal results were similar, and often slightly stronger, if the percentage weight change from baseline weight was substituted for the absolute weight change (data not shown).
Discussion
Our results confirm that humans have the ability to respond to overfeeding and FST with an increase and a decrease in EE, respectively, and that these responses are directly correlated. At baseline, body adiposity was inversely related to the EE response to overfeeding. Individually, four variables related to FST and overfeeding, including a greater decrease in EE with FST, a smaller response to low-protein overfeeding, a greater EE response to high-carbohydrate overfeeding, and a lower FST RQ, were associated with weight gain at 6 months in free-living adults who were eating an ad libitum diet. However, only two independent phenotypes associated with future weight gain emerged, including a more energy-conserving response to low-protein feeding, during both calorie deficit and caloric excess, and separately, a larger EE response to high-carbohydrate overfeeding.
It is well recognized that EE increases with overfeeding and decreases with FST (5,6,17). In a prior cross-sectional study (5), these responses to overfeeding and FST were correlated within individuals, implying the possibility of “thrifty” and “spendthrift” phenotypes within the population. Recent work from our group (18) found that obese individuals with a more thrifty phenotype, defined by the %EE response to FST, lost less weight in a carefully controlled inpatient weight loss study with 6 weeks of 50% caloric restriction. We have now confirmed that these %EE responses are correlated, and have shown that it is not so much the response to caloric restriction but, rather, the response to protein restriction that defines a thrifty phenotype. Consistent with the finding that more thrifty individuals lose less weight during caloric restriction (18), we observed that free-living individuals with a thrifty phenotype are more likely to gain weight over time. Contrary to expectations, a greater EE response to overconsuming large amounts of carbohydrates, an effect that might be expected to attenuate weight change, was associated with weight gain. Our study differs from many prior studies that have assessed the impact of long-term underfeeding (19–22) or overfeeding (8,17,23–25) with specific diets, in that we were assessing differences in baseline physiology and how such interindividual differences might interact with typical dietary patterns to influence weight change.
It is known from studies such as the Minnesota experiment and the Biosphere 2 project that prolonged energy restriction leads to adaptive reductions in EE (5,19–21). Of note, the diets in both of these studies also had a relatively low proportion of protein (<12%). A more recent study investigating the effects of long-term overconsumption of low-, normal-, and high-protein diets (8) found that FM gain was similar in all three groups, although low-protein diets led to smaller changes in overall weight due to differences in FFM. In our study, both a larger reduction in EE with FST and a smaller EE response to the low-protein diet despite caloric excess were associated with future weight gain. These responses were correlated, and, in a multivariate model, only the low-protein response remained associated with weight change, indicating a potential similar underlying physiology. A candidate pathway that might explain these findings is the hepatic response to amino acid deprivation that leads to secretion of fibroblast growth factor 21 (FGF21) (26,27). Although FGF21 was originally reported to increase with FST (28–30), a recent study (27) has demonstrated that it is protein restriction, not caloric restriction, that induces increases in circulating FGF21 levels in rodents and in humans. This study (27) also found that FGF21 is required for the EE response to low protein. We observed that the low-protein diet led to the smallest increases, and even decreases, in EE with overfeeding. Other studies (17,24,27) have reported that long-term overfeeding is required for any increased, potentially adaptive, EE response to a low-protein diet. As the sustained intake of a low-protein diet would be unusual in modern society (31), our results may reflect that those individuals able to increase EE more quickly during even short periods of protein restriction are better able to prevent weight gain.
The increase in EE with overfeeding was greatest with the high-carbohydrate diet, but, surprisingly, a larger EE increase with this diet was associated with more weight gain. The underlying physiology behind the larger increase in EE with carbohydrate intake is unknown and may be related to genetic differences, alterations induced by prior dietary choices (i.e., a long-term high-carbohydrate diet prior to CRU admission), or a robust inflammatory response to carbohydrates (32). When subjects are fed an isocaloric high-carbohydrate diet for 2 weeks, those individuals who are more likely to store carbohydrates, rather than oxidize them, gain less FM over time (33), and we may be observing a similar phenotype. Alternatively, a high-carbohydrate meal has been reported to increase brown adipose tissue activity (10), which would lead to increased EE. As a higher EE during EB has been associated with greater subsequent ad libitum food intake (34,35), the availability of high-carbohydrate foods in a free-living condition may increase EE and subsequently drive further energy intake in the absence of dietary restraint.
FST RQ was no longer associated with weight change after accounting for the EE responses to low-protein and high-carbohydrate overfeeding. Thus, the initial simple correlation may be due to confounding or may indicate similar, overlapping physiologic mechanisms with the overfeeding results. The association of greater lipid oxidation with FST (i.e., a lower RQ) with future weight gain might suggest that a greater reliance on lipid stores during energy restriction is involved in body weight regulation. This finding may be consistent with a phenotype that preferentially oxidizes rather than stores carbohydrates (33), as the increased lipid oxidation during FST may reflect smaller amounts of glycogen stores. The previously reported associations of higher carbohydrate oxidation during EB with both subsequent increased food intake (36) as well as weight gain (36,37) are further evidence that phenotypic differences that indicate a preference to oxidize, rather than store, ingested carbohydrates are related to weight gain.
A limitation of our study is the lack of hormonal measures that might explain the underlying mechanisms of the EE changes. Nevertheless, prior results from a subset of these subjects (6) demonstrated that catecholamine responses were similar for both FST and the low-protein diet. Additional long-term follow-up is needed to determine whether the baseline measures of EE are associated with weight changes over longer periods of time (38–41). Subjects were asked to resume their previous lifestyle upon CRU discharge, and none of the subjects reported substantially changing their diet in the intervening period; however, formal assessments of diet or physical exercise during the follow-up period were not performed. This was purposeful, as we wanted to examine the relationship of baseline EE physiology with spontaneous short-term weight change under free-living, unencumbered conditions. In addition, it is possible that the level of physical fitness prior to CRU admission may have contributed to the EE response to overfeeding; however, all subjects were admitted to the CRU at the time of the initial assessment and had similar levels of physical activity during the inpatient stay. Further, adjusting for SPA in our analyses did not impact the results. Although the study includes a small proportion of lean women relative to women classified as obese, all results were similar if the data set was limited only to men. Even in this relatively small study group, we were able to identify subjects with differing phenotypes defined by their EE response to low-protein and high-carbohydrate overfeeding, and people with these phenotypes had substantially different changes in body weight at follow-up. Nevertheless, future studies with larger study populations are warranted to replicate and confirm our results.
In summary, we identified a number of metabolic phenotypes correlated with subsequent weight change that condensed into two independent phenotypes: a smaller EE response to low-protein intake and a greater EE increase with high-carbohydrate intake. Based on these results, it is reasonable to hypothesize that the observed interindividual variation in the EE response to protein restriction constitutes the long-sought, but previously unidentified, “thrifty phenotype” that accounts, in part, for the observed interindividual variation in weight loss during similarly calorically restricted diets. Further, the interindividual variation in the EE responses to high-carbohydrate intake may account, in part, for the utility that some individuals find in eating a carbohydrate-restricted diet to limit weight gain. To conclude, an increased understanding of the phenotypic differences between people in response to overeating or undereating may lead to new strategies to prevent weight gain.
Article Information
Acknowledgments. The authors thank the nursing and dietary staff of the Clinical Research Unit of the National Institute of Diabetes and Digestive and Kidney Disease in Phoenix, AZ, for their help in the care of the volunteers. The authors also thank Clifton Bogardus, MD (Phoenix Epidemiology and Clinical Research Branch, National Institute of Diabetes and Digestive and Kidney Diseases/National Institutes of Health), for his advice and critical reading of the manuscript. Most of all, the authors thank the volunteers for their participation in the study.
Funding. This work was supported by the Intramural Research Program of the National Institutes of Health, National Institute of Diabetes and Digestive and Kidney Diseases.
Duality of Interest. No potential conflicts of interest relevant to this article were reported.
Author Contributions. M.S. performed data collection and analysis and wrote the manuscript. P.P. performed data analysis and revised the manuscript. N.P. designed the study, wrote the initial clinical protocol when he was employed at the National Institute of Diabetes and Digestive and Kidney Diseases-Phoenix in 2006, and reviewed the manuscript. S.M.B. designed the study, performed data collection, and reviewed the manuscript. J.K. designed the study and reviewed the manuscript. M.S.T. designed the study, performed data collection and analysis, and wrote the manuscript. M.S. and P.P. are the guarantors of this work and, as such, had full access to all the data in the study and take responsibility for the integrity of the data and the accuracy of the data analysis.
Prior Presentation. Parts of this study were presented in abstract form at the 2014 Obesity Society’s Annual Scientific Meeting, Boston, MA, 2–7 November 2014.
Footnotes
Clinical trial reg. no. NCT00342732, clinicaltrials.gov.
References
- 1.Dériaz O, Fournier G, Tremblay A, Després JP, Bouchard C. Lean-body-mass composition and resting energy expenditure before and after long-term overfeeding. Am J Clin Nutr 1992;56:840–847 [DOI] [PubMed] [Google Scholar]
- 2.Dulloo AG, Jacquet J. Low-protein overfeeding: a tool to unmask susceptibility to obesity in humans. Int J Obes Relat Metab Disord 1999;23:1118–1121 [DOI] [PubMed] [Google Scholar]
- 3.Klein S, Goran M. Energy metabolism in response to overfeeding in young adult men. Metabolism 1993;42:1201–1205 [DOI] [PubMed] [Google Scholar]
- 4.Ravussin E, Schutz Y, Acheson KJ, Dusmet M, Bourquin L, Jéquier E. Short-term, mixed-diet overfeeding in man: no evidence for “luxuskonsumption”. Am J Physiol 1985;249:E470–E477 [DOI] [PubMed] [Google Scholar]
- 5.Weyer C, Vozarova B, Ravussin E, Tataranni PA. Changes in energy metabolism in response to 48 h of overfeeding and fasting in Caucasians and Pima Indians. Int J Obes Relat Metab Disord 2001;25:593–600 [DOI] [PubMed] [Google Scholar]
- 6.Thearle MS, Pannacciulli N, Bonfiglio S, Pacak K, Krakoff J. Extent and determinants of thermogenic responses to 24 hours of fasting, energy balance, and five different overfeeding diets in humans. J Clin Endocrinol Metab 2013;98:2791–2799 [DOI] [PMC free article] [PubMed] [Google Scholar]
- 7.Stock MJ. Gluttony and thermogenesis revisited. J Obes Relat Metab Disord 1999;23:1105–1117 [DOI] [PubMed] [Google Scholar]
- 8.Bray GA, Smith SR, de Jonge L, et al. Effect of dietary protein content on weight gain, energy expenditure, and body composition during overeating: a randomized controlled trial. JAMA 2012;307:47–55 [DOI] [PMC free article] [PubMed] [Google Scholar]
- 9.Schwartz RS, Ravussin E, Massari M, O’Connell M, Robbins DC. The thermic effect of carbohydrate versus fat feeding in man. Metabolism 1985;34:285–293 [DOI] [PubMed] [Google Scholar]
- 10.Vosselman MJ, Brans B, van der Lans AA, et al. Brown adipose tissue activity after a high-calorie meal in humans. Am J Clin Nutr 2013;98:57–64 [DOI] [PubMed] [Google Scholar]
- 11.Ferraro R, Boyce VL, Swinburn B, De Gregorio M, Ravussin E. Energy cost of physical activity on a metabolic ward in relationship to obesity. Am J Clin Nutr 1991;53:1368–1371 [DOI] [PubMed] [Google Scholar]
- 12.American Diabetes Association . Diagnosis and classification of diabetes mellitus. Diabetes Care 2013;36(Suppl. 1):S67–S74 [DOI] [PMC free article] [PubMed] [Google Scholar]
- 13.Abbott WG, Howard BV, Christin L, et al. Short-term energy balance: relationship with protein, carbohydrate, and fat balances. Am J Physiol 1988;255:E332–E337 [DOI] [PubMed] [Google Scholar]
- 14.Grubbs FE. Procedures for detecting outlying observations in samples. Technometrics 1969;11:1–21 [Google Scholar]
- 15.Tukey JW. Exploratory Data Analysis. Reading, MA, Addison-Wesley, 1977, p. 231–232 [Google Scholar]
- 16.Rosner B. Percentage points for a generalized ESD many-outlier procedure. Technometrics 1983;25:165–172 [Google Scholar]
- 17.Miller DS, Mumford P, Stock MJ. Gluttony. 2. Thermogenesis in overeating man. Am J Clin Nutr 1967;20:1223–1229 [DOI] [PubMed] [Google Scholar]
- 18.Reinhardt M, Thearle MS, Ibrahim M, et al. A human thrifty phenotype associated with less weight loss during caloric restriction. Diabetes. 11 May 2015. [Epub ahead of print]. DOI: 10.2337/db14-1881 [DOI] [PMC free article] [PubMed] [Google Scholar]
- 19.Grande F, Anderson JT, Keys A. Changes of basal metabolic rate in man in semistarvation and refeeding. J Appl Physiol 1958;12:230–238 [DOI] [PubMed] [Google Scholar]
- 20.Taylor HL, Keys A. Adaptation to caloric restriction. Science 1950;112:215–218 [DOI] [PubMed] [Google Scholar]
- 21.Walford RL, Harris SB, Gunion MW. The calorically restricted low-fat nutrient-dense diet in Biosphere 2 significantly lowers blood glucose, total leukocyte count, cholesterol, and blood pressure in humans. Proc Natl Acad Sci USA 1992;89:11533–11537 [DOI] [PMC free article] [PubMed] [Google Scholar]
- 22.Weyer C, Walford RL, Harper IT, et al. Energy metabolism after 2 y of energy restriction: the biosphere 2 experiment. Am J Clin Nutr 2000;72:946–953 [DOI] [PubMed] [Google Scholar]
- 23.Aparecida de França S, Dos Santos MP, Garófalo MA, et al. Low protein diet changes the energetic balance and sympathetic activity in brown adipose tissue of growing rats. Nutrition 2009;25:1186–1192 [DOI] [PubMed] [Google Scholar]
- 24.Miller DS, Mumford P. Gluttony. 1. An experimental study of overeating low- or high-protein diets. Am J Clin Nutr 1967;20:1212–1222 [DOI] [PubMed] [Google Scholar]
- 25.Schmidt SL, Kealey EH, Horton TJ, VonKaenel S, Bessesen DH. The effects of short-term overfeeding on energy expenditure and nutrient oxidation in obesity-prone and obesity-resistant individuals. Int J Obes (Lond) 2013;37:1192–1197 [DOI] [PMC free article] [PubMed] [Google Scholar]
- 26.Anthony TG, McDaniel BJ, Byerley RL, et al. Preservation of liver protein synthesis during dietary leucine deprivation occurs at the expense of skeletal muscle mass in mice deleted for eIF2 kinase GCN2. J Biol Chem 2004;279:36553–36561 [DOI] [PubMed] [Google Scholar]
- 27.Laeger T, Henagan TM, Albarado DC, et al. FGF21 is an endocrine signal of protein restriction. J Clin Invest 2014;124:3913–3922 [DOI] [PMC free article] [PubMed] [Google Scholar]
- 28.Gälman C, Lundåsen T, Kharitonenkov A, et al. The circulating metabolic regulator FGF21 is induced by prolonged fasting and PPARalpha activation in man. Cell Metab 2008;8:169–174 [DOI] [PubMed] [Google Scholar]
- 29.Inagaki T, Dutchak P, Zhao G, et al. Endocrine regulation of the fasting response by PPARalpha-mediated induction of fibroblast growth factor 21. Cell Metab 2007;5:415–425 [DOI] [PubMed] [Google Scholar]
- 30.Reitman ML. FGF21: a missing link in the biology of fasting. Cell Metab 2007;5:405–407 [DOI] [PubMed] [Google Scholar]
- 31.Hankinson AL, Daviglus ML, Van Horn L, et al. Diet composition and activity level of at risk and metabolically healthy obese American adults. Obesity (Silver Spring) 2013;21:637–643 [DOI] [PMC free article] [PubMed] [Google Scholar]
- 32.Buyken AE, Goletzke J, Joslowski G, et al. Association between carbohydrate quality and inflammatory markers: systematic review of observational and interventional studies. Am J Clin Nutr 2014;99:813–833 [DOI] [PubMed] [Google Scholar]
- 33.Eckel RH, Hernandez TL, Bell ML, et al. Carbohydrate balance predicts weight and fat gain in adults. Am J Clin Nutr 2006;83:803–808 [DOI] [PubMed] [Google Scholar]
- 34.Blundell JE, Caudwell P, Gibbons C, et al. Body composition and appetite: fat-free mass (but not fat mass or BMI) is positively associated with self-determined meal size and daily energy intake in humans. Br J Nutr 2012;107:445–449 [DOI] [PubMed] [Google Scholar]
- 35.Weise CM, Hohenadel MG, Krakoff J, Votruba SB. Body composition and energy expenditure predict ad-libitum food and macronutrient intake in humans. Int J Obes (Lond) 2014;38:243–251 [DOI] [PMC free article] [PubMed] [Google Scholar]
- 36.Pannacciulli N, Salbe AD, Ortega E, Venti CA, Bogardus C, Krakoff J. The 24-h carbohydrate oxidation rate in a human respiratory chamber predicts ad libitum food intake. Am J Clin Nutr 2007;86:625–632 [DOI] [PMC free article] [PubMed] [Google Scholar]
- 37.Zurlo F, Lillioja S, Esposito-Del Puente A, et al. Low ratio of fat to carbohydrate oxidation as predictor of weight gain: study of 24-h RQ. Am J Physiol 1990;259:E650–E657 [DOI] [PubMed] [Google Scholar]
- 38.Piaggi P, Krakoff J, Bogardus C, Thearle MS. Lower “awake and fed thermogenesis” predicts future weight gain in subjects with abdominal adiposity. Diabetes 2013;62:4043–4051 [DOI] [PMC free article] [PubMed] [Google Scholar]
- 39.Piaggi P, Thearle MS, Bogardus C, Krakoff J. Lower energy expenditure predicts long-term increases in weight and fat mass. J Clin Endocrinol Metab 2013;98:E703–E707 [DOI] [PMC free article] [PubMed] [Google Scholar]
- 40.Luke A, Durazo-Arvizu R, Cao G, Adeyemo A, Tayo B, Cooper R. Positive association between resting energy expenditure and weight gain in a lean adult population. Am J Clin Nutr 2006;83:1076–1081 [DOI] [PubMed] [Google Scholar]
- 41.Piaggi P, Thearle MS, Bogardus C, Krakoff J. Fasting hyperglycemia predicts lower rates of weight gain by increased energy expenditure and fat oxidation rate. J Clin Endocrinol Metab 2015;100:1078–1087 [DOI] [PMC free article] [PubMed] [Google Scholar]