

Abstract
Quantitative RT-PCR is often used as a research tool directed at gene transcription. Selection of optimal housekeeping genes (HKGs) as reference genes is critical to establishing sensitive and reproducible qRT-PCR-based assays. The current study was designed to identify the appropriate reference genes in blood leukocytes of bottlenose dolphins (Tursiops truncatus) for gene transcription research. Seventy-five blood samples collected from 7 bottlenose dolphins were used to analyze 15 candidate HKGs (ACTB, B2M, GAPDH, HPRT1, LDHB, PGK1, RPL4, RPL8, RPL18, RPS9, RPS18, TFRC, YWHAZ, LDHA, SDHA). HKG stability in qRT-PCR was determined using geNorm, NormFinder, BestKeeper and comparative delta Ct algorithms. Utilization of RefFinder, which combined all 4 algorithms, suggested that PGK1, HPRT1 and RPL4 were the most stable HKGs in bottlenose dolphin blood. Gene transcription perturbations in blood can serve as an indication of health status in cetaceans as it occurs prior to alterations in hematology and chemistry. This study identified HKGs that could be used in gene transcript studies, which may contribute to further mRNA relative quantification research in the peripheral blood leukocytes in captive cetaceans.
Quantitative reverse transcription PCR (qRT-PCR) represents a rapid and reliable method for the detection and quantification of mRNA transcripts of a selected gene of interest (GOI) and is well suited to study biological processes, many of which can have practical clinical applications1. When only a small number of cells are available and the number of GOIs is limited, qRT-PCR provides the simultaneous measurement of gene transcripts in many different samples2. Furthermore, this method becomes the only technique that can detect small number of mRNA copies since expression level for some genes is often low1. Such an approach is especially attractive for measuring gene transcript levels in species for which reagents for protein detection and bioassay are not readily available. Relative quantification in qRT-PCR can determine the transcript level change in given samples relative to another control sample. This technique is dependent upon the use of an internal control gene for normalization, which controls multiple variables such as RNA integrity, cDNA concentration, enzymatic efficiencies, and transcriptional activity differences between tissues3. The use of appropriate controls in the data normalization step is essential for accurate comparison of mRNA measurements between different samples4.
Housekeeping genes (HKGs), which are involved in basic metabolism and maintenance of the cell, are commonly recognized as reference genes used to normalize qRT-PCR. An ideal reference gene should present stable transcript levels when exposed to the same experimental protocol of the GOI. However, some of the most commonly used HKGs display significantly different transcript levels in various tissues and cannot always serve as reliable controls (reviewed in5,6). Thus, conducting preliminary evaluations for identifying stable HKGs for a qRT-PCR assay in a given species and tissue is desirable.
Cetacean species share key immunologic components with those previously defined in lab animals and humans7. Recent years have seen increased attention being given to cetacean immunology due to the important value of the animals under human care and the significant susceptibility to environmental degradation in free-ranging species serving as sentinels of ecosystem health8. Immune gene transcript assessment has potential to be an important approach to evaluate cetacean health. Cetacean gene transcripts have been the subject of quantitative analysis in multiple tissues and species. These studies have been based upon qRT-PCR using a variety of different HKGs, including ribosomal protein L8 (RPL8) in killer whale (Orcinus orca) skin biopsies9, glyceraldehyde 3-phosphate dehydrogenase (GAPDH) and tyrosin 3-monooxygenase/tryptophan 5-monooxygenase activation protein zeta (YWHAZ) in harbor porpoise (Phocoena phocoena) blood samples10,11,12, GAPDH in bottlenose dolphin (Tursiops truncatus) blood samples13, and RPS9 in blood samples in bottlenose dolphins, beluga whales (Delphinapterus leucas), and Pacific white-sided dolphins (Lagenorhynchus obliquidens)8,14. These HKGs were selected based upon their supposedly equal transcript levels in certain tissues derived from different sample groups. Alterations in reference gene transcript levels induced by varying experimental conditions or other factors have the potential to compromise detection of small perturbations resulting in poor sensitivity15. Comprehensive evaluations of cetacean reference genes are limited. Spinsanti et al.5 tested 10 HKGs for the selection of reference genes in qRT-PCR studies directed at striped dolphin (Stenella coeruleoalba) skin biopsies, and determined that YWHAZ and GAPDH were superior reference genes. The same 10 HKGs were tested in transcript analysis of striped dolphin fibroblast cultures exposed to organochlorines (OCs), polybrominated diphenyl ethers (PBDEs) and 17β-estradiol16. Data from that study suggested that three different pairs of HKGs should be used to normalize qRT-PCR data: YWHAZ and RPS18 for 17β-estradiol, succinate dehydrogenase complex subunit A (SDHA) and YWHAZ for OCs, and GAPDH and YWHAZ for PBDEs. Another reference gene transcript study employing skin biopsies from blue whale (Balaenoptera musculus), fin whales (Balaenoptera physalus) and sperm whales (Physeter macrocephalus) demonstrated HKGs encoding RPL4 and RPS18 were the most suitable controls followed by genes encoding phosphoglycerate kinase (PGK1) and SDHA17. Such studies demonstrated the importance of preliminary selection of optimal HKGs for studies with different purposes and target tissues.
This project investigated the suitability of 15 HKGs for normalization of qRT-PCR data derived from whole blood samples of bottlenose dolphin, which is one of the most commonly displayed cetacean species in aquaria worldwide. Besides 12 HKGs have been evaluated or used in previous studies5,8,9,10,11,12,13,14,16,17, we also included the other 3 genes that could participate in other different cell functions18,19 (Table 1). Acquisition of such data is central to our long-term goal of applying qRT-PCR in multidisciplinary immune assessments of captive and free-ranging cetacean species.
Table 1. Function, symbol and name of HKGs in this study.
| Function | Gene | Name |
|---|---|---|
| Carbohydrate | GAPDH | Glyceraldehyde-3-phosphate dehydrogenase |
| Metabolism | PGK1 | Phosphoglycerate kinase 1 |
| LDHA | Lactate dehydrogenase A | |
| LDHB | Lactate dehydrogenase B | |
| Ribosomal Protein | RPS9 | Ribosomal protein S9 |
| RPL4 | Ribosomal protein L4 | |
| RPL8 | Ribosomal protein L8 | |
| RPL18 | Ribosomal protein L18 | |
| RPS18 | Ribosomal protein S18 | |
| MHC | B2M | β-2-microglobin |
| Transporter | TFRC | Transferrin receptor |
| Cytoskeleton | ACTB | β-actin |
| Citric Acid Cycle | SDHA | Succinate dehydrogenase subunit A |
| Signal | YWHAZ | Tyrosine 3-monooxygenase/tryptophan 5-monooxygenase activation protein zeta |
| Others | HPRT1 | Hypoxantine phosphoribosyltransferase 1 |
Results
Amplification efficiency and transcript levels of candidate HKGs
Amplification efficiency (E) values for the 15 candidate HKGs ranged from 95.19% and 102.29% with R2 values being >0.99 (Table 2); therefore all 15 HKGs were included in the analysis of reference gene suitability. Figure 1 illustrated the variable transcript levels in the 15 HKGs with the lowest mean Cq values (21.06) in ACTB, and the highest (32.14) in SDHA. Transcript levels were used to establish two arbitrary categories: those that were highly transcribed (mean Cq values <25 cycles) including ACTB, B2M, GAPDH, RPL4, RPL8, RPL18, RPS18, and RPS9, and those with lower transcript levels (mean Cq values >25 cycles) including HPRT1, LDHA, LDHB, PGK1, SDHA, TFRC and YWHAZ. All HKGs showed a small difference (<5 cycles) between the maximum and minimum Cq values.
Table 2. Name, accession number, primer sequence, probe number, amplicon size, efficiency and R2 of 15 candidate HKGs.
| HKG Name | Accession Number | Primer Sequence (5′-3′) | UPL Probe Number | Amplicon Size (bp) | Threshold | Efficiency (%) ± SD | R2 |
|---|---|---|---|---|---|---|---|
| ACTB | AB603937.1 | F-AGGACCTCTATGCCAACACG | 157 | 75 | 0.020 | 97.97 ± 0.668 | 1.000 |
| R-CCTTCTGCATCCTGTCAGC | |||||||
| B2M | DQ404542.1 | F-GGTGGAGCAATCAGACCTGT | 93 | 78 | 0.035 | 95.19 ± 0.056 | 0.998 |
| R-GCGTTGGGAGTGAACTCAG | |||||||
| GAPDH | DQ404538.1 | F-CACCTCAAGATCGTCAGCAA | 119 | 81 | 0.020 | 97.73 ± 0.186 | 0.999 |
| R-GCCGAAGTGGTCATGGAT | |||||||
| HPRT1 | DQ533610.1 | F-GTGGCCCTCTGTGTGCTC | 120 | 81 | 0.012 | 96.95 ± 1.441 | 0.996 |
| R-ACTATTTCTGTTCAGTGCTTTGATGT | |||||||
| LDHA | AB477023.1 | F-TCCACCATGATTAAGGGTTTG | 123 | 97 | 0.020 | 97.70 ± 1.782 | 0.999 |
| R-CTTTCACAACATCTGAGATTCCA | |||||||
| LDHB | AB477024.1 | F-TCGGGGGTTAACCAGTGTT | 161 | 78 | 0.005 | 99.94 ± 1.757 | 0.993 |
| R-AGGGTGTCTGCACTTTTCTTG | |||||||
| PGK1 | DQ533611.1 | F-CACTGTGGCCTCTGGCATA | 108 | 84 | 0.015 | 97.41 ± 0.824 | 0.999 |
| R-GCAACAGCCTCAGCATACTTC | |||||||
| RPL4 | DQ404536.1 | F-CAGCGCTGGTCATGTCTAAA | 119 | 108 | 0.035 | 97.24 ± 0.831 | 1.000 |
| R-GCAAAACAGCCTCCTTGGT | |||||||
| RPL8 | GQ141092.1 | F-CCATGAATCCTGTGGAGCAT | 131 | 65 | 0.020 | 102.29 ± 2.102 | 1.000 |
| R-GGTAGAGGGTTTGCCGATG | |||||||
| RPL18 | DQ403041.1 | F-GCAAGATCCTCACCTTCGAC | 93 | 104 | 0.020 | 98.04 ± 1.608 | 0.999 |
| R-GAAATGCCTGTACACCTCTCG | |||||||
| RPS9 | EU638307.1 | F-CTGACGCTGGATGAGAAAGAC | 155 | 77 | 0.020 | 99.43 ± 0.918 | 1.000 |
| R-ACCCCGATACGGACGAGT | |||||||
| RPS18 | DQ404537 | F-GTACGAGGCCAGCACACC | 114 | 90 | 0.020 | 98.98 ± 0.493 | 0.999 |
| R-TAACAGACAACGCCCACAAA | |||||||
| SDHA | DQ404540.1 | F-CGTATCCCGCTCCATGAC | 144 | 73 | 0.012 | 101.70 ± 3.729 | 0.994 |
| R-CAGGTACACGTGATCCTTCTCA | |||||||
| TFRC | DQ404541.1 | F- TTTAAACCCAGCAGGAGCAT | 140 | 69 | 0.020 | 95.36 ± 0.172 | 0.999 |
| R- AGTGGCACCAATAGCTCCAA | |||||||
| YWHAZ | DQ404539 | F-TCTCTTGCAAAAACGGCATT | 135 | 76 | 0.003 | 99.92 ± 2.681 | 0.995 |
| R-TGCTGTCTTTGTATGACTCTTCACT |
Figure 1. Transcript levels of candidate HKGs derived from blood samples of bottlenose dolphins (Tursiops truncatus) (n = 75).
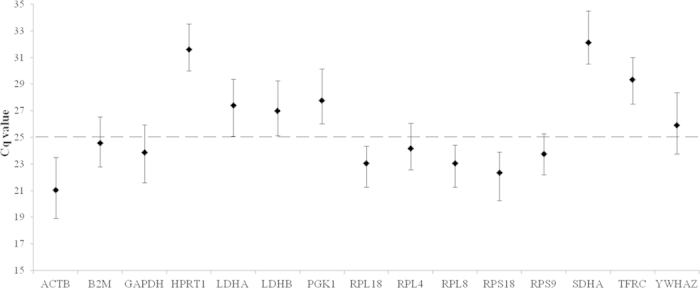
Values are given as qPCR cycle threshold numbers (Cq values). Dots represent mean Cq values and whiskers the range of Cq values in the 75 samples.
Gene transcript stability in 75-sample group
The geNorm algorithm demonstrated good stability of all tested HKGs (Table 3). M values, average pair-wise variation of a given gene with all other control genes, were lower (0.178–0.682) than the program’s default limit of 1.5. RPL18 and RPS18 were the most stable genes followed by RPL8, RPL4, and RPS9. The optimal number of reference genes for normalization was established using pairwise variation values (V) between two sequential normalization factors while employing an increasing number of genes. The optimal number was determined to be less than 3 based upon V2/3 value of 0.084 (<0.15 is the default cut-off) (Fig. 2A), indicating that the addition of one more HKG would not significantly improve reliability. NormFinder analysis identified HPRT1 as having the best stability (0.357) followed by RPL4 (0.390) and PGK1 (0.408) (Table 3). BestKeeper analysis determined the SDCq value of all HKGs (0.540–0.783) were <1 indicating these genes were basically stably expressed. The three most stable genes, according to their SDCq value,were RPL4, TFRC and RPS9 (Table 3). The best choice in comparative ΔCt method was PGK1, HPRT1 and RPL4. RefFinder identified RPL4, HPRT1 and PGK1 as being superior (Table 3, Fig. 3A).
Table 3. Results of stability among 15 candidate genes computed by 4 algorithms using 75 bottlenose dolphin blood samples.
| HKGs | Comprehensive Ranking |
Delta CT |
BestKeeper |
NormFinder |
geNorm |
|||||
|---|---|---|---|---|---|---|---|---|---|---|
| Geomean of Ranking Value | Rank | Average of SD | Rank | SD | Rank | Stability value | Rank | M value | Rank | |
| RPL4 | 2.21 | 1 | 0.621 | 3 | 0.540 | 1 | 0.390 | 2 | 0.300 | 4 |
| HPRT1 | 2.89 | 2 | 0.616 | 2 | 0.608 | 5 | 0.357 | 1 | 0.515 | 7 |
| PGK1 | 3.83 | 3 | 0.612 | 1 | 0.664 | 9 | 0.408 | 3 | 0.572 | 8 |
| RPL18 | 5.07 | 4 | 0.682 | 10 | 0.626 | 6 | 0.536 | 11 | 0.178 | 1 |
| RPS18 | 5.18 | 5 | 0.676 | 8 | 0.667 | 10 | 0.520 | 9 | 0.178 | 1 |
| RPS9 | 5.21 | 6 | 0.675 | 7 | 0.579 | 3 | 0.492 | 7 | 0.334 | 5 |
| B2M | 5.42 | 7 | 0.678 | 9 | 0.604 | 4 | 0.452 | 4 | 0.440 | 6 |
| ACTB | 6.82 | 8 | 0.636 | 4 | 0.738 | 12 | 0.460 | 5 | 0.606 | 9 |
| RPL8 | 7.50 | 9 | 0.700 | 11 | 0.635 | 8 | 0.558 | 12 | 0.237 | 3 |
| GAPDH | 7.58 | 10 | 0.668 | 5 | 0.717 | 11 | 0.490 | 6 | 0.621 | 10 |
| TFRC | 8.61 | 11 | 0.766 | 14 | 0.558 | 2 | 0.597 | 14 | 0.665 | 14 |
| LDHA | 9.10 | 12 | 0.674 | 6 | 0.739 | 13 | 0.520 | 8 | 0.630 | 11 |
| LDHB | 10.43 | 13 | 0.722 | 13 | 0.628 | 7 | 0.522 | 10 | 0.649 | 13 |
| YWHAZ | 12.94 | 14 | 0.715 | 12 | 0.783 | 15 | 0.571 | 13 | 0.638 | 12 |
| SDHA | 14.74 | 15 | 0.796 | 15 | 0.748 | 14 | 0.641 | 15 | 0.682 | 15 |
Figure 2. Pairwise variations generated by geNorm algorithm.
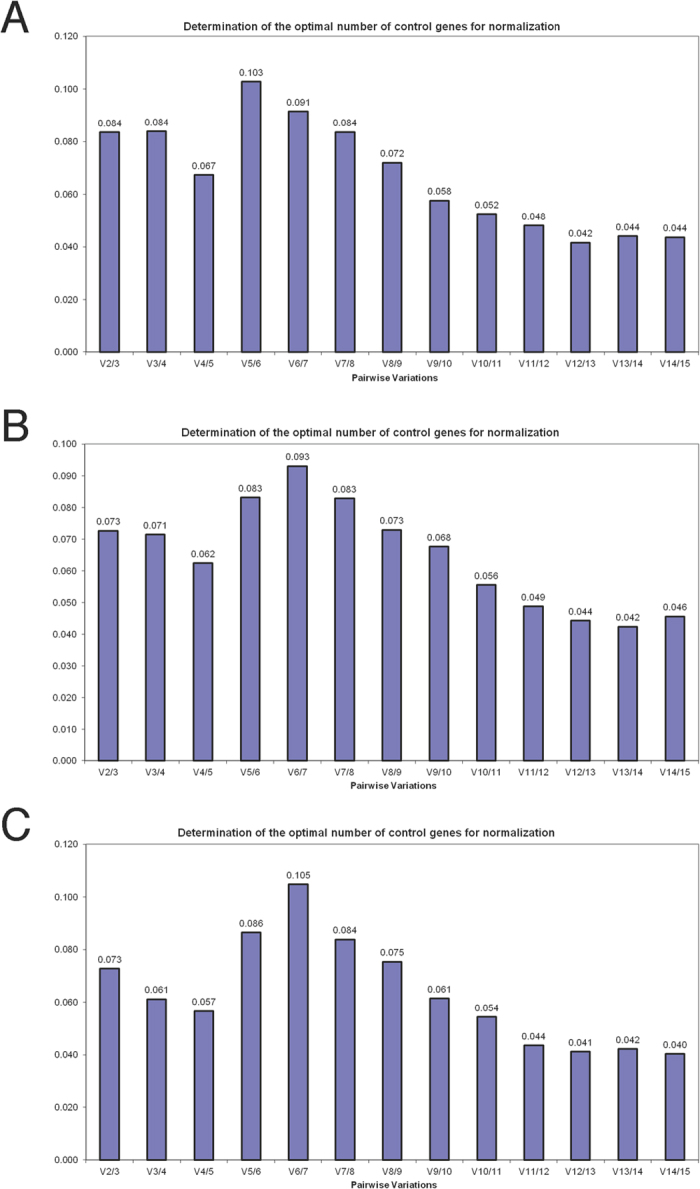
(A) 75 samples; (B) 55 samples; (C) 35 samples.
Figure 3. Stability values and ranking orders determined by 4 algorithms and RefFinder.
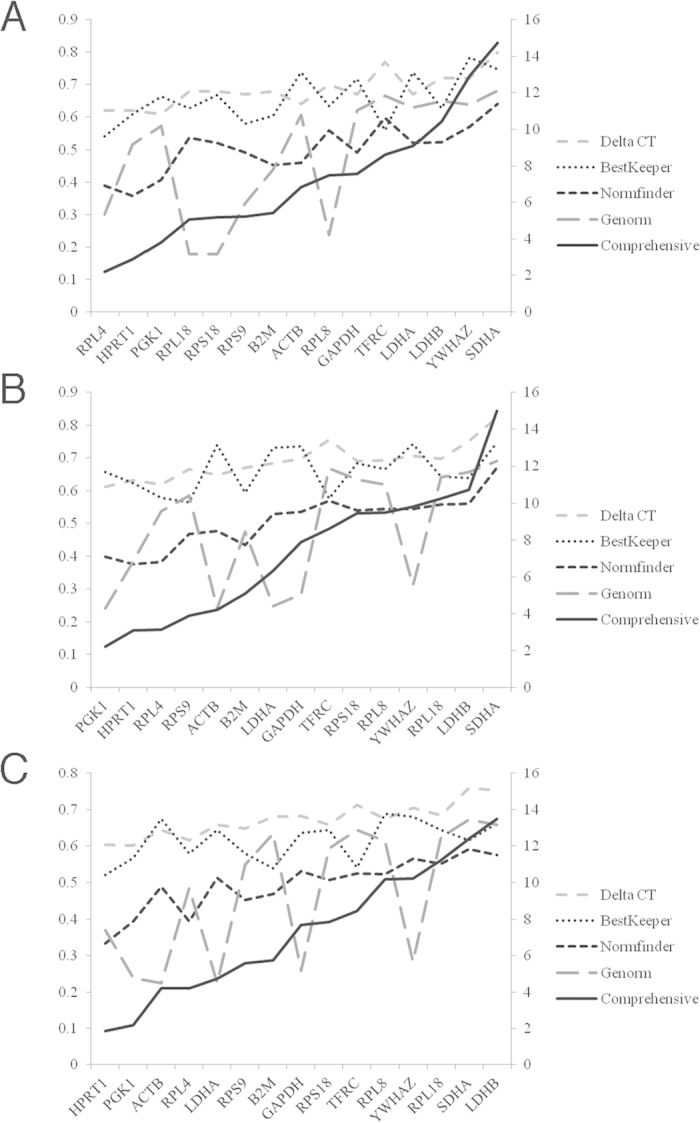
(A) 75 samples; (B) 55 samples; (C) 35 samples.
Gene transcript stability in 35- and 55-sample groups
In both 35- and 55-sample groups the M values in geNorm of all studied HKGs were lower than the program’s default limit (M = 1.5), and the SDCq value in BestKeeper were <1. V2/3 values in both groups were below to 0.15 (Fig. 2B,C). In contrast to the result in 75-sample group, geNorm algorithm identified PGK1, ACTB and LDHA to be the most stable HKGs in both groups. BestKeeper showed similar results in high-ranking HKGs (RPL4, TFRC, RPS9, B2M and HPRT1) in three groups. NormFinder and comparative ΔCt method identified HPRT1, PGK1 and RPL4 to be the best-three HKGs in all three groups. The RefFinder comprehensive rankings placed PGK1, HPRT1 and RPL4 as being highly ranked HKGs in all three groups (Tables 3, 4, 5, Fig. 3).
Table 4. Results of stability among 15 candidate genes computed by 4 algorithms using 55 bottlenose dolphin blood samples.
| HKGs | Comprehensive Ranking |
Delta CT |
BestKeeper |
NormFinder |
geNorm |
|||||
|---|---|---|---|---|---|---|---|---|---|---|
| Geomean of Ranking Value | Rank | Average of SD | Rank | SD | Rank | Stability value | Rank | M value | Rank | |
| PGK1 | 2.21 | 1 | 0.612 | 1 | 0.657 | 8 | 0.398 | 3 | 0.242 | 1 |
| HPRT1 | 3.08 | 2 | 0.633 | 3 | 0.624 | 5 | 0.376 | 1 | 0.386 | 6 |
| RPL4 | 3.13 | 3 | 0.619 | 2 | 0.578 | 3 | 0.382 | 2 | 0.539 | 8 |
| RPS9 | 3.87 | 4 | 0.665 | 5 | 0.565 | 1 | 0.469 | 5 | 0.585 | 9 |
| ACTB | 4.20 | 5 | 0.649 | 4 | 0.740 | 13 | 0.477 | 6 | 0.242 | 1 |
| B2M | 5.09 | 6 | 0.671 | 6 | 0.593 | 4 | 0.435 | 4 | 0.474 | 7 |
| LDHA | 6.34 | 7 | 0.685 | 7 | 0.732 | 11 | 0.529 | 7 | 0.247 | 3 |
| GAPDH | 7.87 | 8 | 0.698 | 10 | 0.736 | 12 | 0.535 | 8 | 0.283 | 4 |
| TFRC | 8.61 | 9 | 0.755 | 14 | 0.577 | 2 | 0.570 | 14 | 0.669 | 14 |
| RPS18 | 9.43 | 10 | 0.691 | 8 | 0.685 | 10 | 0.540 | 9 | 0.635 | 11 |
| RPL8 | 9.49 | 11 | 0.694 | 9 | 0.665 | 9 | 0.544 | 10 | 0.619 | 10 |
| YWHAZ | 9.80 | 12 | 0.706 | 12 | 0.743 | 14 | 0.544 | 11 | 0.312 | 5 |
| RPL18 | 10.26 | 13 | 0.698 | 11 | 0.644 | 7 | 0.559 | 12 | 0.642 | 12 |
| LDHB | 10.72 | 14 | 0.751 | 13 | 0.638 | 6 | 0.561 | 13 | 0.656 | 13 |
| SDHA | 15.00 | 15 | 0.824 | 15 | 0.747 | 15 | 0.671 | 15 | 0.690 | 15 |
Table 5. Results of stability among 15 candidate genes computed by 4 algorithms using 35 bottlenose dolphin blood samples.
| HKGs | Comprehensive Ranking |
Delta CT |
BestKeeper |
NormFinder |
geNorm |
|||||
|---|---|---|---|---|---|---|---|---|---|---|
| Geomean of Ranking Value | Rank | Average of SD | Rank | SD | Rank | Stability value | Rank | M value | Rank | |
| HPRT1 | 1.86 | 1 | 0.603 | 2 | 0.522 | 1 | 0.334 | 1 | 0.371 | 6 |
| PGK1 | 2.21 | 2 | 0.601 | 1 | 0.567 | 4 | 0.395 | 2 | 0.238 | 3 |
| ACTB | 4.20 | 3 | 0.644 | 4 | 0.675 | 13 | 0.489 | 6 | 0.225 | 1 |
| RPL4 | 4.21 | 4 | 0.616 | 3 | 0.580 | 5 | 0.395 | 3 | 0.485 | 7 |
| LDHA | 4.74 | 5 | 0.659 | 7 | 0.644 | 9 | 0.513 | 8 | 0.225 | 1 |
| RPS9 | 5.57 | 6 | 0.648 | 5 | 0.580 | 6 | 0.453 | 4 | 0.549 | 8 |
| B2M | 5.73 | 7 | 0.680 | 9 | 0.540 | 2 | 0.468 | 5 | 0.635 | 12 |
| GAPDH | 7.70 | 8 | 0.682 | 10 | 0.637 | 8 | 0.532 | 11 | 0.259 | 4 |
| RPS18 | 7.84 | 9 | 0.659 | 6 | 0.645 | 10 | 0.508 | 7 | 0.593 | 9 |
| TFRC | 8.44 | 10 | 0.712 | 13 | 0.541 | 3 | 0.525 | 10 | 0.644 | 13 |
| RPL8 | 10.19 | 11 | 0.675 | 8 | 0.688 | 15 | 0.523 | 9 | 0.614 | 10 |
| YWHAZ | 10.22 | 12 | 0.705 | 12 | 0.681 | 14 | 0.566 | 13 | 0.284 | 5 |
| RPL18 | 11.24 | 13 | 0.685 | 11 | 0.645 | 11 | 0.552 | 12 | 0.624 | 11 |
| SDHA | 12.40 | 14 | 0.760 | 15 | 0.615 | 7 | 0.591 | 15 | 0.672 | 15 |
| LDHB | 13.47 | 15 | 0.754 | 14 | 0.662 | 12 | 0.576 | 14 | 0.659 | 14 |
Discussion
RNA transcript stability plays a crucial role in qRT-PCR-based studies due to pre-analytical variations, especially degradation by endogenous RNases and unintentional transcription of individual genes after blood drawing. Without proper preservation, copy number of individual mRNA transcripts in blood can change more than 1000-fold during storage and transport20. Two common methods for stabilizing blood leukocyte RNA are to use PAXgene Blood RNA vacutainer tube and RNAlater. Previous study compared RNA transcript stability in blood leukocytes collected directly into PAXgene tubes or transferred immediately in RNAlater, and showed both methods were clearly appropriate for RNA stabilization in blood based on good quantity, integrity and purity of isolated RNA21. PAXgene tube has been successfully used in blood collection of sea otters (Enhydra lutris) to measure differential transcript levels of select immune function genes20. PAXgene tubes have the advantage of minimal sample manipulation and immediate exposure of the cells to RNA stabilizing agents, but require collection of 2.5 mL of blood. The present study used RNAlater. Smaller blood volume (0.5 mL) needed for RNAlater would facilitate sample collection and transport. Besides, a small difference between the maximum and minimum Cq values of each HKG indicates good quality of RNA stabilization and the consequent procedures in the current study.
Amplification efficiency is an important factor in gene transcript studies using qPCR. When efficiency is not close to 100% (doubling of PCR products per cycle), the calculation the gene quantification requires corrected22. ΔΔCt and ΔΔCtcorrected may yield similar results only in the case where high quality data are available and the traditional ΔΔCt method would not overestimate the error23. The efficiency values of 15 candidate genes in the present study were within the optimal range of 95–105%. Regardless, HKG rankings were susceptible to modest variation if raw Cq values were used for stability analysis rather than corrected Cq values were used (data not shown). This suggests that proper efficiency adjustment can improve qPCR data analysis with greater accuracy.
The HKG stability orders proposed by the four different algorithms used in the current study were not identical, which has been described before24. BestKeeper uses raw Cq data as compared to relative transcript levels used in geNorm and NormFinder that may lead to the different outputs24. Comparative ΔCt and geNorm, which use a pairwise comparison approach, are prone to select co-regulated genes and this can also influence the ranking results25. While NormFinder uses a model-based approach that considers systematic differences and is less likely to be impacted by co-regulated HKGs, it is sensitive to sampling errors and outliers26. Since different algorithms can show various HKG rankings, it has been suggested that more than one type of algorithm should be used for reference gene selection27. RefFinder was used in the current study to combine all four algorithms to comprehensively evaluate and rank HKGs. This approach assigns an appropriate score to each individual HKG and then calculates their geometric means to produce a final ranking.
The three most stable HKGs (PGK1, RPL4, HPRT1) identified using RefFinder were also in high-ranking orders in NormFinder and comparative ΔCt. In contrast, the top 5 reference genes identified by geNorm were all coding for ribosomal proteins that are likely to be co-regulated. It has been demonstrated that the sensitivity to co-regulation is a major weakness of the pairwise comparison approach while the co-regulation of candidate HKGs does not significantly affect the model-based approach (NormFinder)26. Sole utilization of ribosomal protein genes as reference genes has the potential to decrease the sensitivity of identifying changes in transcript levels of GOI in an experiment6. Therefore, utilization of HKGs whose encoded proteins belong to different functional classes would reduce the co-regulation effect26. The three most stable HKGs in the present study are responsible for different functions. PGK1, encoding for a key enzyme in glycolysis and gluconeogenesis, has previously been identified as a stable reference gene for use with human whole blood RNA and RNA derived from PBMC28. RPL4 encodes a protein that is a component of the 60S ribosome subunit. It has been identified as a suitable reference gene on the PBMCs with unknown pathogenic condition in pigs29. RPL4 and PGK1 have previously been recommended as reference gene for exfoliated cervical cells30. HPRT1, plays a central role in the generation of purine nucleotides through the purine salvage pathway, belonged to one of the most stable reference genes for qRT-PCR studies in human neutrophils31 and exercise induced stress in horse PBMCs32.
Increasing the number of stably transcribed HKGs included in calculation will increase the efficacy of the normalization factor3. Previous studies have suggested there is no single reference gene that can be used for different experiments but rather a group of putative reference genes should be considered for certain specific experimental setups27. While inclusion of more HKGs further decreased the V values in the present study, the V2/3 value showed two genes were sufficient for data normalization. Previous study has suggested the transcript levels of a reference gene should not to be very low (Cq > 30) or very high (Cq < 15)33. However, appropriate reference genes were suggested to have the same transcript levels as the target gene in an experimental application in order to enhance the uniformity of the analysis5. According to mean Cq values, PGK1 and HPRT1 were classified in the low transcript-level group (mean Cq > 25) and RPL4 in the high transcript-level group (mean Cq < 25). Based upon these concepts, the low-level transcripts encoding PGK1 and HPRT1 would be logical reference genes for studying immune-inducible genes with typical low transcript level, and the combination of RPL4 and PGK1 would be more appropriate for higher transcript-level studies. Investigators must recognize that the proposed reference genes in this study would be suitable only when RNA is extracted from RNAlater-preserved whole blood samples of bottlenose dolphins. It has been shown that some HKGs found to be invariant in proliferating PBMC cultures were unsuitable when studied in whole blood28,34. For blood samples from other cetacean species, more studies are needed to identify if PGK1, HPRT1 and RPL4 are superior reference genes as well.
Immunologic studies of cetaceans with cytokine gene transcripts have been conducted on blood samples using several different HKGs as reference genes. GAPDH and YWHAZ were used in harbor porpoise studies10,11,12, GAPDH in bottlenose dolphins13, and RPS9 in bottlenose dolphins, beluga whales, and Pacific white-sided dolphins8,14. RPS9 could potentially be a better reference gene than GAPDH and YWHAZ in studies using bottlenose blood samples since it was ranked much higher than the other two genes in the current study.
The reliability of reference gene selection could be affected by sample size. The general recommendation for selecting reference genes using NormFinder is a minimum of 8 samples and 5–10 genes26, and GeNorm proposed the use of 8 reference genes and 10 samples3. Previous studies directed at reference gene selection in cetaceans have included 30 skin biopsy samples in striped dolphins5, and 20 skin biopsy samples from 7 blue whales (Balaenoptera musculus), 7 fin whales (Balaenoptera physalus) and 6 sperm whales (Physeter macrocephalus)17. Bovine35 and sheep36 studies have employed 22 and 16 neutrophil samples, respectively, for use as reference gene selection. The current study employed 75 blood samples from 7 bottlenose dolphins including clinically healthy controls and individuals with a variety of different body conditions, which has been suggested for facilitating optimal reference gene selection for a wide-range of whole blood transcript studies37. In addition, the analyses were conducted using randomly selected subsets of 35 and 55 samples for comparative purposes. Analyses of the 35- and 55-sample subsets using RefFinder also identified HPRT1, PGK1 and RPL4 as being the high-ranking genes, only differing in the ranking order. It indicated that a 35-bottlenose dolphin blood sample set with various body conditions could establish reliable HKGs as reference genes. This is the first comparison of sample size effect on reference gene selection to our knowledge. It should be noted that the reference gene identified here is for use in clinical bottlenose dolphin testing. For non-clinical dolphin research, the potential reference gene should be verified first for each experimental condition. Employing a similar approach in other cetacean species in the future would be both time and cost saving.
Methods
Sample collection and preservation
The voluntary blood collection of dolphins was performed in accordance with international guidelines, and the protocol has been reviewed and approved by Council of Agriculture of Taiwan (Approval number 1020727724). Seventy-five samples from 7 bottlenose dolphins (13 samples from A animal, 12 from B animal, and 10 from each of the other 5 animals) in Farglory Ocean Park were obtained on a monthly basis or during occasional examinations from 2011 to 2013. Samples were from dolphins with various body conditions including clinically healthy condition (25 samples from 6 animals), inflammation (12 samples from 4 animals), skin lesions (4 samples from 4 animals), and internal diseases with various abnormalities in blood work and cytology (33 samples from 7 animals). Five hundred microliters of EDTA-anticoagulated whole blood was fixed by 1.3 mL RNAlater®(Ambion, Applied Biosystems, Foster City, CA, USA) within 5 min after blood collection. Samples were stored at 4 °C in the first 24 h, and then moved to −20 °C for long-term storage.
RNA extraction and cDNA synthesis
Total RNA was extracted from blood samples using RiboPure™-Blood Kit (Ambion) according to the manufacturer’s instructions. RNA ArmorTM Reagent (Protech, Taipei, Taiwan) was added to RNA solutions to eliminate contaminated RNase. RNA integrity was monitored routinely using denaturing gel electrophoresis. RNA concentration was determined using fluorescence-based quantitation method (Qubit™ fluorometer with a Quant-iT™ RNA Assay Kit (Invitrogen, Carlsbad, CA, USA)). RNA samples were adjusted to a concentration of 100 ng prior to analysis. RNA samples were treated with genomic DNA (gDNA) wipeout solution (Qiagen, Valencia, CA, USA). Treated samples were tested by qPCR to ensure the absence of residue gDNA prior to addition of reverse transcription working solution. QuantiTect® Reverse Transcription kit (Qiagen), provided a blend of oligo-dT and random primers, was used for cDNA synthesis. Complementary DNA and unused extracted RNA were stored at −80 °C.
Primer and probe design
Sequences of the 15 candidate cetacean HKGs (ACTB, B2M, GAPDH, HPRT1, LDHB, PGK1, RPL4, RPL18, RPS9, RPS18, TFRC, YWHAZ, RPL8, SDHA, LDHA) were obtained from GenBank (Table 2). The majority of sequences were obtained from bottlenose dolphin and striped dolphin, while a few were based upon beluga whale, killer whale and fin whale (Balaenoptera physalus). Primers and corresponding UPL probes were designed using Roche UPL design software (ProbeFinder, v.2.49) (Table 2). Primer specificity of the 15 candidate genes was confirmed by PCR using Fast-Run Hotstart PCR kit (Protech) and electrophoresis.
Quantitative PCR
Quantitative PCR was conducted in 48-well reaction plates using the Eco Real-Time PCR System (Illumina, San Diego, CA, USA). Reactions were prepared in a total volume of 10 μL containing 3 μL of 12-fold-diluted cDNA, 0.4 μL of each 10 μM primer, 0.2 μL of UPL probe (Roche, Pleasanton, CA, USA), 5 μL FastStart Essential DNA Probes Master (Roche) and 1 μL of RNase/DNase-free sterile water (Protech). The thermocycle conditions were set as follows: polymerase activation at 95 °C for 10 min, followed by 45 cycles of denaturation at 95 °C for 10 s and combined primer annealing/elongation at 60 °C for 30 s. All reactions including no template controls (NTC) and plate controls were conducted in triplicate. Plate controls contain the same reaction components on every plate. Cq data was analyzed with EcoStudy software (Illumina). A consistent Cq value across plates was obtained allowing the data consolidation from multiple plates into a single study data set. Baseline values were automatically determined for all plates using Eco Software V4.0. Thresholds for each HKG were determined manually (Table 2). Triplicate Cq values with standard deviation (SD) <0.5 were averaged as raw Cq values. PCR amplification efficiency (E) and R2 for each probe and primer pair were calculated from the slope of a standard curve using the following equation: E = (10(−1/slope)−1) × 100%. The average of at least three E values for each HKG was used as a gene-specific E for following relative quantity transformation. This study was conducted according to MIQE (Minimum information for publication of quantitative real-time PCR experiments) guidelines38.
Data analysis
Corrected Cq values (Cq corr) were transformed from raw Cq values using ΔCq formula, Cq corr = Cqmin−log2 E −ΔCq, modified from Fu et al.39, where ΔCq is the Cq value of a certain sample minus the Cq value of the sample with the highest transcript level (lowest Cq, Cqmin) of each HKG. Stability of all HKGs were evaluated and ranked using algorithms geNorm3, NormFinder26, comparative ΔCt method40 and Bestkeeper41 using the web-based analysis tool RefFinder (http://www.leonxie.com/referencegene.php)42. Algorithm geNorm calculates the expression stability value for each gene and them performs a pair-wise comparison of this gene with the others. NormFinder ranks the set of candidate reference genes according to the least of their estimated variations. Comparative ΔCt method compares relative transcription of pairs of genes and the stability of candidate reference genes is ranked according to repeatability among all samples. BestKeeper determines the standard deviation and the genes are rated based upon variability. RefFinder calculated the geometric mean based upon rankings obtained from each algorithm and provides the final comprehensive ranking. Thirty-five and 55 samples were randomly selected from the original 75 samples, and the HKG ranking results were compared among 35-, 55- and 75-sample groups.
Additional Information
How to cite this article: Chen, I.-H. et al. Selection of suitable reference genes for normalization of quantitative RT-PCR in peripheral blood samples of bottlenose dolphins (Tursiops truncatus). Sci. Rep. 5, 15425; doi: 10.1038/srep15425 (2015).
Acknowledgments
We would like to thank all veterinarians, trainers, students and assistants who participated in this project for their help. This research was supported by Ministry of Science and Technology (Taiwan, ROC), through Grant MOST—103—3113—E—002—013. The funder had no role in study design, data collection and analysis, decision to publish, or preparation of the manuscript.
Footnotes
Author Contributions I.H.C. performed all the experimental procedure, data analysis, and manuscript writing. L.S.C., S.J.C., J.H.W., J.S., M.B. and I.F.J. participated in the experimental process, providing samples, and commenting on the study design and data analysis. W.C.Y. supervised the study design, experimental procedure and data analysis, and was the primary author of the manuscript. All authors reviewed the manuscript.
References
- Wong M. L. & Medrano J. F. Real-time PCR for mRNA quantitation. Biotechniques 39, 75–85 (2005). [DOI] [PubMed] [Google Scholar]
- Heid C. A., Stevens J., Livak K. J. & Williams P. M. Real time quantitative PCR. Genome Res. 6, 986–994 (1996). [DOI] [PubMed] [Google Scholar]
- Vandesompele J. et al. Accurate normalization of real-time quantitative RT-PCR data by geometric averaging of multiple internal control genes. Genome Biol. 3, RESEARCH0034 Epub (2002). [DOI] [PMC free article] [PubMed] [Google Scholar]
- Olsvik P. A., Søfteland L. & Lie K. K. Selection of reference genes for qRT-PCR examination of wild populations of Atlantic cod Gadus morhua. BMC Res. Notes 1, 47–47, 10.1186/1756-0500-1-47 (2008). [DOI] [PMC free article] [PubMed] [Google Scholar]
- Spinsanti G. et al. Selection of reference genes for quantitative RT-PCR studies in striped dolphin (Stenella coeruleoalba) skin biopsies. BMC Mol. Biol. 7, 32–32, 10.1186/1471-2199-7-32 (2006). [DOI] [PMC free article] [PubMed] [Google Scholar]
- Piek C. J., Brinkhof B., Rothuizen J., Dekker A. & Penning L. C. Leukocyte count affects expression of reference genes in canine whole blood samples. BMC Res. Notes 4, 36–36, 10.1186/1756-0500-4-36 (2011). [DOI] [PMC free article] [PubMed] [Google Scholar]
- King D. P., Aldridge B. M., Kennedy-Stoskopf S. & Stott J. L. In CRC handbook of marine mammal medicine (eds Leslie A. Dierauf & Frances M.D. Gulland) Ch. 12, 237–248 (CRC Press, 2001). [Google Scholar]
- Sitt T. et al. Quantitation of leukocyte gene expression in cetaceans. Dev. Comp. Immunol. 32, 1253–1259, 10.1016/j.dci.2008.05.001 (2008). [DOI] [PubMed] [Google Scholar]
- Buckman A. H. et al. PCB-associated changes in mRNA expression in killer whales (Orcinus orca) from the NE Pacific Ocean. Environ. Sci. Technol. 45, 10194–10202, 10.1021/es201541j (2011). [DOI] [PubMed] [Google Scholar]
- Beineke A., Siebert U., van Elk N. & Baumgartner W. Development of a lymphocyte-transformation-assay for peripheral blood lymphocytes of the harbor porpoise and detection of cytokines using the reverse-transcription polymerase chain reaction. Vet. Immunol. Immunopathol. 98, 59–68 (2004). [DOI] [PubMed] [Google Scholar]
- Beineke A., Siebert U., Müller G. & Baumgärtner W. Increased blood interleukin-10 mRNA levels in diseased free-ranging harbor porpoises (Phocoena phocoena). Vet. Immunol. Immunopathol. 115, 100–106, 10.1016/j.vetimm.2006.09.006 (2007). [DOI] [PubMed] [Google Scholar]
- Müller S. et al. Evaluation of immune and stress status in harbour porpoises (Phocoena phocoena): can hormones and mRNA expression levels serve as indicators to assess stress? BMC Vet. Res. 9, 145–145, 10.1186/1746-6148-9-145 (2013). [DOI] [PMC free article] [PubMed] [Google Scholar]
- Mancia A., Warr G. W. & Chapman R. W. A transcriptomic analysis of the stress induced by capture-release health assessment studies in wild dolphins (Tursiops truncatus. Mol. Ecol. 17, 2581–2589, 10.1111/j.1365-294X.2008.03784.x (2008). [DOI] [PubMed] [Google Scholar]
- Sitt T. et al. Cellular immune responses in cetaceans immunized with a porcine erysipelas vaccine. Vet. Immunol. Immunopathol. 137, 181–189, 10.1016/j.vetimm.2010.05.003 (2010). [DOI] [PubMed] [Google Scholar]
- Dheda K. et al. The implications of using an inappropriate reference gene for real-time reverse transcription PCR data normalization. Anal. Biochem. 344, 141–143 (2005). [DOI] [PubMed] [Google Scholar]
- Spinsanti G. et al. Selection of reliable reference genes for qRT-PCR studies on cetacean fibroblast cultures exposed to OCs, PBDEs, and 17beta-estradiol. Aquat. Toxicol. 87, 178–186, 10.1016/j.aquatox.2008.01.018 (2008). [DOI] [PubMed] [Google Scholar]
- Martinez-Levasseur L. M., Gendron D., Knell R. J. & Acevedo-Whitehouse K. Control and target gene selection for studies on UV-induced genotoxicity in whales. BMC Res. Notes 6, 264, 10.1186/1756-0500-6-264 (2013). [DOI] [PMC free article] [PubMed] [Google Scholar]
- Kullberg M., Nilsson M. A., Arnason U., Harley E. H. & Janke A. Housekeeping genes for phylogenetic analysis of eutherian relationships. Mol. Biol. Evol. 23, 1493–1503, 10.1093/molbev/msl027 (2006). [DOI] [PubMed] [Google Scholar]
- Echigoya Y., Sato T., Itou T., Endo H. & Sakai T. Molecular characterization and expression pattern of the equine lactate dehydrogenase A and B genes. Gene 447, 40–50, 10.1016/j.gene.2009.07.017 (2009). [DOI] [PubMed] [Google Scholar]
- Bowen L. et al. Gene transcription in sea otters (Enhydra lutris): development of a diagnostic tool for sea otter and ecosystem health. Mol. Ecol. Resour. 12, 67–74, 10.1111/j.1755-0998.2011.03060.x (2012). [DOI] [PubMed] [Google Scholar]
- Weber D. G. et al. Assessment of mRNA and microRNA stabilization in peripheral human blood for multicenter studies and biobanks. Biomark. insights 5, 95–102 (2010). [DOI] [PMC free article] [PubMed] [Google Scholar]
- Yuan J. S., Wang D. & Stewart C. N. Jr. Statistical methods for efficiency adjusted real-time PCR quantification. Biotechnol. J. 3, 112–123, 10.1002/biot.200700169 (2008). [DOI] [PubMed] [Google Scholar]
- Yuan J. S., Reed A., Chen F. & Stewart C. N. Jr. Statistical analysis of real-time PCR data. BMC Bioinformatics 7, 85, 10.1186/1471-2105-7-85 (2006). [DOI] [PMC free article] [PubMed] [Google Scholar]
- Scharlaken B., de Graaf D. C., Goossens K., Peelman L. J. & Jacobs F. J. Reference gene selection for insect expression studies using quantitative real-time PCR: the head of the honeybee, Apis mellifera, after a bacterial challenge. J. Insect Sci. 8, 33, 10.1016/j.dci.2008.01.010 (2008). [DOI] [Google Scholar]
- He J. Q. et al. Selection of housekeeping genes for real-time PCR in atopic human bronchial epithelial cells. Eur. Respir. J. 32, 755–762, 10.1183/09031936.00129107 (2008). [DOI] [PubMed] [Google Scholar]
- Andersen C. L., Jensen J. L. & Ørntoft T. F. Normalization of real-time quantitative reverse transcription-PCR data: a model-based variance estimation approach to identify genes suited for normalization, applied to bladder and colon cancer data sets. Cancer Res. 64, 5245–5250, 10.1158/0008-5472.CAN-04-0496 (2004). [DOI] [PubMed] [Google Scholar]
- Zyzynska-Granica B. & Koziak K. Identification of suitable reference genes for real-time PCR analysis of statin-treated human umbilical vein endothelial cells. PLoS One 7, e51547, 10.1371/journal.pone.0051547 (2012). [DOI] [PMC free article] [PubMed] [Google Scholar]
- Falkenberg V. R., Whistler T., Murray J. R., Unger E. R. & Rajeevan M. S. Identification of Phosphoglycerate Kinase 1 (PGK1) as a reference gene for quantitative gene expression measurements in human blood RNA. BMC Res. Notes 4, 324, 10.1186/1756-0500-4-324 (2011). [DOI] [PMC free article] [PubMed] [Google Scholar]
- Cinar M. U. et al. Evaluation of suitable reference genes for gene expression studies in porcine PBMCs in response to LPS and LTA. BMC Res. Notes 6, 56, 10.1186/1756-0500-6-56 (2013). [DOI] [PMC free article] [PubMed] [Google Scholar]
- Steinau M., Rajeevan M. S. & Unger E. R. DNA and RNA references for qRT-PCR assays in exfoliated cervical cells. J. Mol. Diagn. 8, 113–118, 10.2353/jmoldx.2006.050088 (2006). [DOI] [PMC free article] [PubMed] [Google Scholar]
- Zhang X., Ding L. & Sandford A. J. Selection of reference genes for gene expression studies in human neutrophils by real-time PCR. BMC Mol. Biol. 6, 4, 10.1186/1471-2199-6-4 (2005). [DOI] [PMC free article] [PubMed] [Google Scholar]
- Cappelli K. et al. Exercise induced stress in horses: selection of the most stable reference genes for quantitative RT-PCR normalization. BMC Mol. Biol. 9, 49, 10.1186/1471-2199-9-49 (2008). [DOI] [PMC free article] [PubMed] [Google Scholar]
- Wan H. et al. Selection of appropriate reference genes for gene expression studies by quantitative real-time polymerase chain reaction in cucumber. Anal. Biochem. 399, 257–261, 10.1016/j.ab.2009.12.008 (2010). [DOI] [PubMed] [Google Scholar]
- Dheda K. et al. Validation of housekeeping genes for normalizing RNA expression in real-time PCR. BioTechniques 37, 112–114, 116, 118-119 (2004). [DOI] [PubMed] [Google Scholar]
- Vorachek W., Bobe G. & Hall J. Reference gene selection for quantitative PCR studies in bovine neutrophils. Adv. Biosci. Biotechnol. 4, 6–14 (2013). [DOI] [PMC free article] [PubMed] [Google Scholar]
- Vorachek W. R., Hugejiletu Bobe, G. & j Hall J. A. Reference gene selection for quantitative PCR studies in sheep neutrophils. Int. J. Mol. Sci. 14, 11484–11495, 10.3390/ijms140611484 (2013). [DOI] [PMC free article] [PubMed] [Google Scholar]
- Stamova B. S. et al. Identification and validation of suitable endogenous reference genes for gene expression studies in human peripheral blood. BMC Med. Genomics 2, 49, 10.1186/1755-8794-2-49 (2009). [DOI] [PMC free article] [PubMed] [Google Scholar]
- Bustin S. A. et al. The MIQE guidelines: minimum information for publication of quantitative real-time PCR experiments. Clin. Chem. 55, 611–622, 10.1373/clinchem.2008.112797 (2009). [DOI] [PubMed] [Google Scholar]
- Fu W. et al. Exploring valid reference genes for quantitative real-time PCR analysis in Plutella xylostella (Lepidoptera: Plutellidae). Int. J. Biol. Sci. 9, 792–802, 10.7150/ijbs.5862 (2013). [DOI] [PMC free article] [PubMed] [Google Scholar]
- Silver N., Best S., Jiang J. & Thein S. L. Selection of housekeeping genes for gene expression studies in human reticulocytes using real-time PCR. BMC Mol. Biol. 7, 33–33, 10.1186/1471-2199-7-33 (2006). [DOI] [PMC free article] [PubMed] [Google Scholar]
- Pfaffl M., Tichopad A., Prgomet C. & Neuvians T. Determination of stable housekeeping genes, differentially regulated target genes and sample integrity: BestKeeper – Excel-based tool using pair-wise correlations. Biotechnol. Lett. 26, 509–515, 10.1023/B:BILE.0000019559.84305.47 (2004). [DOI] [PubMed] [Google Scholar]
- Xie F., Sun G., Stiller J. W. & Zhang B. Genome-wide functional analysis of the cotton transcriptome by creating an integrated EST database. PLoS One 6, e26980, 10.1371/journal.pone.0026980 (2011). [DOI] [PMC free article] [PubMed] [Google Scholar]