Abstract
The need to correctly predict the voltage across terminals of mm-sized coils, with ferrite core, to be employed for magnetic stimulation of the peripheral neural system is the motivation for this work. In such applications, which rely on a capacitive discharge on the coil to realise a transient voltage curve of duration and strength suitable for neural stimulation, the correct modelling of the non-linearity of the ferrite core is critical. A demonstration of how a finite-difference model of the considered coils, which include a model of the current-controlled inductance in the coil, can be used to correctly predict the time-domain voltage waveforms across the terminals of a test coil is presented. Five coils of different dimensions, loaded with ferrite cores, have been fabricated and tested: the measured magnitude and width of the induced pulse are within 10% of simulated values.
Keywords: ferrites, neurophysiology, biomagnetism, bioelectric potentials, finite difference methods, coils, patient treatment
Keywords: ferrite core nonlinearity, coils, magnetic neurostimulation, peripheral neural system, capacitive discharge, transient voltage curve, finite-difference model, current-controlled inductance, time-domain voltage waveforms, Fe3O4
1. Introduction
Magnetic fields cover an important role in several biomedical devices and diagnostic equipment. From the point of view of neurostimulation, transcranial magnetic stimulation (TMS) is one of the non-invasive techniques for the stimulation of the central nervous system. It uses time-varying magnetic fields to induce eddy currents in the tissue and elicit neural stimulation [1]. Compared with an electrical stimulator, a magnetic neurostimulator can provide reliable stimulation over long periods because of its contactless stimulation mechanism. In the literature, several approaches have been considered to employ magnetic core-based coils to generate high induced electric fields using small dimension coils (diameter 4–12 mm) [1, 2] and large TMS coils (diameter 10 cm) [3]. Traditionally, these designs use expensive magnetic cores with high permeability (μr ∼20 000) and high magnetic field saturation (∼2 T). Despite the advances in the use and analysis of relatively large coils for neurostimulation, external to the human body, the development of small coils for possible implantation still faces significant challenges. Among these challenges, the behaviour of small ferrite-loaded coils to be used in implants and, in particular, the effect of saturation on the waveform of these neurostimulators have not been well studied.
Most magnetic materials (iron, ferrite) are non-linear and dispersive. Their relative magnetic permeability (μr) varies with the applied magnetic field intensity (H) and operating frequency. Due to changes in μr with respect to field intensity, inductors with a magnetic core may show a non-linear inductance as a function of the applied current. In the case of small sized, ferrite-loaded coils for neurostimulation a linear inductor model is no longer valid [4], and the correct prediction of the non-linear effect in the inductor is critical in determining the potential effectiveness of these coils for magnetic stimulation. In fact, for magnetic stimulation, the calculation of electric field distributions (spatial and temporal) in the proximal region of the stimulus coil is required to predict the stimulation site and to optimise the design under system constraints. Therefore numerical modelling of the system is required to predict the field distribution of magnetic-core-based magnetic stimulators.
In this Letter, we demonstrate how a finite-difference model of the considered coils, which include a model of the current-controlled inductance in the coil, can be used to correctly predict the time-domain voltage waveforms across the terminals of a test coil. We employ a non-linear ferromagnetic core [5] and the time-domain numerical simulation incorporates the non-linearity of μr as a function of the current in the coil. The correct knowledge of the voltages and fields associated with the small implantable coils is critical for the prediction of the effectiveness of these coils for neuromagnetic stimulation.
2. Ferrite core-based magnetic coils
Magnetic stimulation is based on the electromagnetic induction principle. The magnetic field intensity B can be written in terms of the magnetic vector potential A [6]. Induced eddy current J(r, t) at location r in the tissue can be calculated using conductivity σ(r) and magnitude of the electric field E(r, t):
| (1) |
| (2) |
| (3) |
where ∇V(r, t) is the electric field contribution by the surface charge.
The neural stimulation threshold generally depends on the strength and the duration of the induced electric field pulse. In general, and within a certain operating window, the threshold is inversely proportional to the pulse duration of the induced electric field. Therefore, to design an efficient magnetic stimulator, the induced electric fields should be maximised while maintaining a sufficient pulse width. For a fixed current in the coil, a magnetic material-based coil is expected to increase the magnetic field generated in close proximity of the coil, as compared with an air-core coil. However, because of high currents in the coil, these magnetic cores may saturate, deteriorating the performance of the system.
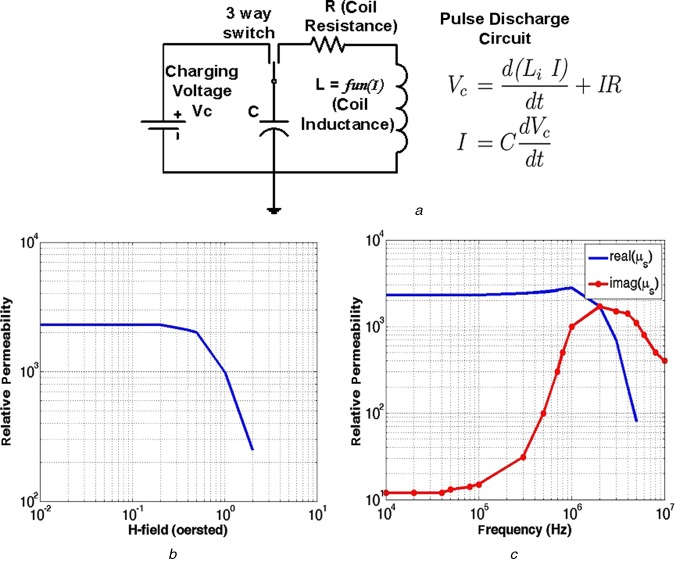
Fig. 1 shows a typical configuration of the magnetic stimulator, which requires a charging capacitor. At the stimulation instant, the charge stored in the capacitor causes a time-varying current in the coil. For an inductor Li (constant or current dependent) and capacitor C, a pulse discharge circuit can be solved to compute the capacitor voltage Vc and current I in the coil (Fig. 1a).
Figure 1.
Simplified schematic of pulse-discharge-based magnetic stimulator, variation of core's permeability with respect to H-field and operating frequency
a Simplified schematic of pulse-discharge-based magnetic stimulator
b Variation of core's permeability (MnZn ferrite material, from properties in [7]) with respect to H-field
c Operating frequency
3. Numerical modelling
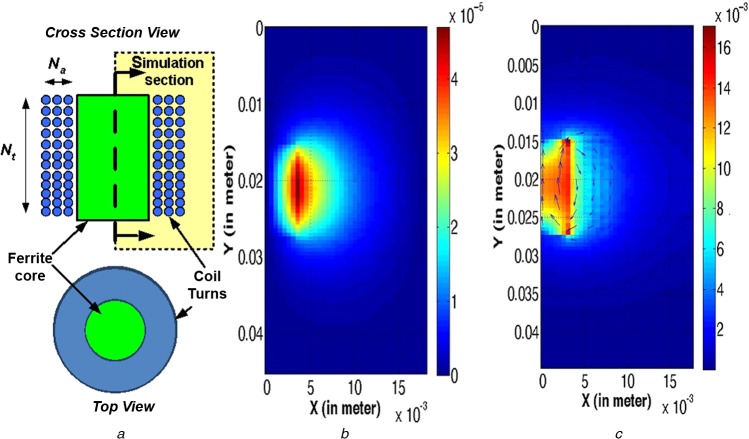
Compared to a toroid coil, solenoid coils provide more flexibility to position the magnetic coil near the stimulation site. For solenoid coils, the current-carrying wire is wrapped over a circular magnetic core. Fig. 2a shows the block diagram of a fabricated coil. The typical pulse width of the magnetic stimulator is on the order of 100–500 μs, which restricts the frequency component of the current pulse into the sub-kHz region. Thus, for small dimension magnetic coils at sub-kHz operating frequency, quasi-static approximation is reasonably valid for the field simulation.
Figure 2.
Block diagram of solid coil, magnetic vector potential and B-field because of coil A5 for unity current and unity frequency
a Block diagram of solid coil (top and cross-section view)
b Magnetic vector potential
c B-field because of coil A5 for unity current and unity frequency
Vector potential is V s/m and B-field is in tesla
For a solenoid coil, the current is in the aϕ direction resulting in a single component vector potential Aϕ. We developed a finite difference model and a Poisson equation solver to simulate the electric and the magnetic field distribution near the magnetic coil ((4), [8]). Equation (4) is derived by combining the coil current density Jϕ( = ∇ × H), B–H relationship (B = μH) and B = ∇ × A (1). The B-field is calculated by taking the curl of Aϕ (5) as formulated in (1)
| (4) |
| (5) |
An empirical model of the magnetic material's permeability as a function of the H-field is developed from the manufacturer's specification for MnZn material [7]-based ferrite (Fig. 1b). A three-dimensional finite difference model of the solenoid coil is created to include the coil wires and magnetic core (Fig. 2a). Fig. 2 shows the induced vector potential Aϕ(r, z) and B-field distribution by solving (4) and (5) for one of the solenoid coils (A5, Table 1).
Table 1.
Mechanical dimensions
| Coil number | (O. D., I.D), mm | Length, mm | Turns per layer | Core |
|---|---|---|---|---|
| A1 | (12, 6) | 18 | (15, 15, 14) | ferrite |
| A2 | (12, 7) | 15 | (15, 15, 15) | wood |
| A3 | (14, 6) | 12 | (12, 11, 10, 9) | ferrite |
| A4 | (9, 6) | 12 | (12, 11) | ferrite |
| A5 | (16, 6) | 12 | (12, 12, 11, 12, 9) | ferrite |
| test | (9, 8) | 4 | (4) | air |
To model the effect of the current in the coil on the core's saturation, the proposed electric field solver is used and the coil's inductance is modelled as a function of the current in the magnetic coil (Lcoil = fn(I)). For the time-domain simulation, the pulse discharge circuit (Fig. 1) is defined using the charging capacitance C, the current-controlled coil inductance Lcoil(I), the coil's resistance R, and the DC voltage V. Time step is linearly varied until the maximum simulation time. For each time step K + 1, the coil current and the capacitor voltage are calculated by solving the differential equation given by (8). With the calculated value of the current, the new value of the magnetic coil's inductance is calculated using the derived empirical formulation of the inductance of the coil (Lcoil = fn(I)):
| (6) |
| (7) |
| (8) |
Few commercial softwares (i.e. HFSS, ANSYS etc.) can simulate the spatial distribution of the induced electric field for these coils. However, using the implemented hybrid solver for the spatial and temporal distribution of the induced electric field, the effect of the non-linear inductor can be combined with the non-linear nerve models [9] to optimise the magnetic neural stimulator design.
4. Experimental validation
To validate the accuracy of numerical models, five inductors were fabricated using different core types and with different numbers of turns (Table 1). Using two techniques (inductance measurements and induced voltage in a test coil), the accuracy of the simulated spatial and temporal distributions of the induced electric field is validated.
4.1. Inductance calculation
Four coils have been built using a ferrite magnetic core, while one coil is built using a non-magnetic material core. A unity test current of 1 A at a frequency 1 Hz is used to calculate the coil's inductance with vector potentials (L = A·dl). Table 2 shows that all measured values of the inductances are in close agreement with the simulated values, with a maximum error of 10%, which is primarily attributable to the uniformity of coil winding.
Table 2.
Electrical properties
| Coil number | Inductance (calculated), μH | Inductance (measured), μH | Core | Resistance, Ω |
|---|---|---|---|---|
| A1 | 38.25 | 43 | ferrite | 0.057 |
| A2 | 8.91 | 9.2 | wood | 0.065 |
| A3 | 31.28 | 31.54 | ferrite | 0.047 |
| A4 | 10.479 | 11.19 | ferrite | 0.028 |
| A5 | 52.41 | 54.21 | ferrite | 0.071 |
4.2. Induced electric field simulation
To design an optimum magnetic stimulator, the induced field strength needs to be maximised with a reasonably wide pulse width (∼100–500 μs). Fig. 3 shows the magnetic stimulator board (printed circuit board – PCB) that utilises an electrolytic capacitor (C = 2200 μF) with the timing and driver electronics. The PCB traces cause a stray impedance of 0.1 Ω in the discharge path of the capacitor. The magnetic coil is attached to the stimulator board to create time-varying current and thus a time-varying B field. To validate the simulated induced E-field values, a test coil (Table 1) is positioned in close proximity of the magnetic coil as shown in Fig. 3. The induced voltage in the test coil, which is linearly proportional to the induced electric field, is recorded by an oscilloscope.
Figure 3.
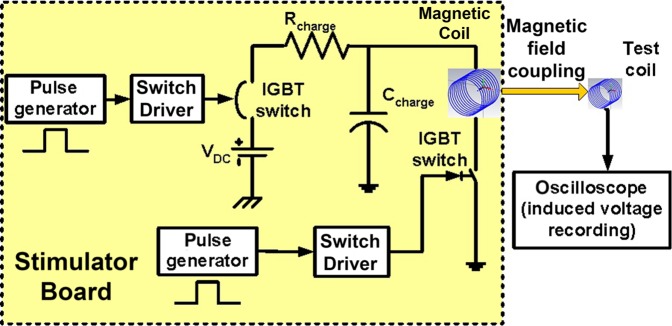
Magnetic stimulator test setup consisting of stimulator board, coil under test and test coil
For a high-power magnetic stimulator, the magnetic core is prone to saturate, affecting the induced electric field configuration. Thus, the peak-induced voltage in the test coil, time of core saturation and pulse width are considered the three key features of the stimulus pulse. Figs. 4 and 5 show the simulated and experimental induced voltages at the test coil terminal due to change in the current of the magnetic coil. A difference in the induced waveform after the saturation point, which is caused by the low-pass behaviour of the permeability as a function of frequency, can be observed. It should be noted that, in the simulation, the permeability of the ferrite core is considered independent of the operating frequency, which is not realistic for practical ferrite cores. Fig. 1c shows the variation of μr as a function of frequency. The permeability of the magnetic core shows a low-pass filter response as a function of frequency and, therefore does not allow a fast change in its value. However, for the key features of magnetic stimulation, such as the peak-induced voltage, the time of saturation, and the zero-crossing (pulse duration), the simulated and the measured waveforms are in good agreement.
Figure 4.
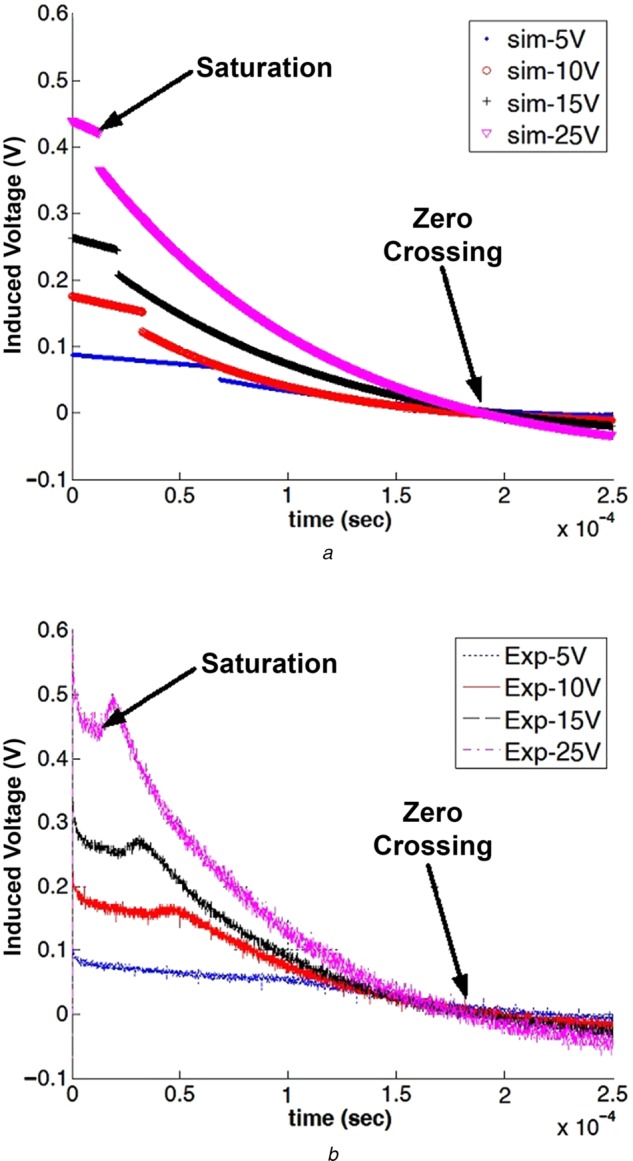
Simulated and measured induced voltage waveforms because of coil A5 across test coil terminals with varying charging voltage
a Simulated
b Measured
Figure 5.
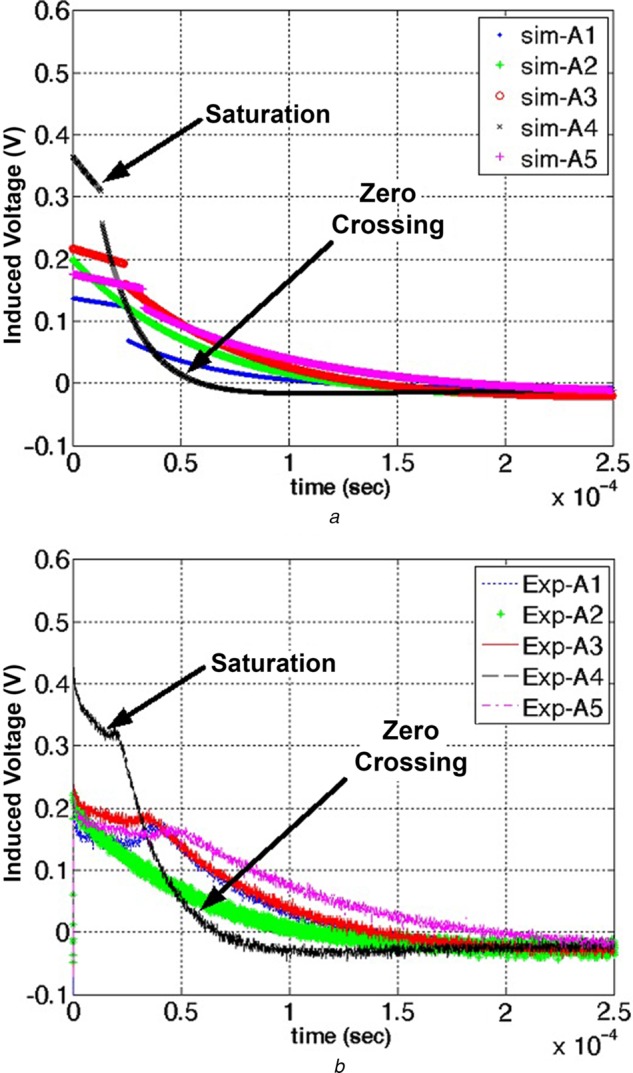
Simulated and measured induced voltage waveforms because of different coil configurations with a charging voltage of 10 V
a Simulated
b Measured
4.2.1. Effect of charging voltage
To identify the peak value of the induced voltage as a function of the capacitor charging voltage, the induced voltage in the test coil is simulated and measured for capacitor charging voltages of 5, 10, 15 and 25 V (Figs. 4a and b). It can be seen that the peak-induced voltage varies linearly with the change in the capacitor's initial voltage. Since the coil's current is proportional to the initial voltage of the capacitor, increasing the voltage causes the magnetic core to saturate faster. Table 3 shows the simulated saturation time of coil A5 as a function of input voltage and shows that the saturation time decreases linearly with increasing voltage. Due to the fast saturation of the core with the increase in voltage, the pulse width (zero-crossing) also decreases. Table 3 shows the comparison between the simulation and experimental results: the simulation can accurately predict the key design parameters of the magnetic stimulator, including peak E-field, saturation point and zero-crossing time.
Table 3.
Coil A5 – pulse properties
| Capacitor voltage, V | Peak-induced volt (sim, meas), V | Saturation time (sim, meas), μs | Zero-crossing (sim, meas), μs |
|---|---|---|---|
| 5 | (0.09, 0.09) | (68.2, 70) | (215, 216) |
| 10 | (0.18, 0.19) | (31.8, 34) | (199, 195) |
| 15 | (0.27, 0.28) | (20.8, 23.5) | (194, 190) |
| 25 | (0.44, 0.45) | (12.2, 13) | (190, 186) |
4.2.2. Effect of coil configuration
Figs. 5a and b show the simulated and the measured induced voltage across the test coil for different coils, and provides different peak-induced voltage, saturation time and zero-crossing time. For the same capacitor, a low inductive magnetic coil shows a faster decay rate because of the faster change in the coil current. It can be seen that, before saturation, the rate of decay in the induced voltage reduces with the increase in the inductance of the coil. For example, coil A5 shows slower decay with time in the induced voltage as compared with coil A4. After saturation of the core, ferrite-cored coils behave as air-core coils and cause a faster decay in the induced voltage. Thus, coils with a lower number of turns show a faster decay rate after saturation.
Table 4 compares the performance of each coil on the basis of peak-induced voltage, saturation time and zero-crossing time. Coil A5 shows the highest pulse width with moderate peak-induced voltage, while coil A4 has the highest induced voltage but decays faster and results in smaller pulse width.
Table 4.
Coil pulse properties at10 V
| Coil number | Peak-induced volt (sim, meas), V | Saturation time (sim, meas), μs | Zero-crossing (sim, meas), μs |
|---|---|---|---|
| A1 | (0.136, 0.16) | (25.4, 24) | (121.5, 128) |
| A2 | (0.2, 0.21) | (no saturation) | (127, 120) |
| A3 | (0.217, 0.218) | (23.8, 26) | (138, 140) |
| A4 | (0.365, 0.39) | (13.2, 16) | (59.5, 68) |
| A5 | (0.18, 0.19) | (31.8, 34) | (199, 195) |
4.2.3. Efficacy of the neural stimulator
Numerical modelling of the axon/neuron is a commonly used technique to estimate the efficacy of the neural stimulator. Including the effects of the spatial–temporal distribution of the induced electric field, the non-linear active model of the neurons can be used to solve for the neural activation. Previous works have demonstrated that an electric field magnitude as low as 5–6 V/m with a pulse duration of 100 μs is sufficient to cause neural activity [10]. Similar computational studies have been performed based on the Hodgkin–Huxley active ionic channels, and a stimulation threshold of 0.9 A/m2 was estimated [11]. In this Letter, using the developed spatial–temporal field simulator for the ferrite-loaded solenoid coil, induced electric field in the proximity of the magnetic coil is calculated as a function of the operating voltage. For example, coil A5, while placed 1 mm away from the neuron, generates the peak electric field value of 6 V/m (pulse width ∼182 μs) for the operating voltage of 30 V. This induced electric field generates a current density of 1.2 A/m2 in tissue with a conductivity of 0.2 S/m. On the basis of the previously established threshold data [10, 11], this field/current density distribution is sufficient to cause neural activation. Using these models, the effectiveness of the individual coils can be compared during the coil optimisation step.
5. Conclusion
In this Letter, the non-linear effect of the magnetic core of small coils to be used for implantable magnetic neurostimulation was studied. Five ferrite-loaded coils, of different dimensions, were fabricated and tested. The implemented numerical solver demonstrates the ability to accurately predict the amplitude and waveform of the induced electric fields. For all magnetic coils, measurements show close agreement ( < 10% difference) with the simulated values. The capability of these models to also correctly predict the effects of initial voltages of the capacitors on the induced field intensity and saturation time is instrumental in developing an effective magnetic neurostimulator. In fact, it is confirmed that because of the saturation of the core, the inductance of the coil changes drastically from its non-saturated value, which causes faster decay in the induced voltage and, ultimately, negatively affects the neurostimulator.
6. Funding and declaration of interests
This work was supported by the National Science Foundation under grant no. ECCS-1202235. Conflict of interest: none declared.
7 References
- 1.Ueno S.: ‘Studies on magnetism and bioelectromagnetics for 45 years: from magnetic analog memory to human brain stimulation and imaging’, Bioelectromagnetics, 2012, 33, (1), pp. 3–22 (doi: ) [DOI] [PubMed] [Google Scholar]
- 2.Davey K., Luo L., Ross D.: ‘Toward functional magnetic stimulation (fms) theory and experiment’, IEEE Trans. Biomed. Eng., 1994, 41, (11), pp. 1024–1030 (doi: ) [DOI] [PubMed] [Google Scholar]
- 3.Epstein C.M., Davey K.R.: ‘Iron-core coils for transcranial magnetic stimulation’, J. Clin. Neurophysiol., 2002, 19, (4), pp. 376–381 (doi: ) [DOI] [PubMed] [Google Scholar]
- 4.Gomand J., Remy G., Tounzi A., Barre P.-J., Hautier J.-P.: ‘Impact of permanent magnet field on inductance variation of a pmlsm’. European Conf. on Power Electronics and Applications, 2007, September 2007, pp. 1–9 [Google Scholar]
- 5.Sirbu I.: ‘A new technique for the determination of magnetic field distribution in a ferromagnetic core’. Third Int. Students Conf. on Electrodynamics and Mechatronics (SCE III), 2011, October 2011, pp. 127–132 [Google Scholar]
- 6.Cai D., Fang Y., Cao X., Zhang X., Tang J.: ‘Transcranial magnetic stimulation: modeling, calculating and system design’. Second Int. Conf. on Biomedical Engineering and Informatics, 2009, BMEI'09, 2009, pp. 1–5 [Google Scholar]
- 7.Fair-rite: ‘78 materials characteristics’, Available at: http://www.fair-rite.com/newfair/materials78.htm
- 8.S. software: ‘Magnetic potential’, Available at: http://www.simion.com/info/magneticpotential.html
- 9.Carnevale N., Hines M.: ‘The NEURON book’ (Cambridge University Press, 2006) [Google Scholar]
- 10.Reilly J., Diamant A.: ‘Spatial relationships in electrostimulation: application to electromagnetic field standards’, IEEE Trans. Biomed. Eng., 2003, 50, (6), pp. 783–785 (doi: ) [DOI] [PubMed] [Google Scholar]
- 11.Rattay F., Aberham M.: ‘Modeling axon membranes for functional electrical stimulation’, IEEE Trans. Biomed. Eng., 1993, 40, (12), pp. 1201–1209 (doi: ) [DOI] [PubMed] [Google Scholar]


