Abstract
The bilateral photoplethysmography (PPG) analysis for arteriovenous fistula (AVF) dysfunction screening with a fractional-order feature and a cooperative game (CG)-based embedded detector is proposed. The proposed detector uses a feature extraction method and a CG to evaluate the risk level for AVF dysfunction for patients undergoing haemodialysis treatment. A Sprott system is used to design a self-synchronisation error formulation to quantify the differences in the changes of blood volume for the sinister and dexter thumbs’ PPG signals. Bilateral PPGs exhibit a significant difference in rise time and amplitude, which is proportional to the degree of stenosis. A less parameterised CG model is then used to evaluate the risk level. The proposed detector is also studied using an embedded system and bilateral optical measurements. The experimental results show that the risk of AVF stenosis during haemodialysis treatment is detected earlier.
Keywords: photoplethysmography, blood vessels, feature extraction, medical signal processing, patient treatment, blood
Keywords: bilateral photoplethysmography analysis, arteriovenous fistula dysfunction screening, fractional-order feature, cooperative game-based embedded detector, PPG, feature extraction, AVF dysfunction, haemodialysis treatment, Sprott system, self-synchronisation error formulation, blood volume changes, rise time, stenosis, bilateral optical measurements
1. Introduction
Vascular access stenosis in patients with diabetes and long-term haemodialysis is widespread. The statistics for Taiwan show that 77, 000 patients with end-stage renal disease (ESRD) regularly received haemodialysis treatment in 2013. Haemodialysis is conducted through an arteriovenous access (AVA) between an artery (radial) and a vein (cephalic), such as an arteriovenous fistula (AVF) or an arteriovenous graft (AVG). However, stenosis, failure and infection of an AVA lead to thrombosis, intimal hyperplasia and aneurysmal deformability, which results in repeated puncturing of the AVA. Volume flow thresholds of <600 ml/min and <400–500 ml/min are, respectively, considered to demonstrate a dysfunctional AVF or AVG [1, 2]. Haemodialysis treatment often results in access stenosis, infection and associated complications, including hypotension and sickness. Therefore this study proposes a non-invasive detector that can screen the degree of AVA stenosis, during haemodialysis treatment.
In the literature [3, 4], bilateral differences in transit time, amplitudes (AMPs) and pulse shapes for vascular diseases estimation are studied by comparing the sinister and dexter thumbs’ photoplethysmography (PPG) signals with the normative pulse ranges, as shown in Fig. 1a. When vascular access becomes stenosis on one side, the bilateral PPG pulses gradually become asynchronous, with each heartbeat. In addition, an AVA has significant inflow or outflow stenosis and there are decreases in the intra-flow. This abnormal and retrograde blood flow occurs in the peripheral artery and microcirculatory system of the ipsilateral hand and fingers, which results in so called arterial steal syndrome [5]. Therefore the ‘rising edge’ of each PPG pulse is a useful parameter of vascular compliance that is associated with changes in blood volume, intra-flow and resistance. Most AVF stenoses are caused by atherosclerosis, which leads to increased resistance in the conduit. Therefore changes in the AMPs of pulse waves and prolonged transit times are observed in bilateral PPG signals [3, 4, 6–8], such as rise time (RT), ΔRT = |RTR–RTL|, as shown in Fig. 1b, and also has highly correlation to the degree of stenosis (DOS) in this study.
Figure 1.
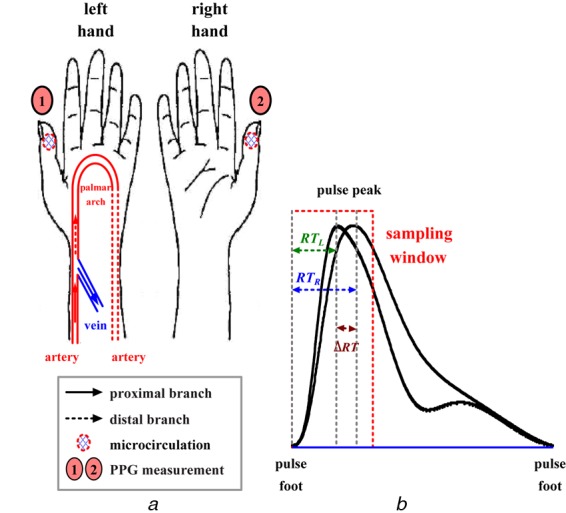
PPG measurement
a Bilateral PPG measurement
b Bilateral differences in rising edge of sinister and dexter thumbs’ PPG signals
To develop an early detector, researchers propose bilateral optical sensing, fractional-order extraction method and cooperative game (CG) screening model to give an on-line tool for physiological measurements. The Sprott system [9] has simple fractional-order differential equations and is used to construct a self-synchronisation error formulation (SSEF) [4, 6–8]. A SSEF is used to extract fractional-order dynamic errors (FODEs) with the bilateral PPG signals, to trace differences in both ΔRTs and AMPs [8]. A polynomial regression is used to perform a least square curve fitting the FODEs and DOS and to quantify the relationship between them. Based on the DOS, AVF dysfunction screening is then formulated as a CG model [10, 11], to provide a decision-making method for evaluating the risk of AVF stenosis. By comparison with the complexity mechanisms, such as support vector machines and artificial neural networks [4, 7, 8], the proposed CG model requires no assignation of an objective function and no optimisation methods to update network parameters. Its mechanism has general probability formulations to express the less parameterised decision reasoning and overcomes the complexity of adjustable mechanisms. The capability of combining the SSEF and CG model allows computers to perform reasoning in a more flexible manner and the prototype screening detector is also easy to implement in an embedded system.
2. Bilateral PPG measurement system
PPG is a non-invasive optical measurement technique that can be used to detect changes in blood volume and blood transport at different body sites, such as the earlobes, the index fingers, the thumbs and the big toes, either bilaterally or unilaterally [3, 4, 6]. A PPG signal carries information about cardiovascular regulation, changes in arterial pulsatile volume and endothelial function [12]. It can be used to evaluate the cardiovascular risk factors, atherosclerosis, arterial stiffness, the properties of arteries and hypertension. Previous studies [3, 4] have found that bilateral (right-to-left) or multi-site measurements increase significantly as the vascular disease gradually evolves. In this study, a PPG probe (transmission mode/reflection mode) that incorporates a light-emitting diode and a photo-detector was mounted within a thumb/finger clip, to detect the thumb's microcirculation blood volume pulsations by temporal analysis of scattered optical radiation, as shown in Fig. 2a. Read and infrared (IR) wavelengths (680–940 nm) are better for measurement of blood flow in the microvascular bed of the tissue. Transmission mode monitors changes in the light intensity via read/IR light through the tissue. This technique allows the vasoconstriction and vasodilatation in vessels smaller than 2.5 mm in diameter to be easily perceived.
Figure 2.
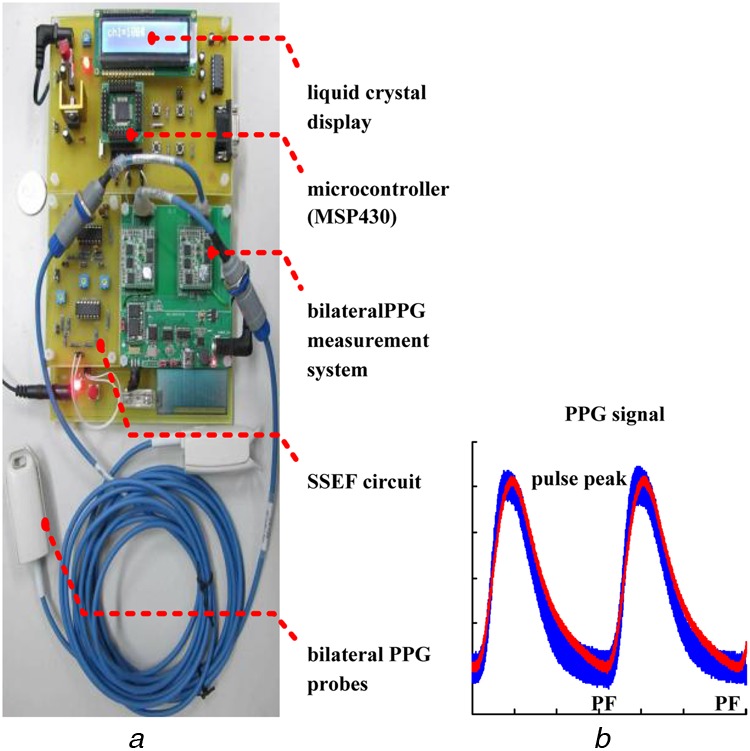
PPG measurement technique
a Bilateral PPG measurement system and prototype screening detector
b PPG signal within sampling window
For bilateral PPG measurements, two channels signals are synchronously captured, at a sampling rate of 1 kHz (data acquisition controller), from the measurement system and passed to an embedded system (MSP430), which provides an analogue-to-digital (A/D) data transfer to a tablet PC for further analysis. The MSP430 also locates each pulse foot (PF) – PF interval, to acquire sampling data within a sampling window, as shown in Fig. 2b. This allows continuous measurement and temporal analysis during haemodialysis treatment.
3. Methodology description
3.1. Fractional-order self-synchronisation error
If the inflow or outflow stenosis of an AVF becomes exacerbated, there may be insufficient blood flow for haemodialysis, which results in abnormal flow in the venous system or in the micro-circulation system. A quantitative method, using the self-synchronisation error, is used to represent the differences in the RT and AMPs of bilateral PPG signals. Therefore a Sprott system, which consists of a master system as a reference and a slave system, is used to design a SSEF, as shown in Fig. 3a and is defined by
| (1) |
| (2) |
where [y1m, y2m, y3m] and [x1s, x2s, x3s] are right- and left-hand side PPG signals and sign is the sign function. If the error variables are defined as e1 = (y1m − x1s), e2 = (y2m − x2s), e3 = (y3m − x3s) and e = [e1, e2, e3]T, by subtracting (2) from (1), the dynamic error system becomes
| (3) |
Figure 3.
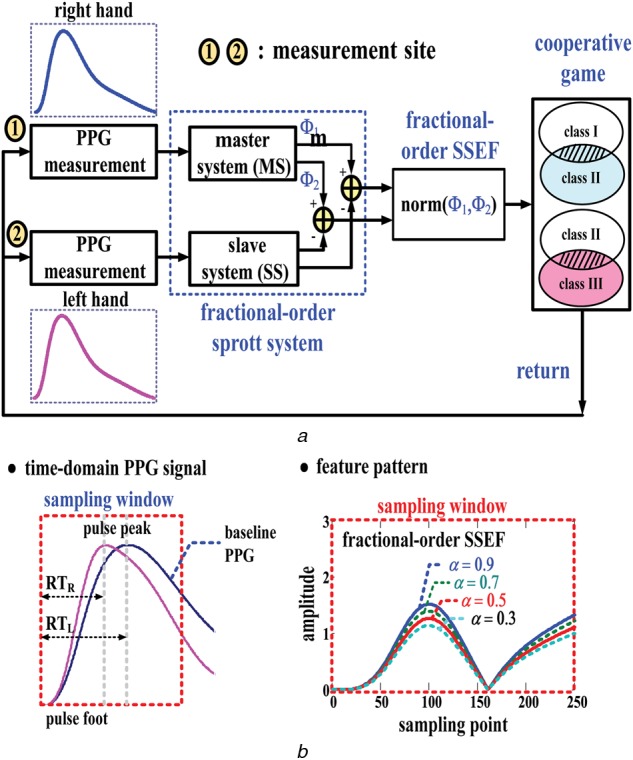
Fractional-order self-synchronisation error model
a Block diagram of proposed screening model
b Fractional-order feature patterns
If both y1m and x1s ≥ 0 or y1m and x1s < 0, [sign(y1m)−sign(x1s)] = 0, hence a linear system is derived by decoupling variable e1 from (3), which becomes
| (4) |
subject to system parameters, a > 0 and b > 0 [7, 8].
According to the Grünwald–Letnikov (GL) fractional approximation, a general fractional-order differentiation formulation can be expressed as [13]
| (5) |
If the parameter, 0 < α < 1 and (5) defines the fractional rate of change of the function e(t), the fractional-order error dynamics of (4) can be simplified using the fractional-order derivatives, as
| (6) |
where (t–t0) and t points are geometric approximations of the αth derivative and the product of the slope between the curves and (Δt)α is loosely a geometric interpretation of a part of the fractional derivative or fractional rate.
In this study, the fractional-order SSEF is used to extract FODEs from bilateral PPG signals. The discrete PPG signals from hands with arteriovenous malformation are referred to as vs; x2s = vs[i] and x3s = vs[i + 1] and those from healthy hands are referred to as vm; y2m = vm[i] and y3m = vm[i + 1], i ∈ [1, n – 1]. The fractional time, Δt, is the number of sampling points, Δt = (i + 1)–i, i ∈ [1, n – 1]. Therefore (6) can be transformed to the following fractional-order SSEFs
| (7) |
| (8) |
where the error variables are e2[i] = vm[i] − vs[i], e3[i] = vm[i+1] − vs[i+1], e2[i − 1] = vm[i − 1] − vs[i − 1], e3[i − 1] = vm[i] − vs[i], i = 1, 2, 3, …, n and the initial conditions are vm[0] = vs[0] = 0.
3.2. Fractional-order feature patterns
FODEs, Φ1 and Φ2, are used as quantisers, to extract the FODEs using (7) and (8), as shown in Fig. 3b. The DOS is quantified, using the index, Ψ, hence the norm of (Φ1, Φ2) can be represented as
| (9) |
where max{Φ1[i]}, Φ1 ∈ Rn−1 and max{Φ2[i]}, Φ2 ∈ Rn−1. The DOS confirms the standard degrees from ultrasound imaging techniques, which is defined as [14]
| (10) |
where D is the diameter of a normal vessel in the direction of blood flow and d is the diameter of the stenosis lesion. Therefore the values of the index, Ψ, increase as the stenosis becomes worse, in the risk assessment for AVFs.
Equations (7) and (8) can also be expressed using integrators and the four fundamental arithmetical operations: adders, subtractors and multipliers. This study uses the fractional-order SSEFs in the feature extractor, using non-linear electronic circuits, such as operational amplifiers and RC circuits. Of these, an inverting or non-inverting closed-loop configuration with an infinite gain is used to implement a proportional-amplifier, to adjust the system parameters, a, αa, b and αb. The sum of (7) and (8) is then completed by a summing amplifier circuit, by adjusting the closed-loop gain (the gain is unity).
3.3. CG-based screening model
Game theory is a mathematical model for cooperation or non-cooperation applications. It uses the independent actions of several agents, who may be individuals, multiple agents or any combination of these. It provides a language for decision-making and analyses strategic scenarios. The normal form of a CG can be succinctly represented by a matrix, which shows the agents, the strategies and the payoffs, as shown in Fig. 4a. Each agent chooses either ‘Defection (D)’ or ‘Cooperation (C)’. For example, for two agents, the combination is s1(D, D), s2(D, C), s3(C, D) and s4(C, C). The evolutionary dynamics for cooperation and defection have inverse payoffs, as shown in Fig. 4b, and a screening model is developed by integrating the objective probability, using Bayesian rules [15].
Figure 4.
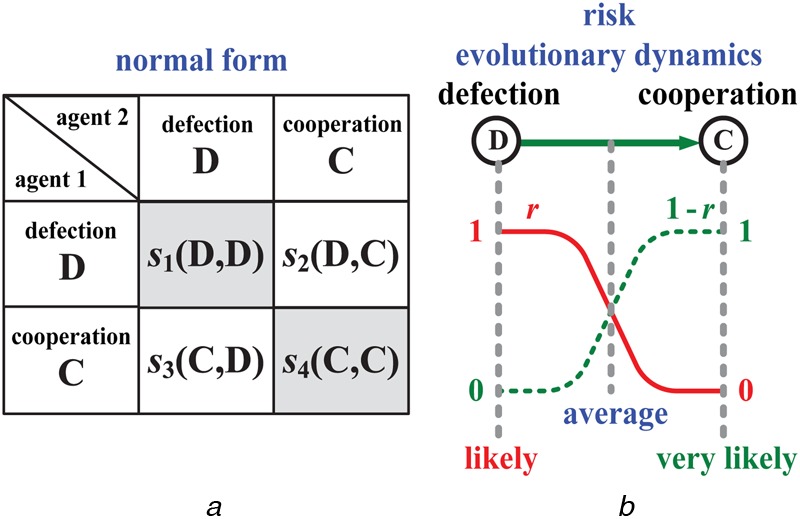
CG model
a Normal form of CG
b Evolutionary dynamics of strategic scenario
The statistical data for 42 patients with a mean age of 69.4 ± 13.1 years were used to design the screening model. The overall patients enrolled in this study consist of haemodialysis patients (27 males and 15 females). Base on haemodialysis treatment years, patients were divided into three groups: (a) <1 year with low peripheral vascular disease (PAD) risk; (b) <10 years with PAD risk; (c) >10 years with PAD risks. These were selected from the Institutional Review Board (IRB) of Kaohsiung Veterans General Hospital (KVGH), Tainan Branch, under contract number: VGHKS13-CT12-11. Within the 30 data sets that were compiled for the screening model, 12 sets were randomly selected, to validate the proposed screening model. All of the participants had an AVF and consented to undergo follow-up examinations. Equations (7) and (8) are utilised to calculate the FODEs, using the system parameters, a = 2 and b = 1, subject to a > 0 and b > 0 and α = 0.9, which quantify the relationship between the FODEs and the DOS, as shown in Fig. 5. If an AVF stenosis is an irreversible symptom, three risk levels are determined within specific ranges, in terms of the DOS, where Class III: DOS > 0.5, Class II: 0.3 < DOS < 0.5 and Class I: DOS < 0.3 [13], as seen in Fig. 5. In terms of the evolutionary dynamics from Risk 1 to Risk 3, evolutions might be a combination of the decreased probability of the current function (Risk 1 and Risk 2) and the increased probability of dysfunction (Risk 1 → 2 and Risk 2 → 3). Therefore each risk's payoff can be expressed as a probability function, as
| (11) |
| (12) |
| (13) |
Figure 5.
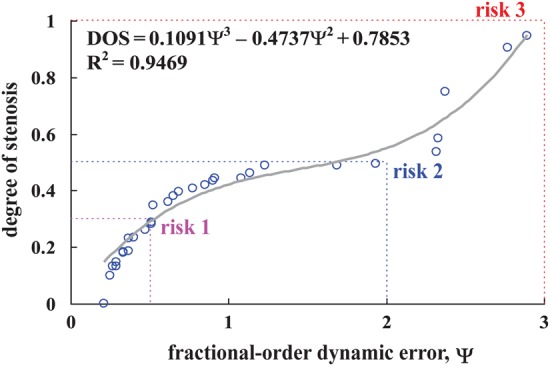
DOS versus FODE
The three risks can be represented as r1(Ψ) for Risk 1, r2(Ψ) for Risk 2 and r3(Ψ) for Risk 3, in term of the DOS. Their conflicting payoffs are and . The related parameters for this study are shown in Table 1.
Table 1.
Related parameters for the three risk levels
If each pair of risks conflict and the three risks are independent, the evolutionary dynamics of three risks are represented by the following two games:
- Game I: Risk 1 (D) and Risk 2 (C) are independent if and only if their joint probability is multiplication. The normal form of Game I is defined by a matrix
where and are conflicting actions: and . The payoff, , is a relevant combination for Risk 1, which is satisfied by the inequality, . The payoff, , for Risk 2, is satisfied by the inequality, , and the payoff for Risk 1→2 is satisfied by inequalities, and . When payoffs, , is the ‘equilibrium point’, as shown in Fig. 6a.(14) - Game II: Risk 2 (D) and Risk 3 (C) are independent. The normal form is given by
(15)
Figure 6.
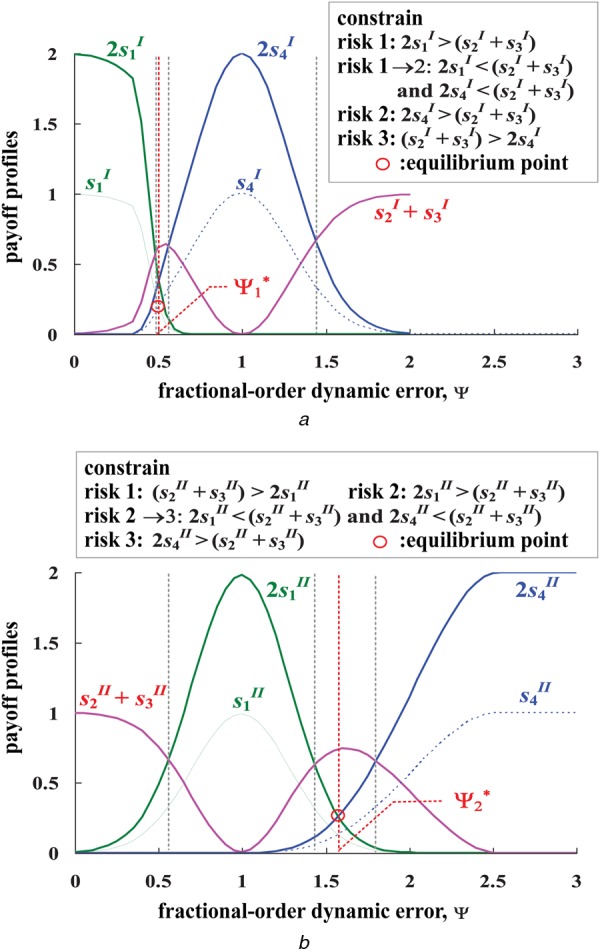
Payoff profiles and inference rules
a Payoff profiles of Game I and inference rules
b Payoff profiles of Game II and inference rules
The payoffs for Risk 1 to Risk 3 are satisfied by the inequalities, as shown in Fig. 6b. When payoffs, , is the ‘equilibrium point’.
For risk screening, the maximum composite operations are used to generate the possible result, S+, as
| (16) |
where m = 1, 2 and 3: m = 1 for Risk 1, m = 2 for Risk 2 and m = 3 for Risk 3. The inference mechanism for dysfunction screening in each game is satisfied by these inequalities, as
likely: s1 > s4 and 2s1 > (s2+s3);
average: s1 > s4 or s1 < s4, 2s1 < (s2+s3) and 2s4 < (s2+s3);
very likely: s1 < s4 and 2s4 > (s2+s3).
4. Experimental results
For the bilateral PPG measurement, the subjects relaxed for 10 min. The room temperature was set at 25 ± 1°C. The bilateral PPG signals were obtained using a data acquisition controller (MSP430) from the measurement system and a tablet PC. A computer-assisted system was also designed, to provide physicians with a tool for signal processing and stenosis screening. The graphic user interface of the prototype used LabVIEW graphical programming (National InstrumentsTM Corporation, Austin, Texas, USA) and Matlab software (Mathwork, Natick, Massachusetts, USA). Two PPG probes were placed on the sinister and dexter thumbs and the time-domain PPG signals are shown in Fig. 7a. Using (7) and (8), the FODEs between the sinister and dexter thumbs’ PPG signals, Φ1 and Φ2, can be calculated, as shown in Fig. 7b. Therefore the norm of (Φ1, Φ2) can also be calculated using (9), for each detection cycle, as shown in Fig. 7c. Numerical tests and methodological comparisons are presented to demonstrate and verify the present design.
Figure 7.
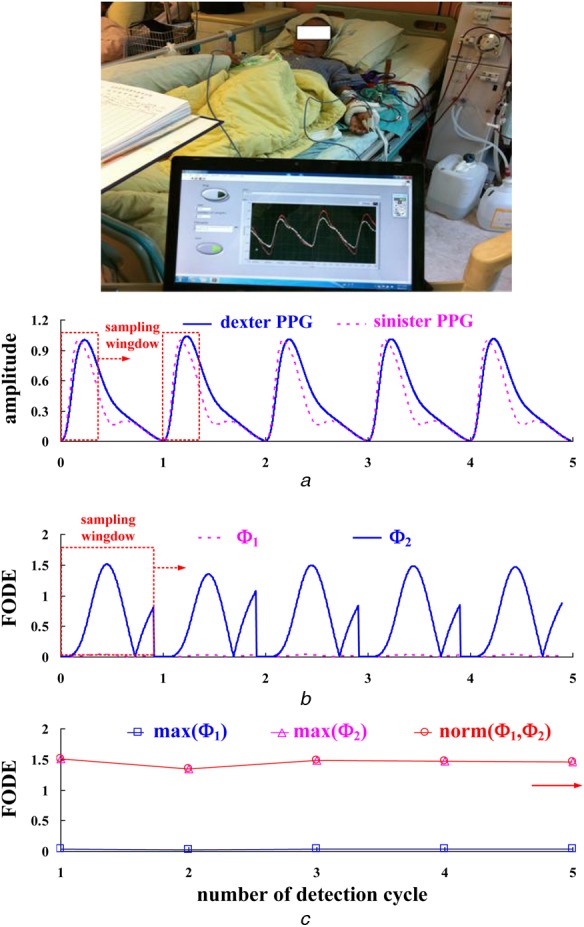
Practical bilateral PPG measurements
a Time-domain PPG signals
b FODEs, Φ1 and Φ2, at each detection cycle
c Maximum FODEs and norm of FODEs at each detection cycle
4.1. Numerical tests
The proposed screening model was verified using 12 data sets for patients with ESRD. The test results for six patients are shown in Table 2, in which the index, Ψ = 0.6540, and DOS = 0.3791. The CG-based decision-making models for the two games are constructed as
Step 1: for the given related parameters for the three risk levels, the probabilities, r1, r2 and r3, and the conflicting probabilities, and can be calculated using the probability functions.
Step 2: the payoffs for Game I and Game II are calculated using (14) and (15), and .
Step 3: The maximum payoff is determined using (16): and , with the constraint conditions: and .
Step 4: the possible result, S2+ = max(0.5036, 0.5060) = 0.5060. The inference profiles are shown in Fig. 6.
Table 2.
Numerical tests of six patients with ESRD
| No. | D, cm | d, cm | DOS | Vp, m/sec | Vm, m/sec | Resistive (Res) | hsCRP, mg/L | Ψ | CG decision-making | |
|---|---|---|---|---|---|---|---|---|---|---|
| 1 | 0.768 | 0.236 | 0.9055 | 0.372 | 0.048 | 0.8709 | 9.104 | 2.7705 | (0.0000, 0.0000) | (0.0000, 0.8968) |
| S3 = 0.8968, Risk 3 | ||||||||||
| 2 | 0.883 | 0.444 | 0.7471 | 0.660 | 0.072 | 0.8909 | 1.682 | 2.3775 | (0.0000, 0.0000) | (0.0000, 0.9492) |
| S3 = 0.9492, Risk 3 | ||||||||||
| 3 | 1.280 | 0.94 | 0.4607 | 1.220 | 0.140 | 0.8852 | 9.909 | 1.1400 | (0.0000, 0.8946) | (0.8772, 0.0020) |
| S2 = 0.8946, Risk 2 | ||||||||||
| 4 | 1.080 | 0.851 | 0.3791 | 0.853 | 0.300 | 0.6480 | 1.005 | 0.6540 | (0.0027, 0.5036) | (0.5060, 0.0003) |
| S2 = 0.5060, Risk 2 | ||||||||||
| 5 | 0.961 | 0.812 | 0.2860 | 0.985 | 0.240 | 0.7563 | 0.830 | 0.5120 | (0.1705, 0.1990) | (0.2583, 0.0001) |
| S2 = 0.2583, Risk 1→2 | ||||||||||
| 6 | 1.710 | 1.450 | 0.2809 | 1.200 | 0.504 | 0.5800 | 6.182 | 0.5115 | (0.1721, 0.1979) | (0.2576, 0.0001) |
| S2 = 0.2576, Risk 1→2 | ||||||||||
Note: Res = (Vp−Vm)Vp, where Vp is the PSV and Vm is the PDV, according to the acoustic Doppler measurement
The proposed CG-based screening model verifies the ‘Class II’ level. Satisfying the specific inequalities, the trend shows that the probabilities, and , increase and become ‘very likely’ for level ‘Risk 2’, as shown in Fig. 6. In addition, this case study is a patient with AVF mediate stenosis and PAD risk, the peripheral resistance will be increased or the peripheral will be vascular occlusive, hence bilateral PPG signals becoming asynchronous at the sinister and dexter thumbs, as shown in Fig. 7a. Changes in the AMPs of PPG signals and prolonged transit time delay indicate the vascular access stenosis severity. Therefore the norm of FODEs will increase, as shown in Fig. 7c.
4.2. Methodological comparisons
Acoustic measurement, a commercial Doppler flow-meter with 7.5 MHz frequency can be used on vessels with a diameter of 5 to 12 mm. Therefore, velocity flows, peak-systolic velocity (PSV), peak-diastolic velocity (PDV) and heart rate can be monitored. In this study, Doppler flowmeter was used to obtain the PSV and the PDV at the near venous anastomosis site (V site). Then resistive (Res) index is calculated, as shown in Table 2. This reflects vascular resistance and the change in flow volume due to a change in pressure, in in–vivo studies. The PDV causes a decrease in Vm, hence the value of the Res index exceeds 0.65 [16]. The normal range for an ordinary vessel is 0.50–0.65. Higher values indicate cardiovascular disease or vascular stenosis. However, the measurement sites (inflow site/outflow site), quantification errors and undetected narrowed access could affect the efficiency of the Doppler flowmeter. The multiple-site haemo-dynamic analysis of Doppler ultrasound [17] can overcome the drawbacks for vascular access stenosis evaluation in routine examinations. Its device is not suitable for early detection or homecare applications by the patients themselves.
In clinical examinations, high sensitivity C-reactive protein (hsCRP) values between 0.00 and 6.00 mg/l are also used to evaluate the risk of cardiovascular diseases, atherosclerosis, endothelial dysfunction and Type 2 diabetes. The specific degrees: <1 mg/l for low risk, 1–3 mg/l for average risk, 3–6 mg/l for high risk, are defined by the American Heart Association [18]. In this study, serum hsCRP was measured using the Unicel® DxC 600, synchron clinical system (Beck-Man Coulter, Inc., USA). For patients with AVF stenosis and diabetes mellitus, the linear regression can be used to quantify the relationship between the FODEs, Ψ and the hsCRP, as hsCRP = 1.8595 × Ψ − 0.3739 (R2 = 0.5080). However, this value is easily affected if a patient has myocardial infarction, infection (pneumonia or osteitis) and after percutaneous transluminal angioplasty/surgery intervention. Therefore infection and infraction factors (hsCRP > 6 mg/l) must be excluded. Table 2 shows that the FODEs are strongly associated with the degree of AVF stenosis. The differences in RT and AMPs for both sides are quantified using the FODE, Ψ and are positively correlated with the DOS. The specific ranges between 0 and 3 are divided into three risk levels for AVF dysfunction screening.
5. Conclusion
To verify the proposed method, patients with ESRD are tested, using physiological measurement. 32 sets of measurement data are used to design the proposed screening model. For six randomly selected patients, the test results show that the proposed model is highly accurate. Comparisons of the proposed method with decisions by physicians, ultrasound imaging, Doppler flowmeter and hsCRP show that the proposed method is more efficient in clinical applications. The proposed detector is used for screening and decision-making rules are represented using CG models. The degree is divided into three risk categories, which determine the level of stenosis. An embedded system can be used to perform specific functions, including control, signal processing and screening applications. A portable detector for AVF dysfunction screening during haemodialysis treatment is now possible. This proposed tool might also be integrated into an existing medical device to screen the risk level.
6. Funding and declaration of interests
This work was supported in part by the Ministry of Science and Technology, Taiwan, under contract number: MOST 103-2221-E-244-001, duration: 1 August 2014 – 31 July 2015. Research involving human participants and the Institutional Review Board (IRB) of the Kaohsiung Veterans General Hospital, Tainan branch, was approved under contract number: VGHKS13-CT12-11. Conflict of interest: none declared.
7 References
- 1.Karkar A.: ‘Caring for patients with CRF: rewards and benefits’, Int. J. Nephrol., 2011, Article ID 639840, pp. 1–6 (doi: ) [DOI] [PMC free article] [PubMed] [Google Scholar]
- 2.Wizemann V., Wabel P., Chamney P., et al. : ‘The mortality risk of overhydration in hemodialysis patients’, Nephrol. Dial. Transplant, 2009, 24, (5), pp. 1574–1579 (doi: ) [DOI] [PMC free article] [PubMed] [Google Scholar]
- 3.Allen J., Oates C.P., Lees T.A., Murray A.: ‘Photople-thysmography detection of lower limb peripheral arterial occlusive disease: a comparison of pulse timing, amplitude and shape characteristics’, Physiol. Meas., 2005, 26, pp. 811–821 (doi: ) [DOI] [PubMed] [Google Scholar]
- 4.Li C.-M., Du Y.-C., Wu J.-X., et al. : ‘Synchronizing chaotification with support vector machine and wolf pack search algorithm for estimation of peripheral vascular occlusion in diabetes mellitus’, Biomed. Signal Process. Control, 2014, 9, pp. 45–55 (doi: ) [Google Scholar]
- 5.Leon C., Asif A.: ‘Arteriovenous access and hand pain: the distal hypoperfusion ischemic syndrome’, Clin. J. Am. Soc. Nephrol., 2007, 2, (1), pp. 175–183 (doi: ) [DOI] [PubMed] [Google Scholar]
- 6.Buchs A., Slovik Y., Rapoport M., Rosenfeld C., Khanokh B., Nitzan M.: ‘Right-left correlation of the sympathetically induced fluctuations of photoplethy-smographic signal in diabetic and non-diabetic subjects’, Med. Biol. Eng. Comput., 2005, 43, pp. 252–257 (doi: ) [DOI] [PubMed] [Google Scholar]
- 7.Wu J.-X., Lin C.-H., Du Y.-C., Chen T.: ‘Sprott chaos synchronization classifier for diabetic foot peripheral vascular occlusive disease estimation’, IET Sci. Meas. Technol., 2012, 6, (6), pp. 533–540 (doi: ) [Google Scholar]
- 8.Li C.-M., Du Y.-C., Wu J.-X., Lin C.-H., Ho Y.-R., Chen T.: ‘Dynamic analysis with a fractional-order chaotic system for estimation of peripheral arterial disease in diabetic foot’, Meas. Sci. Technol., 2013, 24, (8) (doi: ) [Google Scholar]
- 9.Kuo C.-L., Lin C.-H., Yau H.-T., Chen J.-L.: ‘Using self-synchronization error dynamics formulation based controller for maximum photovoltaic power tracking in micro-grid systems’, IEEE J. Emerg. Sel. Top. Circuits Syst., 2013, 3, (3), pp. 459–467 (doi: ) [Google Scholar]
- 10.Doebeli M., Hauert C.: ‘Models of cooperation based on the Prisoner's Dilemma and Snowdrift game’, Ecol. Lett., 2005, 8, pp. 748–766 (doi: ) [Google Scholar]
- 11.Nowak M.A.: ‘Five rules for the evolution of cooperation’, Science, 2006, 314, (8), pp. 1560–1563 (doi: ) [DOI] [PMC free article] [PubMed] [Google Scholar]
- 12.Cowan D., Stevens A.L., Roberts V.C.: ‘Design of a continuous-wave Doppler ultrasonic flowmeter for perivascular application: part2 signal processing system’, Med. Biol. Eng. Comput., 1988, 26, (2), pp. 153–160 (doi: ) [DOI] [PubMed] [Google Scholar]
- 13.Podlubny I.: ‘Fractional differential equations’, in ‘Mathematics in science and engineering’ (Academic Press, New York, 1999), vol. 198, Chapter 6 and 10 [Google Scholar]
- 14.Chen W.-L., Kan C.-D., Lin C.-H., Chen T.: ‘A rule-based decision-making diagnosis system to evaluate arteriovenous shunt stenosis for hemodialysis treatment of patients using Fuzzy Petri nets’, IEEE J. Biomed. Health Inf., 2014, 18, (2), pp. 703–713 (doi: ) [DOI] [PubMed] [Google Scholar]
- 15.Kadane J.B., Larkey P.D.: ‘Subjective probability and the theory of game’, Manag. Sci., 1982, 28, (2), pp. 113–120 (doi: ) [Google Scholar]
- 16.Fish P.: ‘Physics and instrumentation of diagnostic medical ultrasound’ (Joon Wiely & Sons Ltd.), ISBN 0-471-92651-5 [Google Scholar]
- 17.Wu J.-X., Du Y.-C., Wu M.-J., Li C.-M., Lin C.-H., Chen T.: ‘Multiple-site hemodynamic analysis of Doppler ultrasound with an adaptive color relation classifier for arteriovenous access occlusion evaluation’, Sci. World J., 2014, 2014, p. 13. [DOI] [PMC free article] [PubMed] [Google Scholar]
- 18.Ridker P.M.: ‘Clinical application of C-reactive protein for cardiovascular disease detection and prevention’, Circulation, 2003, 107, pp. 363–369 (doi: ) [DOI] [PubMed] [Google Scholar]


