

Abstract
The challenge of heart rate monitoring based on wrist photoplethysmography (PPG) during heavy exercise is addressed. PPG is susceptible to motion artefacts, which have to be mitigated for accurate heart rate estimation. Motion artefacts are particularly apparent for wrist devices, for example, a smart watch, because of the high mobility of the arms. Proposed is a low complexity highly accurate heart rate estimation method for continuous heart rate monitoring using wrist PPG. The proposed method achieved 2.57% mean absolute error in a test data set where subjects ran for a maximum speed of 17 km/h.
Keywords: photoplethysmography, body sensor networks, patient monitoring, watches, medical signal processing
Keywords: lightweight wrist photoplethysmography, heavy exercise, motion robust heart rate monitoring algorithm, motion artefacts, accurate heart rate estimation, smart watch, low complexity-highly accurate heart rate estimation, mean absolute error, test data set
1. Introduction
Photoplethysmography (PPG) has been used in clinical settings for measuring cardiovascular functions such as heart rate and arterial blood oxygen saturation for decades. Optical measurement techniques permit patients to be monitored comfortably and non-invasively without the need for electrodes and accompanying skin preparation methods. Along with its low manufacturing cost, these merits of PPG led to its early integration into mobile devices such as smartphones providing heart rate measurements for consumers [1]. Despite the ubiquity of smartphones, wearable devices deliver an even more natural, non-intrusive and seamless user experience. With the recent introduction of PPG-equipped wearable devices, such as smart watches, continuous heart rate monitoring has become feasible, thereby enabling users to effortlessly achieve personal wellness goals.
The optical nature of PPG sensors, however, renders the measurements susceptible to motion artefacts from variable and discontinuous contact between the device and skin. Mitigating such motion artefacts has been one of the major research topics in PPG-based heart rate monitoring. A number of experiments have been designed to incorporate mild magnitudes of motion, from involuntary finger motion, to walking or jogging [2–4]. Others have evaluated the effects of intense exercise such as uphill running at high speeds (16 km/h) [5]. Methods based on the use of adaptive noise cancellation [4] or filtering [6], signal decompositions such as Fourier spectrum [3], heuristic methods [5], singular value decomposition, independent component analysis (ICA) [7, 8] and constrained ICA [9] have been proposed. In most methods, motion information based on accelerometers are used to provide additional means for separating motion and heart rate signals, with the exception of the work by Lopez et al. detailing a heuristic method where motion artefacts were dissociated from cardiac signals solely on the basis of a single PPG signal without the use of an accelerometer [6]. Such algorithms have enabled wearable PPG heart rate monitoring to become realisable. The locations at which PPG signals are measured range from fingertips, ears and forehead, while others have looked into obtaining measurements at the wrist using watch-type devices. However, motion artefacts are particularly strong and frequently encountered in watch-type devices due to high mobility associated with the arms. In addition, for a watch device that may be paired to a smartphone, low-complexity methods are more desirable and fit the constrained hardware resources on the wearable device side (e.g. watch) and also for the paired device (i.e. smartphone) owing to the multi-tasking features that consumers are liable to utilise.
Here, a lightweight and robust heart rate monitoring method is proposed for PPG measurements by means of a watch form-factor device. The lightweight method achieved a mean absolute error of 2.57% during heavy exercise. To better simulate the real world running experience and yet push the technology limits, the experimental protocol entailed intense running exercises with maximum speeds of 17.5 km/h with additional pacing requirements and arm movements [10]. The computational complexity [11] per second of the proposed method is dominated by the complexity O(L log L) of computing a fast Fourier transform, where the window size L can be as small as 100 with an error <5%.
In Section 2, the proposed method and algorithms developed are detailed. The PPG-embedded watch device and the experimental protocol are introduced in Section 3, followed by the results in Section 4. Section 5 concludes this paper.
2. Algorithm design
The algorithm takes streaming PPG and accelerometer data as inputs, as illustrated Fig. 1, and an example of step-by-step results is shown in Fig. 2. There are four sets of algorithms as the building blocks of the proposed method:
preprocessing,
signal representation using short-time Fourier transform,
detection and ranking of potential cardiac and motion components, and
robust heart rate estimation.
Figure 1.
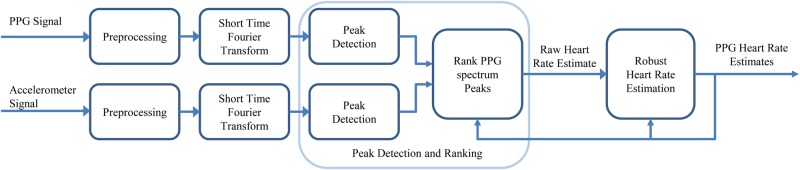
System diagram of proposed method
The proposed method contains four components: preprocessing, signal representation using short-time Fourier transform, detection of PPG and motion peak and rank PPG peaks as potential cardiac signal which outputs a raw heart rate estimate, and the Robust heart rate estimation
Figure 2.

Diagrammatic representation of the algorithmic steps of the motion robust heart rate monitoring algorithm
a There is baseline wandering in raw PPG signal (note that the figure is magnified between 200 and 215 s)
b Baseline wandering is removed by applying bandpass filtering (see text)
c PPG spectra have apparent motion artefacts that can be compared with motion spectra computed from accelerometer signal shown in d
e In each spectra, five peaks with highest energy are shown
f Three motion peaks with highest peak are shown where motion leads to high energy peaks in both channels
g Scores of peaks across PPG spectra are shown
h Frequency, in beats per minute, of peak with highest score is selected as raw heart rate estimate, which contains a few errors
i Robust heart rate leads to highly accurate results
Except for the preprocessing, which is done continuously, the other steps operate on each signal segment of L samples, while two consecutive segments have an overlap of M samples.
2.1. Preprocessing
In the raw PPG signal, a large DC component and baseline wandering can be observed as shown in Fig. 2a. Both can be removed continuously by applying an infinite impulse response bandpass filter. Examples of such filters are Butterworth filters with an order of <10 with a passband from 0.5 to 30 Hz.
2.2. Signal representation using short-time Fourier transform
The filtered signal is then processed segment by segment. For each segment, the Fourier spectrum is computed. Instead of storing the entire spectrum, only the frequency range within which human heart rate falls are stored. Motion artefacts corresponding to periodic footsteps and arm movements with harmonics can be recognised by comparing the resulting PPG spectrum and the motion spectrum as shown in Fig. 2b. Note that in addition, there are other motion artefacts that appear less dominant in the motion spectrum, but are strongly represented in the PPG spectrum.
In the PPG spectrum, there is also a trend of baseline energy gradually decreasing from low frequency to high frequency. Such baseline trends can be removed using a 1/fq model.
2.3. Detection and ranking of potential cardiac and motion components
There are a total of Np and Nm peaks detected in each PPG and motion spectrum, respectively. For each PPG peak at time t, whose frequency is denoted as HRi(t), three scores are computed:
E(HRi(t)) is the normalised energy of the peak relative to the largest component, peak or total energy, such that all cases are identical up to a constant scaling. Normalisation by the largest component was used in experiments presented in this paper due to it having the lowest complexity.
- M(HRi(t)) is a measure of the closeness of HRi(t) to a motion peak of the segment by first computing
where ARj(t) denotes the frequencies of motion peaks at time t and is a robustness parameter enforcing M*(HRi(t)) > 0 such that when motion occupies the same frequency as the heart rate, the term is not zero. Then(1)
where Cm is a parameter reducing the score of a PPG peak whose frequency is close to a motion peak in the accelerometer channel.(2) D(HRi(t)) is a function measuring how close the peak is to previously estimated heart rates. In particular, D is chosen to be Gaussian with the median and variance of five preceding heart rate estimates as the mean and the variance. Note that using the mean of preceding heart rate estimates as the mean of D may be less robust to estimation error. For initialisation, baseline heart rate measured prior to exercise is used.
The final score of the PPG peaks is computed as
| (3) |
Thus, the algorithm favours PPG peaks that are represented with comparatively high energy and are different from motion frequencies while consistent with previous heart rates. The frequency of the selected peak is defined as the raw heart rate estimate, and denoted as rHR, where r highlights raw estimates.
2.4. Robust heart rate estimation
There are, however, cases where these raw heart rate estimates, computed in Section 2.3, may be erroneous owing to the severity of extraneous noise, and the method should be robust to such raw estimation error. In the final step, the robust heart rate estimate is updated based on the difference between rHR(t) and HR(t − 1) denoted as
| (4) |
The larger the magnitude of this difference, the smaller the update. The final heart rate estimate is computed in accordance to a penalty function or a set of logical rules implementing such a concept, illustrated in Fig. 3, with the form that if
| (5) |
then
| (6) |
and
| (7) |
then
| (8) |
where defines regularisation intervals within which the update from HR(t − 1) to HR(t) is bounded by . The w ∈ {1, …, W} is the index of the rules, and + and − highlight the needs of different rules for increases and decreases in heart rate estimates, with a special case that . It is empirically observed that heart rate may raise steeply in a rapid manner but slow down more gradually, and that, for a better result, tends to be larger than , and the intervals defined by also tend to be wider than intervals defined by . Also, enforces a smaller update when the difference, dHR(t) gets large.
Figure 3.
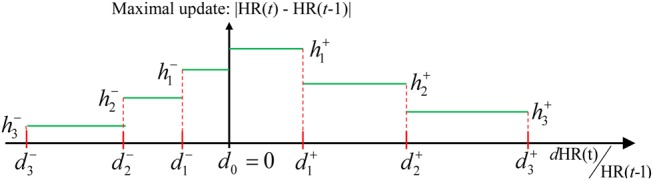
Illustration of robust heart rate estimation rules
The maximal update allowed is bounded according to the difference of the current raw estimate and previous heart rate estimates
Computational complexity is lower when converting a penalty function to logical rules of the aforementioned form.
Note that this step is different from choosing a function D heavily favouring PPG peaks close to the previous heart rate from the earlier step. Such a function tends to result in narrower heart rate estimates, making it less adaptive to heart rate changes and less robust to errors in earlier heart rate estimates. On the other hand, with a moderate D and a robust step, the algorithm can still choose the correct PPG peak despite previous errors and gradually update the final estimates back to the accurate value.
2.5. Algorithm complexity
The computational complexity of each step per segment, or per second, is low:
Preprocessing has a computational complexity of O(K) per second, where K is the sampling rate.
Computing Fourier spectrum has a complexity of O(L log(L)) per second, where L = TK is the window size and T is the window length in seconds, depending on the specific transformation algorithm being used.
Detection of localised peaks has a complexity that is dominated by O(μ(Np + Nm)K) per second, where μ is the ratio between the number of frequency components of interest (typically between 45 and 206 bpm) against the window size where, in most cases, r < 0.2 for a sampling rate of 100 Hz and segment length L > 500. Also, (Np + Nm) ≤ 10 based on the experimental results in this study. Thus the complexity of this step can be simplified as being linear in the sampling rate K.
The complexity of selection among peaks and the robust heart rate estimates is negligible compared with other steps, especially if the robust estimate is obtained by defining a short list of simple rules. In our empirical case, the number of rules is <8.
It can be concluded that step 2 of computing the FFT with a complexity of O(TK log(TK)) per second dominates the overall complexity, compared with O(K) in the other steps.
3. Experimental protocol and hardware
In previous studies, the exercise protocol is rather monotonous, such that the subjects are asked to exercise while following a simple increase and decrease in the intensity of the protocol, during which the heart rate tends to also follow a unimodal pattern.
Here, the running experiment is designed with extra complexity, during which the heart rate is expected to accelerate and decelerate at least twice. Additional arm actions are incorporated into the protocol to simulate real world running experiences.
3.1. Experimental protocol
The experiments were conducted on a treadmill, where speed was adjusted and measured according to the protocol requirements. The protocol consists of seven steps as shown in Fig. 4:
An optional warm-up period being recorded, where a subject may choose to warm-up offline. This corresponded to different user preferences as to when to begin the monitoring period.
- Running at 9 km/h for 150 s, during which a set of actions (e.g. arm movements) occur for half of the participants:
- 2.1 At the 30th second, lift the arm and look at the watch device for 10 s.
- 2.2 At the 60th second, use the device-wearing arm to adjust clothing and wipe sweat for 10 s.
- 2.3 At the 90th second, repeat steps 2.1 and 2.2 for 10 s.
Speed up to at least 17 km/h, half of the subjects, or 15 km/h within 30 s.
Maintain such speed for 30 s.
Reduce the speed to half of the top speed for 30 s.
Speed up again up to 15 km/h or higher within 30 s.
Reduce the speed to stop based on the subject's preferred pacing.
A three-lead one-channel electrocardiogram (ECG) device was used to collect the reference data for comparing the PPG heart rate results. A mobile app was designed to simultaneously record both the ECG and the PPG signal with synchronised starting and terminating points and POSIX timestamp. Both raw ECG and PPG signals were transferred without any filtering or preprocessing.
Figure 4.
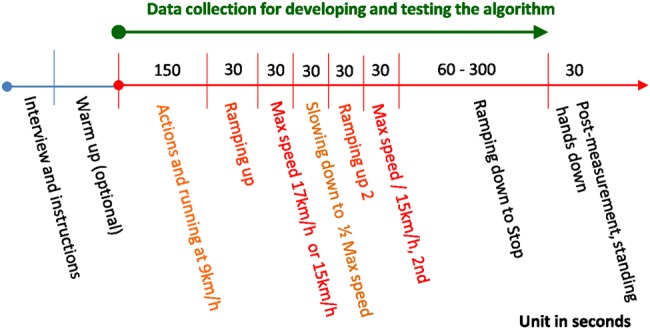
Illustration of the experimental protocol, where half of the subjects ran faster than 17 km/h during the heaviest part of the protocol
Ten male volunteers (age range, 29–47 years) participated in the experiment. Their ethnicities are Caucasian (4), East Asian (2) and Middle Eastern/Indian (4). Four subjects maintained a regular fitness regimen that entailed marathon training routines. Baseline heart rate measured in the standing position prior to running ranged from 54 to 108 beats per minute.
3.2. Hardware configuration
The wrist devices used in this study are shown in Fig. 5, the body of the watch (Fig. 5a) is 5 cm long, 2.5 cm wide and its thickest part is 0.9 cm while the thinnest part is 0.3 cm. The watch strap was made of non-stretchable rubber. The PPG sensor (Fig. 5b) consisted of two different wavelengths [565 nm (green) and 590 nm (amber yellow)] with two light-emitting diodes (LEDs) each and one photo-detector, placed at the centre of the bottom case of the device (5 × 5 mm2) in order for the sensor to maintain direct contact with the user's skin. Three accelerometers measuring orthogonal directions were built into the device to capture motions. The device is rechargeable through micro USB and an adapter clipped around the watch. The sampling rate is 100 Hz, and the data collected by the wrist device can be transmitted to a recording mobile device or a laptop via Bluetooth connection. A three-channel ECG amplifier from Cognionics (San Diego, CA, USA) was used to collect reference heart rate during the experimental protocol with a sampling rate of 500 Hz. The data was transmitted to the same device as the PPG data.
Figure 5.
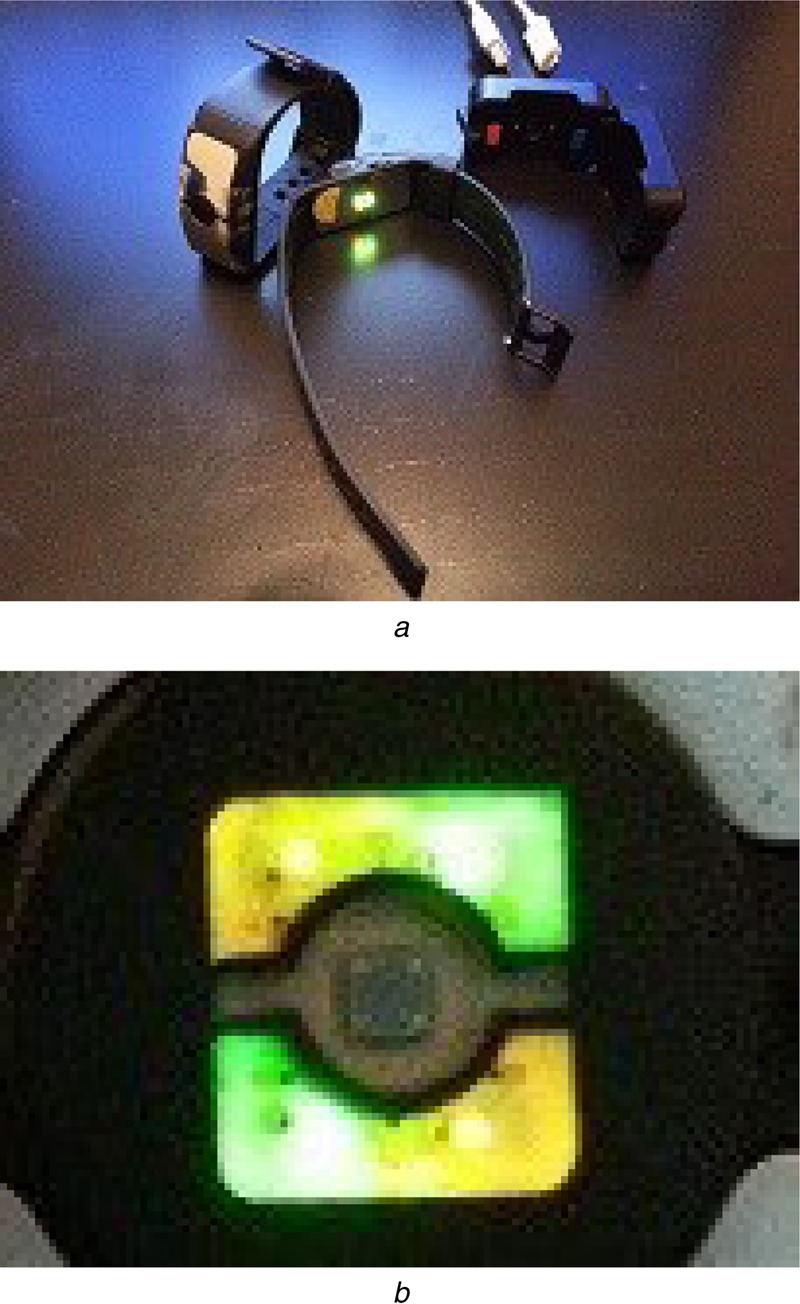
Wrist devices used
a Watch type form factor devices used in the experiment, see the main text for specifications
b LED sources and sensor of the devices
4. Experimental results
The aforementioned heart rate estimate method was tested using data from the ten subjects. In this Letter, the major error measured is defined to be the mean absolute error percentage as
| (9) |
where the average is taken over all time points t of a subject, and then averaged over all subjects.
The average performance among all ten subjects was 2.57%, where the segment length, L is set to 2048, with a refreshing rate of 1 s such that the overlap of consecutive segments was M = 100 samples, and other parameters were chosen such that a 20% variation in the selection relative to previously reported metrics does not lead to a performance degradation of >1%. The optimal choice of LED colour is based on the ethnicity of the subject such that yellow LED signal was used for Caucasians and East Asians, and green LED for Middle Eastern and Indian subjects. Using the yellow LED led to a 3.29% error compared with green LED of 2.98%. Matsumura et al. [12] conducted a comparison among blue, red and green LEDs for PPG and suggested that using green LEDs leads to better performance. Their choice of LED colour was not based on ethnicity. To further reduce computational complexity, the signals were downsampled by 5 and L = 400. The resulting error was 2.76%. With downsampling by ten and a shorter window of 10 s where L = 100, the error was 4.72%.
The modified Bland–Altman (BA) plot and the histogram of HRppg − HRecg with bin width = 5 (right) are shown in Figs. 6a and b. The modified BA plot shows the ECG heart rate HRecg on the x-axis, as in this context the ECG heart rate serve as the reference standard, verifying the proposed method using a PPG watch device. The mean bias is −1.14 beats per minute (bpm), and the 95% limits of agreement are from −10.6231 to 8.34 bpm. The histogram indicates that the majority of error is within ±2.5 bpm. Fig. 6c shows the scatter plot of estimated heart rate against the reference ECG heart rate, with correlation coefficient r = 0.9889, p < 0.00001.
Figure 6.

Modified BA plot, the histogram of HRppg − HRecg with bin width =5, scatter plot of PPG and ECG, and scatter plot of SNR against absolute error
a Modified BA with reference ECG heart rate as x-axis instead of average of PPG and ECG heart rate
b Histogram of difference between PPG and ECG heart rate
In (a) and (b), red dashed line is mean bias (=1.14 bpm) of estimated PPG heart rate and dashed blue lines are bounds of 95% conference interval
c Scatter plot of PPG and ECG heart rate
The red line is linear regression
d Scatter plot of SNR against absolute error shows negative impact of low SNR on accuracy
The red line is linear regression
An important factor of PPG heart rate estimation algorithm performance lies in the signal properties determined by the form factor, experimental protocol, subjects included and the type of PPG sensor. We measure the signal quality by defining a signal-to-noise ratio (SNR) measured where the signal energy is defined as the energy of the frequency component in the PPG spectrum corresponding to the heart rate frequency obtained from the ECG sensor, and the noise is defined as the total energy of the rest spectrum within the frequency range of interest (45–206 bpm). The instantaneous SNR is defined over each segment. The average SNR is −15.77 dB. Fig. 6d shows that the algorithm performance is negatively correlated with SNR (r = −0.21, p < 0.0001). There are a limited number of previously published studies that have reported SNR measures, with [5] being one example, where the SNR is −1.6 dB. Note that in [5], the noise energy is defined as the sum of all energy of PPG peaks other than the selected HR peak. As mentioned in their work, the SNR defined as such is likely to be overestimated. Nonetheless, a 14 dB SNR difference as we noted continues to highlight the challenges encountered in heart rate estimation from PPG measurements from a watch device during heavy exercise.
5. Conclusion
In this Letter, a highly accurate method for monitoring heart rate based on PPG from a wrist form factor device is proposed. During a heavy exercise protocol with running at a maximal speed of 17 km/h, the algorithm performs at an error of 2.57%, despite a low SNR. The complexity of the algorithm is low, at an order of O(L log L) per second that an error of <5% was achieved with L = 100 and a sampling rate of 10 Hz. The results also suggest benefits of optimising different LED wavelengths for different ethnicities.
6. Acknowledgments
The authors thank the Health and Sensing Lab in DMC R& D of Samsung Electronics for providing the watch device used in the experiments, and also Yusuf Bhagat from the Emerging Technology Lab at Samsung Research America-Dallas for his comments and suggestions.
7. Funding and declaration of interests
Dr. Lai and Dr. Kim have the following patent pending: Motion Robust High Accuracy Heart rate monitoring Apparatus Based on Photoplysmography.
8 References
- 1.Asada H.H., Shaltis P., Reisner A., Rhee S., Hutchinson R.C.: ‘Mobile monitoring with wearable photoplethysmograpic biosensors’. IEEE EMBS Magazine, May/June 2013 [DOI] [PubMed] [Google Scholar]
- 2.Widrow B., Glover J.R., McCool J.M., et al. : ‘Adaptive noise cancelling: principles and applications’, Proc. IEEE, 1975, 63, (12), pp. 1692–1716 (doi: ) [Google Scholar]
- 3.Fukushima H., Kawanaka H., Md., Bhuiyan S., Oguri K.: ‘Estimating heart rate using wrist-type photoplethysmography and acceleration sensor while running’. 34th Annual Int. Conf. of the IEEE EMBS, 2012, San Diego, CA, USA [DOI] [PubMed] [Google Scholar]
- 4.Poh M.-Z., Swenson N.C., Picard R.W.: ‘Motion-tolerant magnetic earring sensor and wireless earpiece for wearable photoplethysmography’, IEEE Trans. Inf. Tech. Biomed., 2010, 14, (3), pp. 786–794 (doi: ) [DOI] [PubMed] [Google Scholar]
- 5.López-Silva S.M., Giannetti R., Dotor M.L., et al. : ‘Heuristic algorithm for photoplethysmographic heart rate tracking during maximal exercise test’, J. Med. Biol. Eng., 2012, 32, (3), pp. 181–188 (doi: ) [Google Scholar]
- 6.Lee H.W., Lee J.W., Jung W.G., Lee G.K.: ‘The periodic moving average filter for removing motion artifacts from PPG signals’, Int. J. Control Autom. Syst., 2007, 5, pp. 701–706 [Google Scholar]
- 7.Ram M.R., Madhav K.V., Krishna E.H., Komalla N.R., Reddy K.A.: ‘A novel approach for motion artifact reduction in PPG signals based on AS-LMS adaptive filter’, IEEE Trans. Instrum. Meas., 2011, 61, (5), pp. 1445–1457 (doi: ) [Google Scholar]
- 8.Kim B.S., Yoo S.K.: ‘Motion artifact reduction in photoplethysmography using independent component analysis’, IEEE Trans. Biomed. Eng., 2006, 53, (3), pp. 566–568 (doi: ) [DOI] [PubMed] [Google Scholar]
- 9.Peng F., Zhang Z., Gou X., Liu H., Wang W.: ‘Motion artifact removal from photoplethysmographic signals by combining temporally constrained independent component analysis and adaptive filter’, Biomed. Eng., 2014, 13, p. 50. [DOI] [PMC free article] [PubMed] [Google Scholar]
- 10.Kim I., Lai P.-H., Lobo R., Gluckman E.J.: ‘Challenges in wearable personal health monitoring systems’. Proc. of the 36th Annual Int. Conf. of the IEEE Engineering in Medicine and Biology Society (EMBC), 2014, pp. 5264–5267 [DOI] [PMC free article] [PubMed] [Google Scholar]
- 11.Cormen T.H., Leiserson C.E., Rivest R.L., Stein C.: ‘Introduction to algorithms’ (The MIT Press, 2009, 3rd edn.) [Google Scholar]
- 12.Matsumura K., Rolfe P., Lee J., Yamakoshi T.: ‘iPhone 4 s photoplethysmography: which light color yields the most accurate heart rate and normalized pulse volume using the iPhysio meter application in the presence of motion artifact?’, Plos One, 2014, 9, (3), p. e91205 (doi: ) [DOI] [PMC free article] [PubMed] [Google Scholar]