Abstract
Objectives:
Pre-operative differentiation of salivary gland neoplasms is of great importance. This study was designed to evaluate the use of dynamic contrast-enhanced MRI (DCE-MRI) for differentiation between malignant, Warthin and benign non-Warthin (BNW) neoplasms of major salivary glands.
Methods:
46 major salivary gland tumours (SGTs) underwent pre-operative DCE-MRI. Post-surgical histopathological evaluation showed 30 BNW, 6 Warthin and 10 malignant tumours. Time–signal intensity curves (TICs) were categorized as (a) Tpeak >43 s and washout ratio at 180 s (WR180) <4.6%; (b) Tpeak <43 s and WR >22%; (c) Tpeak >43 s and WR180 = 4.6–22.0%
Results:
Accuracy of Tpeak was 98.9% for differentiation between BNW and Warthin tumours, 83.7% between BNW and malignant and 80% between malignant and Warthin tumours. All Warthin tumours showed Tpeak ≤43 s, while one BNW had Tpeak <43 s. A Tpeak <63.5 s differentiated 8/10 (80%) malignant tumours from BNW tumours, whereas 4/30 of BNW tumours had a Tpeak <63.5 s. Two malignant tumours had Tpeak <43 s. WR180 had an accuracy of 100% for differentiation between Warthin and BNW tumours, 87.3% between BNW and malignant, and 93.3% between Warthin and malignant tumours. 29 (96.7%) BNW tumours had a washout <4.60%, while 8 (80%) malignant tumours had a washout >4.60%. All Warthin tumours had a WR180 >22%, while two malignant tumours had a WR180 >22%. 29/30 of BNW tumours demonstrated TIC curve Type A and 1 tumour demonstrated Type C. 6/10 of malignant tumours had TIC Type C, 2 had TIC Type A and 2 Type B. All Warthin tumours were categorized as Type B.
Conclusions:
This study showed that DCE-MRI could be helpful in pre-operative differentiation of SGTs; especially for discrimination between Warthin and BNW tumours.
Keywords: dynamic MRI, salivary glands, neoplasm
Introduction
Pre-operative discrimination between benign and malignant salivary gland tumours (SGTs) is important for optimal planning of surgical procedures, as in malignant tumours, more extensive surgery must be performed, whereas, in benign tumours, local excision is sufficient.1,2 On the other hand, differentiation of Warthin tumour from pleomorphic adenoma is essential because untreated pleomorphic adenoma carries a 25% risk of malignant transformation3 and so the surgery plan differs slightly between them. Fine-needle aspiration cytology (FNAC) is used for pre-operative differentiation of these tumours, but owing to sampling difficulties and great heterogeneity of these neoplasms (especially pleomorphic adenoma), the results are not always conclusive.4,5
Up to 80% of salivary gland neoplasms occur in the parotid gland.6 Some authors have advocated the role of MRI as the first imaging modality when there is high probability of parotid neoplastic lesion.7 MRI is the imaging modality of choice to assess tumour behaviour and extension.8 Several studies have evaluated the possible role of static MRI parameters, such as signal intensity, heterogeneity and irregular borders for differentiation of benign and malignant tumours, but controversial results were elicited.9–11 Recently, few studies have assessed the role of dynamic contrast-enhanced MRI (DCE-MRI) in differentiation of SGTs with several of them showing promising results.12–17 This study was designed to evaluate the role of DCE-MRI using a 3-T magnet for differentiation of major salivary gland neoplasms.
Methods and materials
Patients
This was a cross-sectional study conducted from October 2011 to December 2012. Patients with clinically suspicious neoplasm of major salivary gland were included in this study. All patients were referred only if a surgery plan was established by an otolaryngologist. Patients were excluded if further evaluation provided alternative diagnosis (one patient with lymphoepithelial cyst). Subjects in whom MRI was contraindicated were also not included (e.g. pacemaker, haemodynamic instability). DCE-MRI was performed in all individuals before surgery. Images were interpreted in consensus by two radiologists with at least 5 years' experience in head and neck imaging. Interpreting radiologists were blind to the pathological diagnosis of patients. Surgery was performed in all individuals within 7–10 days after MRI acquisition, and then histopathological specimens were evaluated by one expert pathologist who was blind to the findings of DCE-MRI. Overall, 46 patients were identified with major salivary gland neoplasms (44 in the parotid and 2 in the submandibular glands). Findings of DCE-MRI were compared with histopathological diagnosis of tumours.
This study was approved by the institutional review board and local ethics committee of Tehran University of Medical Sciences, Tehran, Iran. After explaining the study process in detail to the patients, written informed consent was obtained from all participants.
MRI technique
MRI was performed with a 3-T superconductive magnet (Siemens, Magnetom Trio; Siemens Medical Systems, Erlangen, Germany) using a local neck coil. Axial [repetition time (TR)/echo time (TE), 2500/75 ms; matrix size, 307 × 384 pixels; field of view (FOV), 220 mm; and slice thickness, 4 mm with intersection gap, 1 mm]; coronal (TR/TE, 3000/69 ms; matrix size, 307 × 384 pixels; FOV, 240 mm; and slice thickness, 5 mm with intersection gap, 1 mm); turbo spin echo T2 weighted images and axial T1 weighted images (TR/TE, 746/11 ms; matrix size, 307 × 384 pixels; FOV, 220 mm; and slice thickness, 4 mm with intersection gap, 1 mm) were obtained. After injection of 0.2 mmol kg−1 gadolinium-diethylene triamine pentaacetic acid, post-contrast axial sections were obtained at 50, 60, 70, 80, 90, 120, 150, 180, 220, 540 and 560 s by application of T1_VIBE_FS sequence (TR/TE, 5.56/1.99 ms; matrix size, 256 × 256 pixels; FOV, 220 mm and slice thickness, 4 mm with intersection gap, 1 mm). Region of interest was drawn by one radiologist on different parts of the tumour for signal intensity measurement and time–signal intensity curve (TIC) construction. Four regions of interest with areas of about 4 mm2 were drawn in the solid central parts of neoplasms and then the region of interest with dominant TIC pattern and with maximum enhancement was chosen.
Analysis
After reviewing the histopathological data, patients were categorized into three groups as follows: malignant group, Warthin group and benign non-Warthin (BNW) group (including all benign tumours of parotid except Warthin).
Several well-known DCE-MRI parameters were utilized in this study: Tpeak, Tmax, absolute enhancement, enhancement ratio, and washout ratio at 180 and 540 s (WR180, WR540).
TICs were constructed and were categorized into three groups:
(a) Tpeak >43 s and WR180 <4.6% with gradual increase and then either no or minimal washout.
(b) Tpeak <43 s and WR180 >22% with rapid increase and rapid relative washout.
(c) Tpeak >43 s and WR180, 4.6–22.0% with relative moderate increase and relative moderate washout.
Statistical analysis was performed using SPSS® software (v. 16.0; SPSS Inc., Chicago, IL). Receiver operating characteristic curve was carried out to find out the best cut-off values of DCE-MRI parameters. Non-parametric tests (Mann–Whitney) were used for analysis of qualitative variables. All data are expressed as mean ± standard deviation, and p < 0.05 was considered significant.
Results
Of 46 SGTs (44 in the parotid and 2 in the submandibular gland), there were 36 benign lesions (21 females and 15 males), including 6 Warthin (2 females and 4 males), 27 pleomorphic adenoma (17 females and 10 males), 2 myoepithelioma (female) and 1 neurofibroma (male). 10 lesions (3 females and 7 males) were malignant, including 2 mucoepidermoid carcinomas, 3 adenoid cystic carcinomas, 3 ductal adenocarcinomas, 1 acinar cell carcinoma and 1 neuroendocrine carcinoma. Both submandibular neoplasms were pleomorphic adenoma.
Table 1 shows a summary of DCE-MRI parameter mean values for each group. All Warthin tumours had Tpeak ≤43 s and Tmax <136 s, while only one pleomorphic adenoma had Tpeak <43 s and Tmax <136 s; therefore, all Warthin tumours were successfully differentiated from other benign neoplasms of salivary glands by using Tmax or Tpeak. A Tmax <131 s and Tpeak <63.5 s differentiated 8/10 (80%) malignant tumours from BNW tumours. Only 1 out of 30 BNWs had a Tmax <131 s, while 4 had a Tpeak <63.5 s. Accuracy of Tpeak for differentiation of malignant and Warthin tumours was 80%. A Tpeak of ≤43 s was powerful in discriminating between Warthin and malignant tumours. All Warthin tumours showed Tpeak ≤43 s, while 8/10 malignant tumours had Tpeak >43 s. Table 2 shows the accuracy of DCE-MRI parameters for differentiation of SGTs.
Table 1.
Mean ± standard deviation of dynamic contrast-enhanced MRI parameters of benign non-Warthin (BNW), Warthin and malignant salivary gland neoplasms
| SGT category | Tpeak | Tmax | WR180 | WR540 | Absolute enhancement | Enhancement ratio |
|---|---|---|---|---|---|---|
| BNW | 191.84 ± 108.13 | 4.09 ± 186.77 | 0.67 ± 2.80% | 3.37 ± 8.22% | 7.45 ± 370.56 | 2.20 ± 0.85 |
| Warthin | 37.00 ± 3.41 | 44.50 ± 6.02 | 28.20 ± 7.29% | 47.63 ± 15.92% | 7.25 ± 312.05 | 1.55 ± 0.74 |
| Malignant | 82.80 ± 84.14 | 1.80 ± 203.10 | 11.86 ± 11.49% | 25.38 ± 18.52% | 8.33 ± 396.76 | 1.92 ± 0.92 |
| BNW–Warthin | <0.005 | <0.005 | <0.005 | <0.005 | 0.96 | 0.90 |
| BNW–malignant | 0.002 | 0.001 | <0.005 | <0.005 | 0.43 | 0.42 |
| Warthin–malignant | 0.05 | 0.19 | <0.005 | <0.005 | 0.37 | 0.31 |
SGT, salivary gland tumour; WR, washout ratio.
p-value of each parameter for differentiation between tumour subtypes is given.
Table 2.
Area under curve (equivalent to accuracy) of dynamic contrast-enhanced MRI parameters for discrimination of benign non-Warthin (BNW), Warthin and malignant neoplasms
| SGT category | Tpeak (%) | Tmax (%) | WR180 (%) | WR540 (%) |
|---|---|---|---|---|
| BNW–Warthin | 98.9 | 99.4 | 100 | 98.9 |
| BNW–malignant | 83.7 | 83 | 87.3 | 85 |
| Warthin–malignant | 80 | 70 | 93.3 | 83.3 |
SGT, salivary gland tumour; WR, washout ratio.
WR180 had 100% accuracy for differentiation between Warthin and BNW tumours. All BNW tumours had a WR180 <16%, while all Warthin tumours demonstrated a WR180 >22%. Accuracy of WR540 for differentiation of BNW and Warthin was 98.9% with all Warthin tumours showing washout >29%, and all BNW tumours except one showing washout <23%. WR180 was powerful in distinction between BNW and malignant tumours with an accuracy of 87.3%. 29 out of 30 (96.7%) BNWs had a washout <4.60%, while 8/10 (80%) of malignant tumours had a washout >4.60%. Two malignant tumours did not show any washout at 180 s, resembling washout pattern of BNW tumours. WR540 was also helpful in differentiation of BNW and malignant tumours with an accuracy of 85%. Eight malignant tumours (80%) had WR540 >18%, while two did not demonstrate any washout. Of 30 BNW tumours, 28 had WR540 <18% and 2 had WR540 of 22% and 36.40%. WR180 and WR540 had accuracies of 93.3% and 83.3% in discrimination between Warthin and malignant neoplasms of the salivary glands. All Warthin tumours had a WR180 >22%, while two malignant tumours had a WR180 >22%. Moreover, a WR540 >42% was suggestive of Warthin tumour; however, 2/6 Warthin tumours had WR540 <42%.
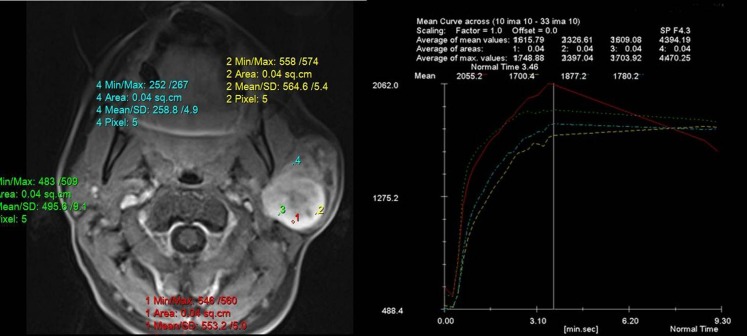
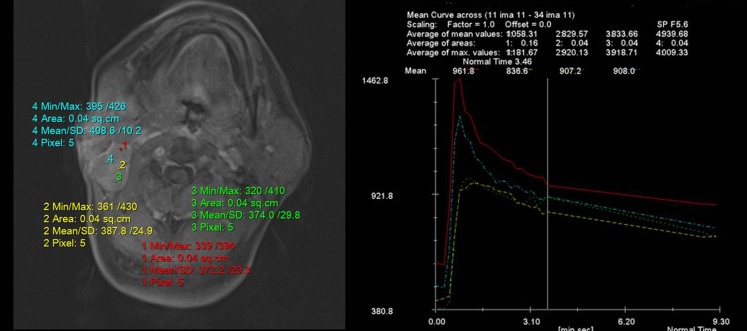
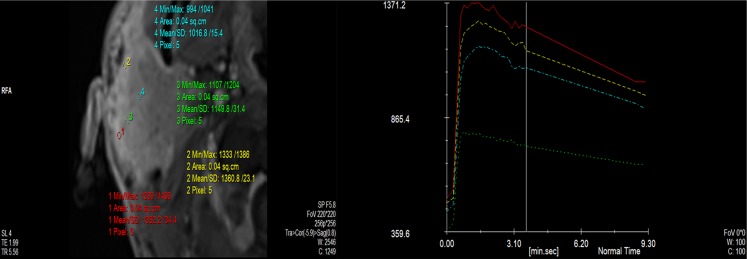
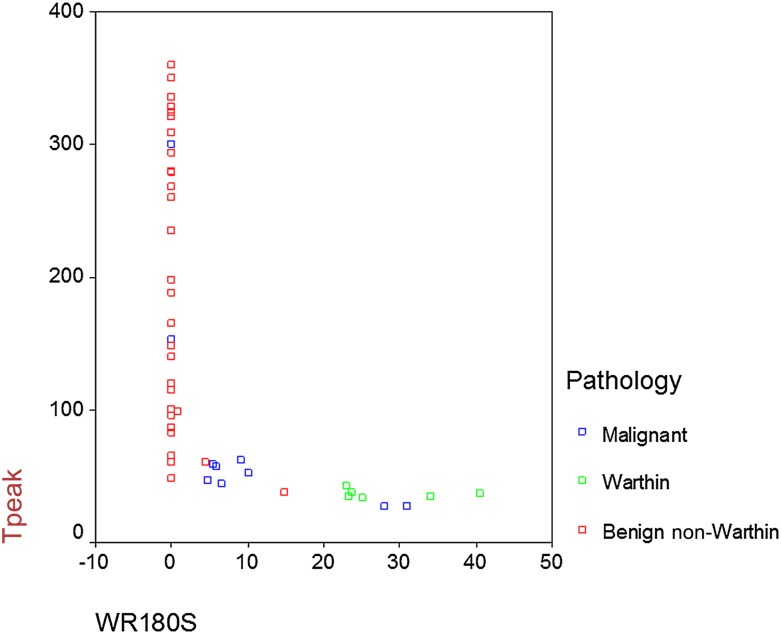
According to TIC curves, 29 out of 30 BNW tumours demonstrated TIC curve Type A (Figure 1) and 1 demonstrated TIC Type C. All Warthin tumours were categorized in TIC Type B (Figure 2). Out of 10 malignant tumours, 6 had TIC Type C (Figure 3), 2 had TIC Type A and 2 showed Type B. Therefore, by using TIC curves, all Warthin tumours could be differentiated from other neoplasms of salivary glands. Almost all (29/30) BNW tumours were successfully differentiated from Warthin and malignant tumours. However, only 60% (6/10) of malignant tumours were differentiated from benign tumours (Figure 4). Table 3 demonstrates the details of TIC curves.
Figure 1.
Time–signal intensity curves (TICs) in a patient with pleomorphic adenoma of parotid gland shows gradual enhancement and no washout of contrast after 560 s, which is consistent with TIC Type A. Max, maximum; min, minimum; SD, standard deviation.
Figure 2.
Time–signal intensity curves (TICs) in a patient with Warthin tumour of the parotid gland show rapid enhancement and washout indicative of a TIC Type B. Max, maximum; min, minimum; SD, standard deviation.
Figure 3.
Time–signal intensity curves (TICs) in a patient with adenocystic carcinoma of the parotid gland shows moderately rapid enhancement and moderate washout consistent with TIC Type C. Max, maximum; min, minimum; SD, standard deviation.
Figure 4.
The relationship between Tpeak and washout ratio (WR) for 180 s in three types of salivary gland neoplasms.
Table 3.
Time–signal intensity curve (TIC) patterns of salivary gland tumours based on their histopathological subtype
| Pathological type | Pathological subtypes | TIC patterns of dynamic contrast-enhanced MRI |
|||
|---|---|---|---|---|---|
| Number of cases | Type A | Type B | Type C | ||
| Benign non-Warthin | Pleomorphic adenoma | 27 | 26 | – | 1 |
| Myoepithelioma | 2 | 2 | – | – | |
| Neurofibroma | 1 | 1 | – | – | |
| Warthin | 6 | – | 6 | – | |
| Malignant tumours | Adenocystic carcinoma | 3 | 2 | – | 1 |
| Ductal adenocarcinoma | 3 | – | 1 | 2 | |
| Mucoepidermoid carcinoma | 2 | – | 1 | 1 | |
| Acinar cell carcinoma | 1 | – | – | 1 | |
| Neuroendocrine carcinoma | 1 | – | – | 1 | |
| Total cases | 46 | 31 | 8 | 7 | |
Discussion
We used a 3-T MRI to evaluate dynamic curve behaviour of SGTs before surgery. Several DCE-MRI parameters were examined; of which Tpeak and WR180 yielded the best results. This study demonstrated that Tpeak and WR180 were powerful in differentiation of Warthin from other tumours of salivary gland with all Warthin tumours having Tpeak ≤43 s and WR180 >22%. WR180 data showed no overlap between Warthin and BNW. All BNW tumours, except in one subject (pleomorphic adenoma Tpeak, 38 s and WR180, 14.85%), had WR180 ≤4.60%. Our data showed that only 60% of malignant tumours could be differentiated from benign tumours of salivary gland. Based on these findings, proper discrimination of malignant tumours of major salivary glands from benign tumours might not be possible solely based on DCE-MRI, and FNAC or excisional biopsy are still required for optimal differentiation between benign and malignant SGT.
Pre-surgical diagnosis of SGT is essential for proper timing and planning of surgery. There is a considerable morphological and histological variability among FNAC of SGT. Several FNAC misdiagnoses of malignant tumours as Warthin and vice versa are reported.18,19 DCE-MRI might add to the reliability of pre-operative diagnosis. Ogawa et al19 described DCE-MRI of two parotid Warthin tumours that were misdiagnosed as malignant neoplasms on pre-operative FNAC. DCE-MRI in these patients showed rapid enhancement following rapid washout that was characteristic of Warthin tumours.
Few studies have described TIC curves of SGTs using 0.5- to 1.5-T MRI yielding controversial results. There is no widely accepted TIC categorization for SGTs. Hisatomi et al16 categorized SGTs using combined Tmax and WR300: pleomorphic adenoma, Tmax >210 s and WR300 <10%; Warthin tumour, Tmax <60 s and WR300 >40%; and malignant tumour, 60 s <Tmax <210 s and 10% <WR300 <30%; using this categorization, they differentiated all pleomorphic adenoma and malignant tumours from Warthin, 90% of BNW and all Warthin tumours from malignant tumours, and 91.7% of malignant and all Warthin tumours from pleomorphic adenomas. According to another study by Yabuuchi et al12 on a 0.5-T MRI data, a threshold of 120 s for Tpeak was powerful in differentiation of malignant tumours from pleomorphic adenomas. Also, a 5-min WR cut-off of 30% enabled differentiation between malignant and Warthin tumours. Using Tpeak and WR, 4 TIC curves were described: Type A with Tpeak >120 s (including 9 pleomorphic adenomas), Type B with Tpeak ≤120 s and WR ≥30% (including 8 Warthins, 1 malignant and 1 myoepithelioma), Type C with Tpeak ≤120 s and WR <30% (including 10 malignant and 2 pleomorphic adenoma) and Type D with a flat curve (1 Warthin and 1 pleomorphic adenoma).12 In the present study, 11 BNW tumours had a Tpeak <120 s, and so we did not find this criterion useful for differentiation of BNW from malignant SGTs. Moreover, our data showed WR180 s to be more helpful for proper discrimination of SGTs. Three patterns of TIC were developed according to Tpeak and WR180 data. By using this categorization, all Warthin tumours were categorized as Type B curve. 96.67% of BNWs showed Type A pattern and only one pleomorphic adenoma demonstrated Type C pattern. Of 10 malignant tumours, 6 were categorized as Type C, 2 showed Type A and 2 others showed Type B pattern of TIC. Proper discrimination of malignant from benign tumours solely based on DCE-MRI might not be possible; however, DCE-MRI can add to reliability of pre-operative diagnosis.
DCE-MRI assesses the angiogenesis behaviour of tumours through signal intensity changes in sequential contrast-enhanced images. 3-T MRI has higher filed strength than do 1- or 1.5-T MRI and produces higher signal-to-noise ratio. Higher signal-to-noise ratio allows more accurate evaluation of signal intensity changes. Therefore, it is advisable to use 3-T machines for dynamic MRI studies. We expected to observe a gradual increment in BNW curves and relatively rapid rise in malignant tumour TICs. Malignant tumours tend to have higher vascularity, and therefore shorter Tpeak was expected. On the other hand, high microvascularity of Warthin tumours could be responsible for its short Tpeak.12 Warthin tumours usually consist of rich compact cellularity and thus rapid washout is expected. In comparison, pleomorphic adenoma has a marked stromal component and therefore delayed washout is expected. Marked heterogeneity of malignant neoplastic tissue could be responsible for overlaps of malignant neoplasms with BNW and Warthin tumours.
While we found Tpeak, Tmax and WR helpful for differentiation of SGTs; enhancement ratio and absolute enhancement were not powerful for discrimination of tumour types. According to Yabuuchi et al12 and Hisatomi et al,16 there is no considerable difference in enhancement ratio between salivary gland neoplasms.
This study demonstrated TIC patterns of SGTs similar to those of other studies; however, the threshold of Tpeak and WR differed for TIC categorization. Overall, DCE-MRI can aid in pre-surgical imaging, but is unable to provide a definite diagnosis.
This study had several limitations; first the number of Warthin tumour cases was low compared with other benign tumours. Although all Warthin tumours were differentiated from BNW in this study, a larger study on patients with Warthin tumours is required. Second, since the neoplasms of minor salivary glands were not included in this study, it is unknown if the results could be attributed to the neoplasms of minor salivary glands. A study on DCE-MRI of minor salivary gland neoplasms found that Tmax was helpful for differentiation of benign and malignant tumours of minor SGTs, however, unlike major salivary glands, differentiation of benign and malignant tumours was not possible based on the DCE-MRI parameters.20
In conclusion, this study showed that DCE-MRI could assist in pre-operative differentiation of salivary gland neoplasms. A combination of WR180 and Tpeak is useful for differentiation between Warthin and BNW tumours; however, discrimination between malignant and benign SGTs was not possible solely based on dynamic curves. FNAC or surgery is required for definite histopathological diagnosis.
References
- 1.Scianna JM, Petruzzelli GJ. Contemporary management of tumors of the salivary glands. Curr Oncol Rep 2007; 9: 134–8. [DOI] [PubMed] [Google Scholar]
- 2.Magnano M, Gervasio CF, Cravero L, Machetta G, Lerda W, Beltramo G, et al. Treatment of malignant neoplasms of the parotid gland. Otolaryngol Head Neck Surg 1999; 121: 627–32. [DOI] [PubMed] [Google Scholar]
- 3.Som PM, Shugar JM, Sacher M, Stollman AL, Biller HF. Benign and malignant parotid pleomorphic adenomas: CT and MR studies. J Comput Assist Tomogr 1988; 12: 65–9. [DOI] [PubMed] [Google Scholar]
- 4.Schindler S, Nayar R, Dutra J, Bedrossian CW. Diagnostic challenges in aspiration cytology of the salivary glands. Semin Diagn Pathol 2001; 18: 124–46. [PubMed] [Google Scholar]
- 5.Takashima S, Takayama F, Wang Q, Kurozumi M, Sekiyama Y, Sone S. Parotid gland lesions: diagnosis of malignancy with MRI and flow cytometric DNA analysis and cytology in fine-needle aspiration biopsy. Head Neck 1999; 21: 43–51. [DOI] [PubMed] [Google Scholar]
- 6.Bradley PJ. Pleomorphic salivary adenoma of the parotid gland: which operation to perform? Curr Opin Otolaryngol Head Neck Surg 2004; 12: 69–70. [DOI] [PubMed] [Google Scholar]
- 7.Yousem DM, Kraut MA, Chalian AA. Major salivary gland imaging. Radiology 2000; 216: 19–29. [DOI] [PubMed] [Google Scholar]
- 8.Lenz M. Imaging of head and neck tumors. Eur J Radiol 2000; 33: 151–2. [DOI] [PubMed] [Google Scholar]
- 9.Okahara M, Kiyosue H, Hori Y, Matsumoto A, Mori H, Yokoyama S. Parotid tumors: MR imaging with pathological correlation. Eur Radiol 2003; 13(Suppl. 4): L25–33. [DOI] [PubMed] [Google Scholar]
- 10.Christe A, Waldherr C, Hallett R, Zbaeren P, Thoeny H. MR imaging of parotid tumors: typical lesion characteristics in MR imaging improve discrimination between benign and malignant disease. AJNR Am J Neuroradiol 2011; 32: 1202–7. doi: 10.3174/ajnr.A2520 [DOI] [PMC free article] [PubMed] [Google Scholar]
- 11.Freling NJ, Molenaar WM, Vermey A, Mooyaart EL, Panders AK, Annyas AA, et al. Malignant parotid tumors: clinical use of MR imaging and histologic correlation. Radiology 1992; 185: 691–6. [DOI] [PubMed] [Google Scholar]
- 12.Yabuuchi H, Fukuya T, Tajima T, Hachitanda Y, Tomita K, Koga M. Salivary gland tumors: diagnostic value of gadolinium-enhanced dynamic MR imaging with histopathologic correlation. Radiology 2003; 226: 345–54. [DOI] [PubMed] [Google Scholar]
- 13.Yabuuchi H, Matsuo Y, Kamitani T, Setoguchi T, Okafuji T, Soeda H, et al. Parotid gland tumors: can addition of diffusion-weighted MR imaging to dynamic contrast-enhanced MR imaging improve diagnostic accuracy in characterization? Radiology 2008; 249: 909–16. doi: 10.1148/radiol.2493072045 [DOI] [PubMed] [Google Scholar]
- 14.Alibek S, Zenk J, Bozzato A, Lell M, Grunewald M, Anders K, et al. The value of dynamic MRI studies in parotid tumors. Acad Radiol 2007; 14: 701–10. [DOI] [PubMed] [Google Scholar]
- 15.Eida S, Sumi M, Nakamura T. Multiparametric magnetic resonance imaging for the differentiation between benign and malignant salivary gland tumors. J Magn Reson Imaging 2010; 31: 673–9. doi: 10.1002/jmri.22091 [DOI] [PubMed] [Google Scholar]
- 16.Hisatomi M, Asaumi J, Yanagi Y, Unetsubo T, Maki Y, Murakami J, et al. Diagnostic value of dynamic contrast-enhanced MRI in the salivary gland tumors. Oral Oncol 2007; 43: 940–7. [DOI] [PubMed] [Google Scholar]
- 17.Hisatomi M, Asaumi J, Konouchi H, Yanagi Y, Matsuzaki H, Kishi K. Assessment of dynamic MRI of Warthin's tumors arising as multiple lesions in the parotid glands. Oral Oncol 2002; 38: 369–72. [DOI] [PubMed] [Google Scholar]
- 18.Viguer JM, Vicandi B, Jiménez-Heffernan JA, López-Ferrer P, González-Peramato P, Castillo C. Role of fine needle aspiration cytology in the diagnosis and management of Warthin's tumour of the salivary glands. Cytopathology 2010; 21: 164–9. doi: 10.1111/j.1365-2303.2009.00667.x [DOI] [PubMed] [Google Scholar]
- 19.Ogawa T, Suzuki T, Sakamoto M, Watanabe M, Tateda Y, Oshima T, et al. Correct diagnosis of Warthin tumor in the parotid gland with dynamic MRI. Tohoku J Exp Med 2012; 227: 53–7. [DOI] [PubMed] [Google Scholar]
- 20.Matsuzaki H, Yanagi Y, Hara M, Katase N, Asaumi J, Hisatomi M, et al. Minor salivary gland tumors in the oral cavity: diagnostic value of dynamic contrast-enhanced MRI. Eur J Radiol 2012; 81: 2684–91. doi: 10.1016/j.ejrad.2011.11.005 [DOI] [PubMed] [Google Scholar]


