Abstract
Oncogene-induced senescence (OIS) is an important tumor suppression mechanism preventing uncontrolled proliferation in response to aberrant oncogenic signaling. The profound functional and morphological remodelling of the senescent cell involves extensive changes. In particular, alterations in protein ubiquitination during senescence have not been systematically analyzed previously. Here, we report the first global ubiquitination profile of primary human cells undergoing senescence. We employed a well-characterized in vitro model of OIS, primary human fibroblasts expressing oncogenic RAS. To compare the ubiquitinome of RAS-induced OIS and controls, ubiquitinated peptides were enriched by immune affinity purification and subjected to liquid chromatography tandem mass spectrometry (LC-MS/MS). We identified 4,472 ubiquitination sites, with 397 sites significantly changed (>3 standard deviations) in senescent cells. In addition, we performed mass spectrometry analysis of total proteins in OIS and control cells to account for parallel changes in both protein abundance and ubiquitin levels that did not affect the percentage of ubiquitination of a given protein. Pathway analysis revealed that the OIS-induced ubiquitinome alterations mainly affected 3 signaling networks: eIF2 signaling, eIF4/p70S6K signaling, and mTOR signaling. Interestingly, the majority of the changed ubiquitinated proteins in these pathways belong to the translation machinery. This includes several translation initiation factors (eIF2C2, eIF2B4, eIF3I, eIF3L, eIF4A1) and elongation factors (eEF1G, eEF1A) as well as 40S (RPS4X, RPS7, RPS11 and RPS20) and 60S ribosomal subunits (RPL10, RPL11, RPL18 and RPL35a). In addition, we observed enriched ubiquitination of aminoacyl-tRNA ligases (isoleucyl-, glutamine-, and tyrosine-tRNA ligase), which provide the amino acid-loaded tRNAs for protein synthesis. These results suggest that ubiquitination affects key components of the translation machinery to regulate protein synthesis during OIS. Our results thus point toward ubiquitination as a hitherto unappreciated regulatory mechanism during OIS.
Keywords: oncogene-induced senescence, proteomics, mass spectrometry, protein translation, protein synthesis, ubiquitination
Introduction
Cellular senescence is a state of stable cell growth arrest.1 In primary mammalian cells, activation of oncogenes such as RAS typically induces senescence.2,3 Oncogene-induced senescence (OIS) prevents primary cells from uncontrolled proliferation and malignant transformation.4 During OIS, cells undergo a diverse array of phenotypic changes. For example, chromatin in senescent cells reorganizes to form senescence-associated heterochromatin foci (SAHF) that contributes to senescence-associated cell growth arrest by silencing the proliferation-promoting genes.5,6 In addition, senescent cells display an increase in senescence-associated β-galactosidase (SA-β-Gal) activity.7 It has been well established that p16/pRB and p53/p21 tumor suppressor pathways play a key role in senescence-associated cell growth arrest.8 The extensive functional and structural remodelling of the cell during OIS is reflected by profound changes in the proteome.9 This suggests that regulation of protein synthesis and/or degradation might play a role in OIS.
Ubiquitination is an effective regulatory mechanism to induce proteome alterations. It is a common post-translational modification (PTM) where one (monoubqiquitination) or a chain of several ubiquitin molecules (polyubiquitination) are covalently attached to a substrate protein. Different states of ubiquitination determine the fate of a protein: polyubiquitination usually marks a protein for degradation in 26S proteasome-dependent manner,10 while monoubiquitination can alter protein function.11 Ubiquitination is carried out by 3 types of enzymes, E1, E2, and E3 ligases, which consecutively activate, transfer and covalently link ubiquitin to lysine residues in a substrate protein.12 In contrast, ubiquitin can be removed from proteins by deubiquitinating enzymes (DUBs).13 Thus, ubiquitination is a dynamic cellular process that can quickly affect cellular protein levels and function. Despite studies of alterations in gene expression profiles and proteomes in OIS,9,14 changes in ubiquitinated proteins (ubiquitinome) during senescence have never been profiled. Here, we systematically analyzed OIS-related changes of the ubiquitinome in primary human fibroblasts.
Results
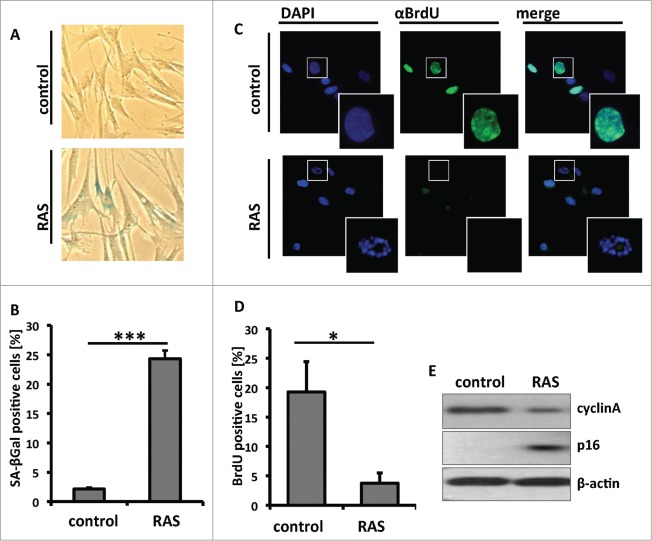
We set out to identify OIS-associated changes in the ubiquitinome in primary human cells by LC-MS/MS. First we sought to determine the time needed for RAS-infected primary human cells to undergo senescence. Toward this goal, we infected primary human fibroblasts IMR90 cells with a retrovirus encoding oncogenic H-RASG12V to induce senescence. Consistent with previous studies,15 RAS-infected cells exhibited a significant increase in SA-β-gal activity (Fig. 1A and B) 6 d after infection. Next, we sought to examine senescence-associated cell cycle exit by BrdU incorporation. Indeed, there was a significant decrease in BrdU positive cells in RAS-infected cells compared with controls (Fig. 1C and D). Consistently, the expression of cell proliferation marker cyclin A was reduced in RAS-infected cells, while the expression of senescence marker p16 was upregulated in these cells compared with controls (Fig. 1E). Likewise, there was an apparent cell growth inhibition in RAS-expressing cells compared with controls as determined by colony formation assay (Fig. S1). Together, we conclude that 6 d post infection, there is a significant increase in the expression of markers of senescence and a decrease in cell proliferation markers in RAS-infected cells compared with control. Thus, we chose to perform our ubiquitinome and global proteome analyses at 6 d post RAS-infection.
Figure 1.
Senescence-induction by overexpression of oncogenic RAS. (A) Primary human fibroblasts (IMR90) were infected with a retrovirus encoding for oncogenic H-RASG12V or control. At day 6 post infection, drug-selected cells were assayed for Senescence-associated β-galactosidase (SA-β-gal) activity. (B) Quantitation of A. Mean of 3 independent experiments (error bars = SEM). ***P < 0.001. (C) Same as A, but labeled with BrdU for 1 hour to visualize replicating cells. (D) Quantitation of C. Mean of 3 independent experiments (error bars = SEM). *P < 0.05. (E) At day 6 post infection, drug-selected cells were examined for the expression of cyclin A and p16 by immunoblotting.
For ubiquitinome analysis, stable isotope labeling with amino acids in cell culture (SILAC) 16 was performed in primary IMR90 fibroblasts starting at population doubling 20 (PD20). Cells were passaged in culture medium labeled with heavy 13C6-lysine and 13C6-arginine for 5 passages to ensure that all proteins in these cells were isotope labeled. Next, these cells were infected with a retrovirus encoding oncogenic H-RASG12V (Fig. 2A). In parallel, control retrovirus-infected cells at the same passage were cultured in regular culture medium with light labeled 12C6-lysine and 12C6-arginine. The control and RAS-infected cells were harvested at day 6 post-infection. Before cell harvest, cells were treated with the proteasome inhibitor MG132 (5 µM) for 5 hours to prevent ubiquitin-dependent protein degradation. For comparison, protein lysates of heavy isotope labeled RAS-infected and control cells cultured in light isotopes were mixed in a 1:1 ratio. As a quality control, a 1:1 mixture of protein lysates from heavy and light labeled controls was included for comparison. Tryptic digest of the protein lysates generated peptides with ε-G-G residues at ubiquitination sites, since the C-terminal sequence of ubiquitin is KESTLHLVLRLRGG, which is cleaved after Arg (R).17 Prior to LC-MS/MS, ubiquitinated peptides were enriched by immune affinity purification using an anti-ε-G-G peptide antibody (Fig. 2B). A global proteome analysis was also performed on non-enriched combined lysates of RAS-infected heavy labeled and control light labeled cells to determine the general protein level changes.
Figure 2.
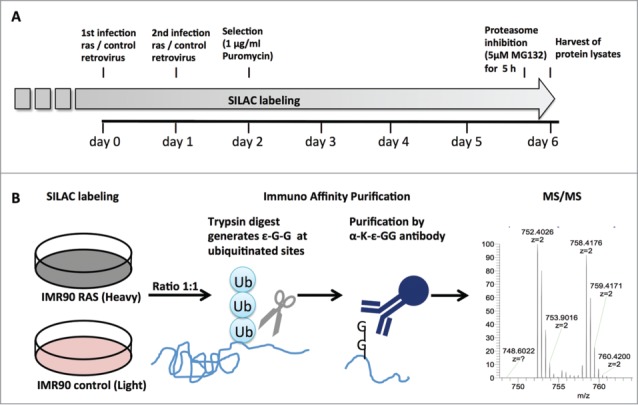
Experimental setup for analysis of the OIS-associated ubiquitinome. (A) time course of RAS-induced OIS experiment. SILAC labeling of primary fibroblast (IMR90) was initiated at population doubling 20 and maintained for the duration of the experiment. Cells were infected twice with H-RASG12V or control retrovirus and selected by puromycin (1 µg/ml). Samples for mass spectrometry were collected at day 6 after a 5 h treatment with the proteasome inhibitor MG132 (5 µM). (B) Schematic of ubiquitination site identification by mass spectrometry. RAS and control fibroblasts labeled with heavy or light SILAC, respectively, cell lysates were harvested and mixed in a 1:1 ratio. Trypsin digest generated ε-G-G residues at ubiquitination site and these peptides were enriched by immune affinity purification prior to MS/MS.
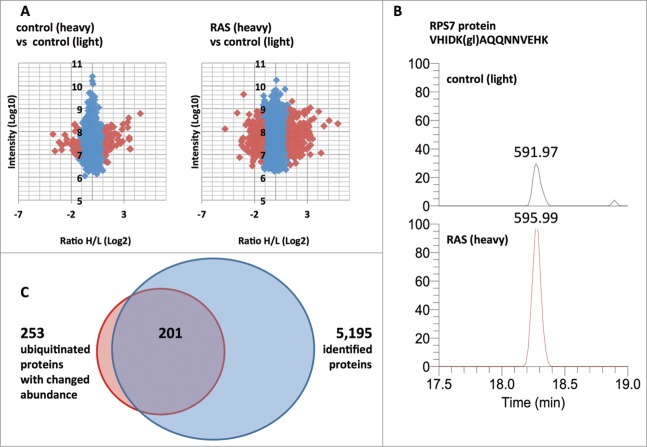
The ubiquitinome analysis of RAS-infected and control cells identified 4,472 ubiquitinated peptides (at a false discovery rate of 1%), of which 397 (8.8%) showed a significantly changed abundance (>3 Standard Deviations relative to biological replicate control). The biological replicate control using equal amounts of light and heavy labeled protein lysates from control fibroblast showed only 85 peptides with significant change out of 5,135 identified ubiquitinated peptides (1.6%) (Fig. 3A). This demonstrates a good signal (8.8%) to noise (1.6%) ratio. One example of a ubiquitinated peptide with significant change in OIS compared to control fibroblasts was VHIDK(gl)AQQNNVEHK representing the ribosomal protein RPS7 with a Heavy/Light fold change of 2.7 (Fig. 3B). The 397 significantly changed ubiquitinated peptides belonged to 253 proteins. Some proteins (such as RPS11 and EIF4A1) were ubiquitinated at multiple sites. In most cases where multiple ubiquitinated peptides were identified in a single protein (multiubiquitination), the ubiquitination sites showed very similar OIS-induced abundance changes. The global proteome analysis of RAS-infected and control fibroblasts identified 5,195 proteins. Fold changes detected in the global proteome analysis were used to adjust the fold changes in the ubiquitinome dataset. Not all proteins with changed ubiquitination were identified in the global proteomics analysis and the associated ubiquitinated sites were not included in the final data set of modified sites. In addition, correction for changes in protein level reduced some ubiquitination site changes to less than 1.5-fold and these sites were removed from the final dataset. Therefore, the final data set of significantly changed ubiquitinated proteins used for further analyses was reduced to 201 proteins (Fig. 3C).
Figure 3.
Representation of ubiquitin site proteomics and global proteomics data. (A) Ratio Heavy/Light versus intensity plots of ubiquitinated sites identified in control and experimental samples. Identifications with significantly changed ubiquitinated peptides (>3 Standard Deviations) are indicated in red. (B) Extracted ion chromatograms of a SILAC pair (591.97 m/z, 595.99 m/z) corresponding to the triple charged ubiquitinated peptide VHIDK(gl)AQQNNVEHK of the protein RPS7. The maximum intensity for both plots are fixed at 1E6. (gl) indicates diglycine remnant. (C) Venn diagram of proteins identified as significantly changed in ubiquitin site proteomics vs. proteins identified by global proteomics.
Ingenuity pathway analysis (IPA) was performed on the global proteome data of RAS-infected and control fibroblasts. The analysis revealed major OIS-induced changes in regulatory networks including: dermatological diseases, cancer, cellular assembly, and DNA replication (Table S1). Alterations in these protein networks reflect cellular and functional alterations that occur during OIS, such as changes in fibroblast marker proteins, enhanced oncogenic signaling, structural changes, and induction of replication shutdown. Further analysis identified the most affected canonical pathways: adherens junction signaling (−logp = 7.00), cell cycle control of chromosomal replication (−logp = 6.79), hepatic fibrosis (−logp = 6.76), including several cytokines typically secreted during senescence (IL8, IL1α, and IL1β) (Table S2). The pathways identified from analyzing our dataset are consistent with previously published OIS-dependent proteome changes. 9
Next, we sought to analyze the OIS-associated changes in the ubiquitinome. For our analysis of the ubiquitinome data set we used the 201 proteins that exhibited significant fold changes of at least 1.5-fold after correcting for any changes in the total levels of individual proteins. IPA on the processed dataset revealed that the molecular networks most affected in the OIS ubiquitinome included: 1(hereditary disorder, carbohydrate metabolism, 2) developmental disorder, muscular and skeletal disorder, protein synthesis, 3) cancer, cardiovascular disease (Fig. 4A). Notably, ubiquitin (UBC) represents the central node of the network with the highest score “hereditary disorder, carbohydrate metabolism,” supporting a mechanistic link (Fig. 4B).
Figure 4.
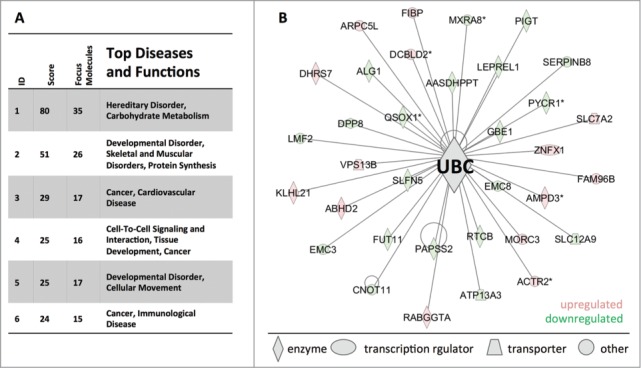
Disease and function networks affected by ubiquitinome alterations in RAS-induced OIS. (A) Ingenuity network analysis of proteins with OIS-associated significant fold changes (>3 SD) at ubiquitination sites. Fold changes in ubiquitination sites were adjusted by changes on the protein level. The cut-off for observations included in the analysis was set to a 1.5-fold change. (B) Ubiquitin (UBC) is the central knot of the network ′′heriditary disorder, carbohydrate metabolism′′.
The main canonical pathways affected in the ubiquitinome of senescent cells were eIF2 signaling (−logp = 9.90), eIF4 and p70S6K signaling (−logp = 8.00), and mTOR signaling (−logp = 5.02) (Fig. 5A). These identified pathways transmit mitogenic signals to induce cell growth and proliferation. The mTOR pathway controls cell metabolism and proliferation in response to hormones, growth factors and mitogens.18 It is also activated by oncogenic RAS signaling.19 Downstream of mTOR, S6Kinase activates ribosome biogenesis and protein synthesis.20 eIF2 is a regulator of translation initiation, the rate-limiting step of protein synthesis.21,22 The 3 affected canonical pathways converge on their effector molecules, which are ribosomal proteins and translation factors (Fig. 5). The translation initiation factors eIF-2B4, eIF3L, and eIF4A1 were enriched (3.4-fold, 2.4-fold, 2.7-fold) in the OIS-associated ubiquitinome (Fig. 5B; Table S3). They are involved in formation of the ternary complex and initiation complex to start mRNA translation. Apart from that, several translation elongation factors were changed as well (Table S3). The most striking difference (9.2-fold) was observed for eEF1G, a subunit of the elongation factor-1 complex, which is responsible for the delivery of aminoacyl-tRNAs to the ribosome (Table S3). The 40S ribosomal subunits RPS4X, and RPS7 were enriched (2.3-fold and 2.7-fold respectively), whereas RPS20 was decreased (−3.7-fold). The 60S ribosomal subunits RPL10, RPL11, and RPL35a were also increased (2.1-fold, 2.8-fold and 2.7-fold, respectively), while RPL18 was decreased (−8.6-fold) in the OIS ubiquitinome (Fig. 5B; Tables S3 and S4). In addition, we observed enriched ubiquitination of isoleucyl-, glutamine-, and tyrosine-tRNA-ligase, (65-fold, 5.3-fold, and 3.0-fold respectively), which synthesize amino acid-loaded tRNAs for protein synthesis (Table S3). These identified changes cumulatively indicate an effect on ribosome biogenesis and translation in OIS. Taken together, the OIS-associated changes in ubiquitination of many functionally different components of the translation machinery might indicate a general effect on protein synthesis (Fig. 6).
Figure 5.
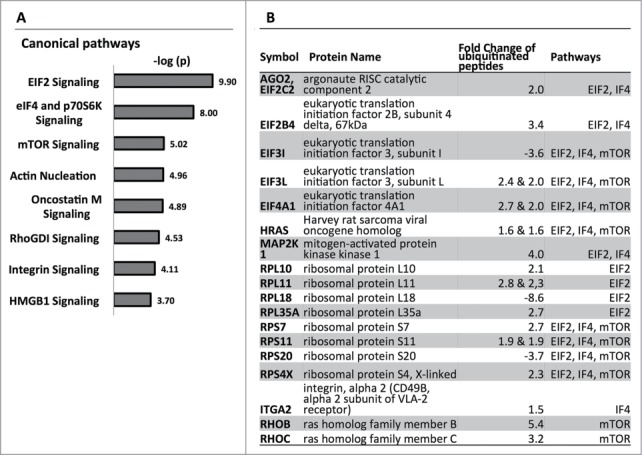
Canonical pathways affected by ubiquitinome alterations in RAS-induced OIS. (A) Ingenuity pathway analysis of proteins with OIS-associated significant fold changes (>3 SD) at ubiquitination sites. Fold changes in ubiquitination sites were adjusted by changes on the protein level. The cut-off for observations included in the analysis was set to a 1.5-fold change. (B) Focus molecules of the affected pathways with respective fold changes at ubiquitination sites.
Figure 6.
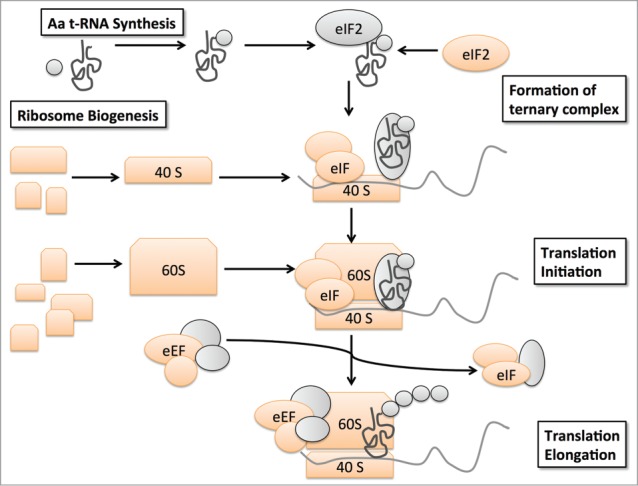
Schematic representation of translation machinery components affected by OIS-associated changes in ubiquitination. OIS-associated ubiquitination changes occur in amino acyl-tRNA-ligases, eukaryotic translation initiation factors, elongation factors, small and large ribosomal subunits (depicted in orange).
Discussion
OIS is a cellular process that involves dramatic functional and morphologic changes inducing a stable cell growth arrest. This is reflected by alterations in the proteome.9 Our study reveals that ubiquitination is implicated in OIS-associated remodelling of the proteome. Global proteome comparison of RAS-induced senescent and control fibroblasts showed significant changes in fibroblast proteins, oncogenic signaling, structure molecules, and replication. In addition, typical OIS-related changes were observed in cell cycle control, DNA replication and in cytokines typically secreted in senescence. Our analysis of the OIS-associated ubiquitinome showed significant changes in 397 ubiquitination sites. Correcting the fold changes of the ubiquitinated peptides by protein level changes (indicated by the global proteome analysis), as we have done here, may result in the loss a few biologically meaningful changes from the data set. However, it filters out cases where the protein abundance level has changed but the stoichiometry of ubiquitin modification has not changed. This should make the ubiquitinome data more reliable as changes in ubiquitin stoichiometry are more likely to affect the biological phenotype. IPA analysis revealed that the molecular networks most affected in the OIS ubiquitinome were hereditary disorder and carbohydrate metabolism, developmental disorder, muscular and skeletal disorders, protein synthesis, and cancer. A role of carbohydrate metabolism for the maintenance of senescence has been established before.23,24 The main signaling pathways affected were eIF2, S6Kinase and mTOR signaling. All of these pathways regulate cell growth and proliferation.25 They also share common downstream effector proteins: translation initiation and elongation factors and ribosomal subunits. These effectors control protein synthesis by regulating cap-dependent translation of mRNAs, ribosome biogenesis and tRNA loading.20,26,27 Since K-ε-G-G MS/MS does not discriminate between poly- and monoubiquitinated sites, 17 detection of an enhanced ubiquitination implies either increased degradation of the target protein or changes in protein function. Our findings suggest that mRNA translation may be altered in OIS as a consequence of ubiquitination changes in several components of the translation machinery.
There is evidence for ubiquitination of ribosomal proteins in response to mitogenic signals.28 Continuous mitogenic/oncogenic signaling, as in OIS, causes ribosomal stress that affects translation initiation.29 Importantly, translation is not completely shut down in senescent cells, since they remain metabolically active and protein synthesis is a prerequisite for the induction of the senescence associated secretory phenotype (SASP). Inhibiting protein synthesis by cycloheximide treatment prevents fibroblasts from RAS-induced senescence.9 It is therefore likely that protein synthesis is differentially regulated by ubiquitination in a way that decreases general mRNA translation while enhancing translation of mRNAs encoding for OIS-relevant proteins such as SASP factors. Regulation of mRNA translation could be an important means to alter the proteome and enforce the OIS phenotype. Compared with changes in transcription, changes in translation induced by ubiquitination may represent a fast and efficient way to drive OIS-associated phenotypes. Together, our data suggest that ubiquitination represents an important regulatory mechanism during OIS.
Cellular senescence is an important tumor suppression mechanism and has been suggested as an alternative to apoptosis induction for developing cancer therapeutics.30 Our findings indicate that ubiquitination affects key components of the translation machinery to regulate protein synthesis during oncogene-induced senescence. These findings suggest that targeting aspects of the ubiquitination system with small molecules or biological reagents31 to regulate translation machinery may represent new strategies for inducing cancer cells to undergo senescence.
Materials and Methods
Cells and culture conditions
Human primary IMR90 fibroblasts were obtained from ATCC and cultured according to ATCC and in DMEM, 10% FCS, 1% L-glutamine, 1% non-essential amino acids, 1% NaHCO3, 1% Penicillin/Streptomycin. Experiments were performed on IMR90 cells between population doubling #25–30. The plasmid pBabe-neo-H-RASG12V 5 was used to generate retrovirus for RAS overexpression in IMR90 fibroblasts. Retrovirus production and transduction were performed as described previously using Phoenix cells to package the infection viruses.32 An empty pBabe vector plasmid was used as a control. IMR90 fibroblasts were infected twice and selected with 1 µg/ml puromycin (Sigma #P8833).
Western blot, β-Galactosidase staining, and BrdU labeling
Cell lysates for Western blot were collected in RIPA buffer supplemented with complete protease inhibitor cocktail (Roche #1183617001). SA-β-galactosidase staining and BrdU labeling was performed as described earlier.5,7
SILAC labeling
SILAC (Invitrogen #MS10030) labeling of IMR90 fibroblasts with heavy 13C6-lysine and 13C6-arginine or control light 12C6-lysine and 12C6-arginine SILAC medium was performed for 5 passages prior to induction of senescence and maintained in the respective medium during the experimental period. To prevent degradation of ubiquitinated proteins, cells were treated with MG132 (5 µM) (Sigma #C2211) for 5 h before cell harvest.
Sample preparation
Cells were lysed with 8 M urea, 50 mM Tris-Cl (pH8), 1 mM EDTA, 1 mM Na3VO4, 2.5 mM sodium pyrophosphate. Protein concentration was measured by BCA protein assay (Thermo Scientific #PI-23227). For immune affinity enrichment, 5.4 mg of experimental sample was created by mixing equal amounts of lysates (2.7 mg each) from IMR90 cells expressing oncogenic RAS (heavy SILAC labeled) or controls transfected with empty vector (light SILAC labeled). To evaluate technical and biological reproducibility of the proteome analysis pipeline, equal amount of lysates from control cells grown in light and heavy SILAC medium were mixed at 1:1 ratio. All combined heavy/light samples were reduced with 5 mM DTT, pH 8, 37°C, 45 min, alkylated with 10 mM Iodoacetamide, pH 8, 37°C, 30 min and quenched with 10 mM cysteine, pH 8, 37°C, 30 min. The samples were then digested with modified trypsin (Promega; enzyme:protein = 1:100) for 4 h at a final urea concentration of 4 M, followed by overnight digestion at a final urea concentration of 2 M after adding another aliquot of trypsin. Tryptic peptides were desalted using Sep-Pak C18 (Waters Corporation, Milford, MA, USA), and ubiquitinated peptides were enriched using an antibody against the ubiquitin remnant motif (K-ε-GG) (Cell Signaling, Cambridge, UK) according to the manufacturer's protocol and subjected to LC-MS/MS analysis. For global proteome analysis without immune affinity enrichment, 18 μg of the experimental sample was separated on a SDS-PAGE gel. The gel lane was sliced into 11 equal fractions, digested with trypsin and analyzed by LC-MS/MS.
LC-MS/MS
Liquid chromatography tandem mass spectrometry (LC-MS/MS) analysis was performed on a Q Exactive mass spectrometer (Thermo Scientific) coupled with a Nano-ACQUITY UPLC system (Waters). Samples were injected onto a UPLC Symmetry trap column (180 μm i.d. × 2 cm packed with 5 μm C18 resin; Waters), and tryptic peptides were separated by RP-HPLC on a BEH C18 nanocapillary analytical column (75 μm i.d. × 25 cm, 1.7 μm particle size; Waters) using a gradient formed by solvent A (0.1% formic acid in water) and solvent B (0.1% formic acid in acetonitrile). For ubiquitin remnant enriched samples, the gradient used was: 5–28% B over 42 min, 28–50% B over 25.5 min, 50–80% B over 5 min, and constant 80% B over 7.5 min. For global proteome analysis, the gradient used was: 5–28% B over 170 min, 28–50% B over 50 min, 50–80% B over 10 min, and constant 80% B over 10 min. A 30-min blank gradient was run between sample injections to minimize carryover. Eluted peptides were analyzed by the mass spectrometer set to repetitively scan m/z from 400 to 2000. The full MS scan was collected at 70,000 resolution followed by data-dependent MS/MS scans at 17,500 resolution on the 20 most abundant ions exceeding a minimum threshold of 8,300. Peptide match was set as preferred, exclude isotopes option and charge-state screening were enabled to reject singly and unassigned charged ions.
MS data analysis
Mass spectrometry data were analyzed with MaxQuant 1.3.0.5 software.33 MS/MS data were searched against the human UniRef 100 protein database (March 2013, Protein Information Resource, Georgetown University) using full trypsin specificity with up to 2 missed cleavages, static carboxamidomethylation of Cys, and variable oxidation of Met, protein N-terminal acetylation and diglycine addition to Lys. Consensus identification lists were generated with false discovery rates of 1% at protein, peptide and site levels. Reverse hits, contaminants, and identifications without any H/L ratio were removed from all datasets. Ubiquitinated sites were determined from the GlyGly (K)Sites.txt table. Fold changes were calculated from the normalized Heavy/Light ratio. A 3 standard deviation (SD) cut-off was determined from the control heavy/light labeled sample, and was used to identify sites displaying significant change in the experimental sample. For global proteome analysis, protein identifications were obtained from the proteinGroups.txt table, and were required to have at least 2 razor+unique peptides and a minimum ratio count of 2. Fold changes of ubiquitinated sites were adjusted by the observed fold change of the respective protein in the global proteome comparison.
Ingenuity pathway analysis
QIAGEN's Ingenuity® Pathway Analysis (IPA®, QIAGEN Redwood City, www.qiagen.com/ingenuity) was employed to analyze the data. The cut-off for observations included in the analysis was set to a minimum of 1.5-fold change. Specialized tissue functions were included in disease and function analysis. Affected disease networks and canonical pathways were identified by significant abundance changes in their focus molecules.
Disclosure of Potential Conflicts of Interest
No potential conflicts of interest were disclosed.
Acknowledgments
We thank Dr. Benjamin Bitler for critical reading of the manuscript, the Wistar Proteomics Facility for assistance with the proteome analyses, and the Wistar Bioinformatics Facility for assistance with data analysis.
Funding
This work was supported in part by NIH/NCI grants R01CA160331 to R.Z., R01CA131582 to D.W.S., and an institutional grant to The Wistar Institute (NCI Cancer Core Grant CA010815).
SUPPLEMENTAL MATERIAL
Supplemental data for this article can be accessed on the publisher's website.
References
- 1.Hayflick L, Moorhead PS. The serial cultivation of human diploid cell strains. Exp Cell Res 1961; 25: 585–621; PMID:13905658; http://dx.doi.org/ 10.1016/0014-4827(61)90192-6 [DOI] [PubMed] [Google Scholar]
- 2.Yaswen P, Campisi J. Oncogene-induced senescence pathways weave an intricate tapestry. Cell 2007; 128: 233–4; PMID:17254959; http://dx.doi.org/ 10.1016/j.cell.2007.01.005 [DOI] [PubMed] [Google Scholar]
- 3.Serrano M, Lin AW, McCurrach ME, Beach D, Lowe SW. Oncogenic ras provokes premature cell senescence associated with accumulation of p53 and p16INK4a. Cell 1997; 88: 593–602; PMID:9054499; http://dx.doi.org/ 10.1016/S0092-8674(00)81902-9 [DOI] [PubMed] [Google Scholar]
- 4.Rodier F, Campisi J. Four faces of cellular senescence. J Cell Biol 2011; 192: 547–56; PMID:21321098; http://dx.doi.org/ 10.1083/jcb.201009094 [DOI] [PMC free article] [PubMed] [Google Scholar]
- 5.Zhang R, Chen W, Adams PD. Molecular dissection of formation of senescence-associated heterochromatin foci. Mol Cell Biol 2007; 27: 2343–58; PMID:17242207; http://dx.doi.org/ 10.1128/MCB.02019-06 [DOI] [PMC free article] [PubMed] [Google Scholar]
- 6.Narita M, Nunez S, Heard E, Narita M, Lin AW, Hearn SA, Spector DL, Hannon GJ, Lowe SW. Rb-mediated heterochromatin formation and silencing of E2F target genes during cellular senescence. Cell 2003; 113: 703–16; PMID:12809602; http://dx.doi.org/ 10.1016/S0092-8674(03)00401-X [DOI] [PubMed] [Google Scholar]
- 7.Dimri GP, Lee X, Basile G, Acosta M, Scott G, Roskelley C, Medrano EE, Linskens M, Rubelj I, Pereira-Smith O, et al.. A biomarker that identifies senescent human cells in culture and in aging skin in vivo. Proc Natl Acad Sci U S Am 1995; 92: 9363–7. [DOI] [PMC free article] [PubMed] [Google Scholar]
- 8.Salama R, Sadaie M, Hoare M, Narita M. Cellular senescence and its effector programs. Genes Dev 2014; 28: 99–114; PMID:24449267; http://dx.doi.org/ 10.1101/gad.235184.113 [DOI] [PMC free article] [PubMed] [Google Scholar]
- 9.Li M, Durbin KR, Sweet SM, Tipton JD, Zheng Y, Kelleher NL. Oncogene-induced cellular senescence elicits an anti-Warburg effect. Proteomics 2013; 13: 2585–96; PMID:23798001; http://dx.doi.org/ 10.1002/pmic.201200298 [DOI] [PMC free article] [PubMed] [Google Scholar]
- 10.Chau V, Tobias JW, Bachmair A, Marriott D, Ecker DJ, Gonda DK, Varshavsky A. A multiubiquitin chain is confined to specific lysine in a targeted short-lived protein. Science 1989; 243: 1576–83; PMID:2538923; http://dx.doi.org/ 10.1126/science.2538923 [DOI] [PubMed] [Google Scholar]
- 11.Mittal R, McMahon HT. Arrestins as adaptors for ubiquitination in endocytosis and sorting. EMBO Rep 2009; 10: 41–3; PMID:19057574; http://dx.doi.org/ 10.1038/embor.2008.240 [DOI] [PMC free article] [PubMed] [Google Scholar]
- 12.Neutzner M, Neutzner A. Enzymes of ubiquitination and deubiquitination. Essays Biochem 2012; 52: 37–50; PMID:22708562; http://dx.doi.org/ 10.1042/bse0520037 [DOI] [PubMed] [Google Scholar]
- 13.Singhal S, Taylor MC, Baker RT. Deubiquitylating enzymes and disease. BMC Biochem 2008; 9 Suppl 1: S3; PMID:19007433; http://dx.doi.org/ 10.1186/1471-2091-9-S1-S3 [DOI] [PMC free article] [PubMed] [Google Scholar]
- 14.Young AR, Narita M, Narita M. Spatio-temporal association between mTOR and autophagy during cellular senescence. Autophagy 2011; 7: 1387–8; PMID:21799306; http://dx.doi.org/ 10.4161/auto.7.11.17348 [DOI] [PubMed] [Google Scholar]
- 15.Tu Z, Aird KM, Bitler BG, Nicodemus JP, Beeharry N, Xia B, Yen TJ, Zhang R. Oncogenic RAS regulates BRIP1 expression to induce dissociation of BRCA1 from chromatin, inhibit DNA repair, and promote senescence. Dev Cell 2011; 21: 1077–91; PMID:22137763; http://dx.doi.org/ 10.1016/j.devcel.2011.10.010 [DOI] [PMC free article] [PubMed] [Google Scholar]
- 16.Ong SE, Blagoev B, Kratchmarova I, Kristensen DB, Steen H, Pandey A, Mann M. Stable isotope labeling by amino acids in cell culture, SILAC, as a simple and accurate approach to expression proteomics. Mol Cell Proteomics: MCP 2002; 1: 376–86; PMID:12118079; http://dx.doi.org/ 10.1074/mcp.M200025-MCP200 [DOI] [PubMed] [Google Scholar]
- 17.Xu G, Paige JS, Jaffrey SR. Global analysis of lysine ubiquitination by ubiquitin remnant immunoaffinity profiling. Nat Biotechnol 2010; 28: 868–73; PMID:20639865; http://dx.doi.org/ 10.1038/nbt.1654 [DOI] [PMC free article] [PubMed] [Google Scholar]
- 18.Laplante M, Sabatini DM. mTOR signaling in growth control and disease. Cell 2012; 149: 274–93; PMID:22500797; http://dx.doi.org/ 10.1016/j.cell.2012.03.017 [DOI] [PMC free article] [PubMed] [Google Scholar]
- 19.Mendoza MC, Er EE, Blenis J. The Ras-ERK and PI3K-mTOR pathways: cross-talk and compensation. Trends Biochem Sci 2011; 36: 320–8; PMID:21531565; http://dx.doi.org/ 10.1016/j.tibs.2011.03.006 [DOI] [PMC free article] [PubMed] [Google Scholar]
- 20.Fonseca BD, Smith EM, Yelle N, Alain T, Bushell M, Pause A. The ever-evolving role of mTOR in translation. Semin Cell Dev Biol 2014; 36: 102–12; PMID:25263010 ; http://dx.doi.org/ 10.1016/j.semcdb.2014.09.014 [DOI] [PubMed] [Google Scholar]
- 21.Baird TD, Wek RC. Eukaryotic initiation factor 2 phosphorylation and translational control in metabolism. Adv Nutr 2012; 3: 307–21; PMID:22585904; http://dx.doi.org/ 10.3945/an.112.002113 [DOI] [PMC free article] [PubMed] [Google Scholar]
- 22.Mohammad-Qureshi SS, Jennings MD, Pavitt GD. Clues to the mechanism of action of eIF2B, the guanine-nucleotide-exchange factor for translation initiation. Biochem Soc Trans 2008; 36: 658–64; PMID:18631136; http://dx.doi.org/ 10.1042/BST0360658 [DOI] [PubMed] [Google Scholar]
- 23.Aird KM, Li H, Xin F, Konstantinopoulos PA, Zhang R. Identification of ribonucleotide reductase M2 as a potential target for pro-senescence therapy in epithelial ovarian cancer. Cell Cycle 2014; 13: 199–207; PMID:24200970; http://dx.doi.org/ 10.4161/cc.26953 [DOI] [PMC free article] [PubMed] [Google Scholar]
- 24.Aird KM, Zhang R. Nucleotide metabolism, oncogene-induced senescence and cancer. Cancer Lett 2014; 356: 204–10; PMID:24486217; http://dx.doi.org/ 10.1016/j.canlet.2014.01.017 [DOI] [PMC free article] [PubMed] [Google Scholar]
- 25.Magnuson B, Ekim B, Fingar DC. Regulation and function of ribosomal protein S6 kinase (S6K) within mTOR signalling networks. Biochem J 2012; 441: 1–21; PMID:22168436; http://dx.doi.org/ 10.1042/BJ20110892 [DOI] [PubMed] [Google Scholar]
- 26.Iadevaia V, Liu R, Proud CG. mTORC1 signaling controls multiple steps in ribosome biogenesis. Semin Cell Dev Biol 2014; 36: 113–20; PMID:25148809; http://dx.doi.org/ 10.1016/j.semcdb.2014.08.004 [DOI] [PubMed] [Google Scholar]
- 27.Laplante M, Sabatini DM. mTOR Signaling. Cold Spring Harbor Perspect Biol 2012; 4; PMID:22129599; http://dx.doi.org/ 10.1101/cshperspect.a011593; http://www.ncbi.nlm.nih.gov/pubmed/22129599 [DOI] [PMC free article] [PubMed] [Google Scholar]
- 28.Sun XX, DeVine T, Challagundla KB, Dai MS. Interplay between ribosomal protein S27a and MDM2 protein in p53 activation in response to ribosomal stress. J Biol Chem 2011; 286: 22730–41; PMID:21561866; http://dx.doi.org/ 10.1074/jbc.M111.223651 [DOI] [PMC free article] [PubMed] [Google Scholar]
- 29.Das S, Fregoso OI, Krainer AR. A new path to oncogene-induced senescence: at the crossroads of splicing and translation. Cell Cycle 2013; 12: 1477–9; PMID:23624837; http://dx.doi.org/ 10.4161/cc.24749 [DOI] [PMC free article] [PubMed] [Google Scholar]
- 30.Perez-Mancera PA, Young AR, Narita M. Inside and out: the activities of senescence in cancer. Nat Rev Cancer 2014; 14: 547–58; PMID:25030953; http://dx.doi.org/ 10.1038/nrc3773 [DOI] [PubMed] [Google Scholar]
- 31.Popovic D, Vucic D, Dikic I. Ubiquitination in disease pathogenesis and treatment. Nat Med 2014; 20: 1242–53; PMID:25375928; http://dx.doi.org/ 10.1038/nm.3739 [DOI] [PubMed] [Google Scholar]
- 32.Zhang R, Poustovoitov MV, Ye X, Santos HA, Chen W, Daganzo SM, Erzberger JP, Serebriiskii IG, Canutescu AA, Dunbrack RL, et al.. Formation of MacroH2A-containing senescence-associated heterochromatin foci and senescence driven by ASF1a and HIRA. Dev Cell 2005; 8: 19–30; PMID:15621527; http://dx.doi.org/ 10.1016/j.devcel.2004.10.019 [DOI] [PubMed] [Google Scholar]
- 33.Cox J, Mann M. MaxQuant enables high peptide identification rates, individualized p.p.b.-range mass accuracies and proteome-wide protein quantification. Nat Biotechnol 2008; 26: 1367–72; PMID:19029910; http://dx.doi.org/ 10.1038/nbt.1511 [DOI] [PubMed] [Google Scholar]
Associated Data
This section collects any data citations, data availability statements, or supplementary materials included in this article.


