Abstract
Angiogenesis, the process by which new vessels form from existing ones, plays an important role in many developmental processes and pathological conditions. We study angiogenesis in the context of a highly controllable experimental environment: the cornea micropocket assay. Using a multidisciplinary approach that combines experiments, image processing and analysis, and mathematical modelling, we aim to provide mechanistic insight into the action of two angiogenic factors, vascular endothelial growth factor A (VEGF-A) and basic fibroblast growth factor (bFGF). We use image analysis techniques to extract quantitative data, which are both spatially and temporally resolved, from experimental images, and we develop a mathematical model, in which the corneal vasculature evolves in response to both VEGF-A and bFGF. The experimental data are used for model parametrization, while the mathematical model is used to assess the utility of the cornea micropocket assay and to characterize proposed synergies between VEGF-A and bFGF.
Keywords: partial differential equation, vascular endothelial growth factor A, basic fibroblast growth factor, angiogenesis, cornea, image analysis
1. Introduction
Angiogenesis, the process by which blood vessels are formed and maintained, has received considerable attention in recent years due to its importance in several developmental processes and pathological conditions. In adult humans, blood vessels usually reside in a mature, inactive state which corresponds to a normal coverage of pericytes which produce high levels of stabilizing angiopoietin-1 (Ang-1) [1]. However, exposure to angiogenic factors (AFs), such as vascular endothelial growth factor A (VEGF-A) and basic fibroblast growth factor (bFGF), can destabilize vessels, prior to vascular growth. Briefly, in non-pathological conditions, such as wound healing, binding of VEGF-A to its receptors on the endothelial cells (ECs) lining vessels induces the production and release of angiopoietin-2 (Ang-2) [2]. Over-expression of Ang-2 leads to the further activation of ECs and the detachment of pericytes from mature vessels. This allows ECs to escape the vessel, proliferate and collectively invade the surrounding extracellular matrix (ECM) as a growing sprout. Through dynamic and continuous inter- and intracellular signalling, ECs near the front of a growing sprout compete to occupy the tip position [3]. Such tip cells are typically non-proliferative, being responsible for guiding sprout growth in response to AFs and other signals. Meanwhile, stalk cells behind the tip proliferate to ensure that a contiguous border is maintained between the sprout tip and its parent vessel. In this way, new immature vessels are produced, which may become perfused if they anastomose with another vessel. The ECs associated with immature vessels produce platelet-derived growth factor-B, which, in turn, stimulates the proliferation of pericytes and their migration towards the immature vessels [4], promoting vessel stabilization and maturation.
Evidently, angiogenesis is an intricate process which integrates phenomena acting over numerous biological scales and involves many cell types and chemical signalling factors. The process becomes even more complex when viewed within the context of a growing tumour where an imbalance between the tumour's need for energy and the complementary secretion of AFs can result in pathological vessel formation. Thus, to gain insight into the processes involved in intra-tumoural angiogenesis, simpler assays such as the mouse cornea micropocket assay are often used [5]. Here, a pellet containing an AF is inserted into the stromal layer of a mouse cornea. The AF diffuses throughout the cornea and, on reaching the limbal vessels, a set of vessels encircling the cornea, stimulates vessel sprouting and growth towards the pellet over a period of approximately one week, after which time the angiogenic response is recorded, usually by measuring the area of neovascularization. The visibility and normally avascular nature of the cornea provide distinct advantages over other in vivo angiogenesis assays and, as such, cornea-based experiments often form an integral part of pre-clinical drug trials. They are often used by research institutions to confirm the potency of AFs [6] and the efficacy of candidate anti-angiogenic drugs [7], both in isolation and in combination.
To complement our experimental study of angiogenesis in the cornea, we have adopted a mathematical modelling approach, which aims to provide quantitative insight into the processes underlying angiogenesis. In our combined study, we focus on VEGF-A165 because it has been shown to be the dominant VEGF-A isoform in normal vascular development (see [8] and references therein), and on bFGF because of its important role in tumour-induced angiogenesis [9]. Our theoretical approach follows that first introduced by Balding & McElwain [10] and extended by Byrne & Chaplain [11] and others (for a comprehensive review see [12], where alternative modelling approaches are also discussed). These models were originally developed to establish qualitative agreement with experimental data, incorporating essential phenomena such as chemotaxis (movement in response to gradients in an AF), and typically focus on the action of a single AF, such as VEGF-A. However, owing to recent advances in imaging technology which can yield spatio-temporal data, it is now possible to parametrize and validate such mathematical models, allowing us to extend their predictive and hypotheses-testing capabilities.
Recent mathematical modelling efforts have attempted to link quantitative experimental data with tissue scale simulation of angiogenesis. In particular, Tong & Yuan [13] developed a model which predicted the angiogenic response of the corneal vasculature to bFGF. They analysed experimental images at a single time-point, exploiting a semi-automatic method for segmenting vascular networks [14], and compared the location of the vascular front and total vessel length in experiments and simulations. Meanwhile, Watson et al. [15] used dynamic data detailing the location of migrating fronts of astrocytes and capillary tips to parametrize their model of vascular growth in the developing retina. Such efforts to link quantitative experimental data with results from simulations illustrate the potential for integrating mathematical modelling with image analysis techniques to increase insight into the phenomena underlying angiogenesis.
Building on these efforts, we use image processing techniques to extract spatio-temporal data from experimental images which are cheaply and routinely collected during cornea micropocket experiments. These data, which reveal how the vascular density develops behind the invading front of capillary tips, are used to parametrize a mathematical model, which describes how the corneal vasculature responds to both VEGF-A165 and bFGF. Simulations of our parametrized model yield experimentally testable predictions regarding the angiogenic potency of VEGF-A and bFGF when administered in combination, and the effect of anti-VEGF-A therapies on bFGF-induced angiogenesis. Parameter sensitivity analysis of our mathematical model also generates insight into the limitations of the cornea micropocket assay. Crucially, our image analysis provides a more detailed description of angiogenesis than has previously been used for comparison with simulation results. In particular, our results suggest useful constraints on the model's parameter values that correspond to biologically relevant behaviour. This increases our confidence in the predictions generated by the mathematical model. In summary, our study demonstrates the benefits of exploiting the synergistic relationship between image analysis and mathematical modelling within an integrated approach to angiogenesis research.
2. Material and methods
2.1. Animals
The experimental details have been reported previously [7]. Briefly, female Balb/c mice, 8–10 weeks old, were maintained under specific pathogen-free conditions with daily cycles of 12 L/12 D.
2.2. Corneal angiogenesis model
As in [7], nylon pellets (Nylaflo®, Pall Corporation, Michigan) of radius 0.3 mm and thickness 0.06 mm were implanted into the cornea of anaesthetized mice approximately 1 mm from the anterior portion of the limbal vessels using a surgical blade and sharp tweezers. Pellets initially contained 300 ng of VEGF-A165 (n = 9), 15 ng of bFGF (n = 10) or vehicle. Images of the neovascular response were captured 3 and 5 days after implantation. Figure 1 shows representative images from the VEGF-A165 experiments.
Figure 1.
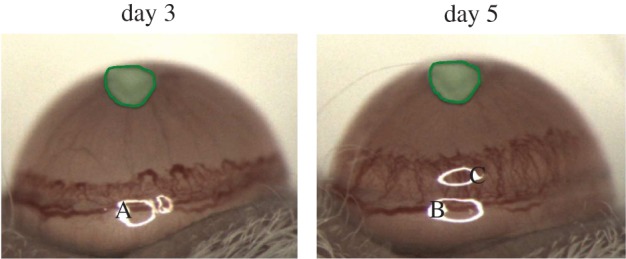
Representative images from a cornea micropocket experiment where a pellet containing 300 ng of VEGF-A165 was placed approximately 1 mm away from the limbal vessels inside the cornea of a mouse. The pellet is highlighted in each image. A, B and C are artefacts present due to the camera lighting.
2.3. Image analysis
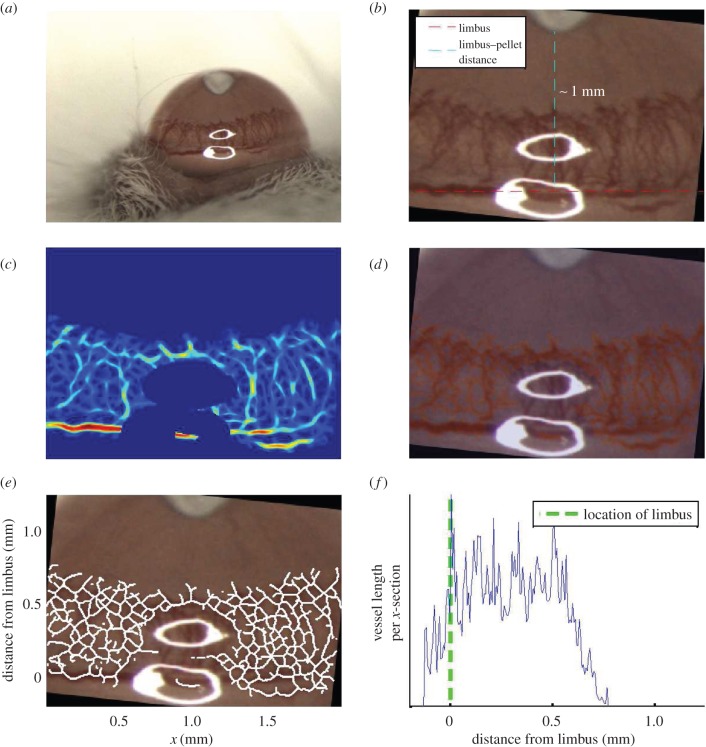
A series of semi-automated procedures were used to segment the vascular networks. Primarily we exploited an extended array of Gaussian matched filters [16] of varying widths to enhance the contrast between the vasculature and background in each image. An automated thresholding procedure, local entropy thresholding [17], was then used to perform an initial segmentation of the vasculature from the enhanced images. To ensure the accuracy of the segmentations, initial threshold levels were subsequently tuned by eye, where necessary. To the segmentation masks, we applied a thinning procedure to reveal the vascular network skeletons. These skeletons provide a map of the locations of the centre-lines of the vessels in our images. Figure 2 summarizes the stages involved in processing each image (further details are contained in the electronic supplementary material).
Figure 2.
Series of steps involved in analysing images from cornea micropocket experiments. (a) Typical image obtained from experiments. (b) The image is cropped and rotated such that the limbus is orientated along the horizontal axis of the rotated image. (c) The vasculature is enhanced using an array of Gaussian matched filters and troublesome regions of the image are removed (e.g. the saturated pixels). (d) The enhanced image is thresholded to reveal a binary vessel network mask. (e) The mask is skeletonized to reveal the backbone of the vascular network. (f) The skeletonized network is used to create a vascular density profile (see main text).
Our images are of an appropriate type and quality to provide quantitative estimates for vascular densities in the cornea. Thus, to facilitate the comparison of experimental images and the mathematical model we counted the number of vessels along each plane perpendicular to the direction in which vascular growth occurs on average (the x-direction in our skeletonized images, figure 2e). We used these vessel counts to estimate the average vascular density, measured in metres of vessel m–3, at all locations between the pellet and limbus. These data are used to generate a vascular density profile, which depicts how the average vascular density varies across each cornea image, moving from the limbal vessels towards the pellet. The data presented in figure 2f show how the average vascular density varies with distance from the limbal vessels for a typical experiment. This process is fully automated and, for simplicity, the curvature of the eye is neglected in our analysis.
Regarding the extraction of further details of vascular network morphology, the images depict a two-dimensional projection of a three-dimensional structure. Thus, even with perfect segmentation, it would not be possible to reliably extract from the images the locations of anastomoses and the lengths of individual vessels, for example.
2.4. Mathematical model of corneal angiogenesis
To fully exploit the information contained in images obtained from the corneal micropocket experiments (figure 1), we developed a simple mathematical model of corneal angiogenesis which is appropriate for the coarse-grained data that such images provide. In particular, our aim was to develop a model which would allow us to capture essential interactions between two of the most potent AFs involved in intra-tumoural angiogenesis, VEGF-A165 and bFGF. As such, many of the detailed cell–cell and chemical interactions involved in, for example, vessel dematuration and maturation, addressed in detail in other models [18], are neglected here. We believe that adding such complexities to our model would be premature, bearing in mind the coarseness of our data. Moreover, the inclusion of these details would detract from the major focus of our model. Equally, the complex dynamics of AF interactions with endogenous inhibitors and ECM components within the cornea has not been considered here. While these interactions surely affect the distribution and delivery of AFs to the vasculature, we have chosen to adopt a simplified AF transport model given the lack of data available to confirm the accuracy of a more detailed model.
We now introduce our mathematical model, summarizing the key assumptions and processes included in the model. Further details are presented in the electronic supplementary material.
2.4.1. Model overview
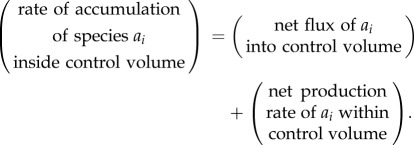
Our model builds on existing ones [10,11], which describe the spatio-temporal evolution of sprout tips, vessels and a generic AF. The governing equations are based on conservation laws which assume that for each model species, ai, the following balance holds true:
 |
2.1 |
In one-dimensional Cartesian geometry, (2.1) may be written as
| 2.2 |
where  is the flux of species ai,
  is its net rate of production per unit volume and
  represents its density. In models such as these, flux terms describe how each species moves. Sprout tips, for instance, are assumed to move by a combination of chemotaxis (in response to gradients in, for example, VEGF-A), haptotaxis (in response to gradients in cellular adhesion sites) and random motion, whereas AF transport is due to diffusion alone. While vessels are assumed to be static, the way in which they are created is related to how sprout tips move. More specifically, as a tip migrates it is assumed to leave behind it a trail of cells, which form the body of a vessel, via a process known as the snail-trail approach. The main underlying assumption used here is that the length of vessels produced in a control volume per unit time is proportional to the number of tips leaving that control volume per unit time (figure 3). Sprout tips are produced when an AF interacts with a vessel and are annihilated when they undergo anastomosis. Furthermore, both tips and vessels may die, or regress, under certain conditions. AFs may be released from cells or other sources and, as they diffuse, may be taken up by cells or vessels, or may decay naturally. The level of detail in which all of these processes are modelled varies and, in some cases, processes are neglected entirely.
Figure 3.
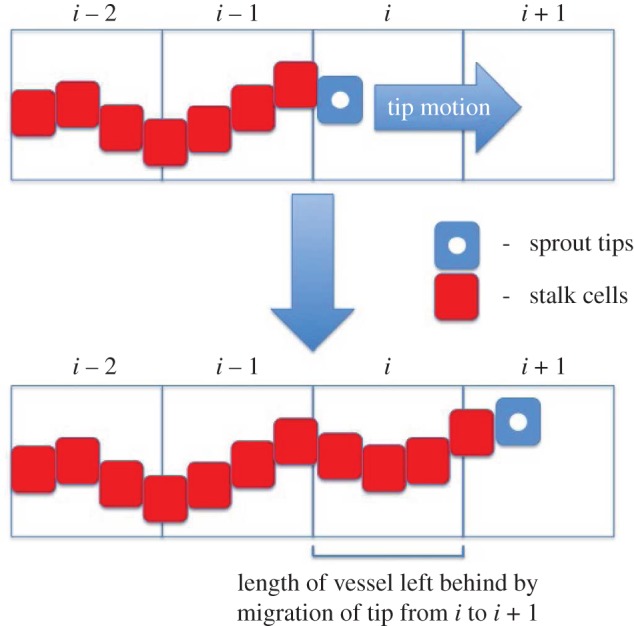
Schematic of the snail-trail approach. As a tip moves from one location to the next it leaves in its wake a length of vessel. (Online version in colour.)
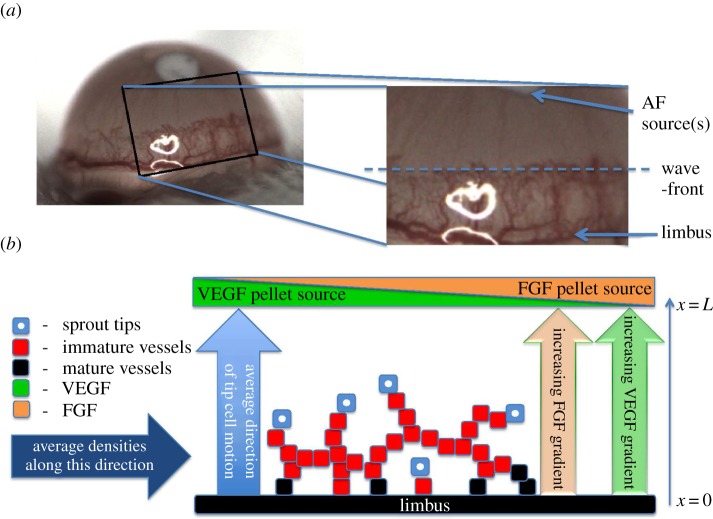
The model we present is a specialization and extension of the models in the aforementioned references, based on complementary cornea micropocket assay experiments (§2.2), in which vascular growth may occur in response to two distinct and specific AFs, VEGF-A165 and bFGF. We assume that the vascular front, as it advances towards the pellet, can be approximated by a straight line. Figure 4a provides motivation for this assumption while a schematic of our model is presented in figure 4b. By considering dependent variables which represent averages in the plane perpendicular to the average direction of tip cell motion, we restrict attention to one spatial dimension. Thus, the independent variables in our model are time, t, and space, x, where the x-axis is parallel to the average direction of tip cell motion. The limbus is located at x = 0 and the source of AFs at x = L.
Figure 4.
Relationship between the mathematical model and the experimental system. (a) The region of interest in experimental images. (b) Schematic of the cornea micropocket assay, on which our mathematical model is based. Tips are assumed to migrate (and thus vessels grow), on average, in the direction of increasing AF concentration, i.e. towards the pellet(s). For simplicity, we formulate our model in terms of dependent variables which represent quantities averaged in the plane perpendicular to the average direction of tip motion. Both VEGF-A165 and bFGF pellets are assumed to be located at x = L.
Following [10,11], we consider separately the dynamics of sprout tips and vessels. Owing to the importance of vessel maturity in vascular development, we further decompose vessels according to their maturity. Since we focus on angiogenesis and are not concerned with the delivery of nutrients to a tumour, we do not distinguish between perfused and unperfused vessels; vessels in our model implicitly include both perfused and unperfused sub-populations. In summary, we develop equations for the average density of tips, the average length density of (immature and mature) vessels, the average concentration of VEGF-A165, and the average concentration of bFGF. We also model the mean concentration of VEGF-A165 and bFGF in their respective pellets.
2.4.2. Modelling mature and immature vessels
Both bFGF and VEGF-A165 are assumed to induce vessel dematuration. VEGF-A165 and bFGF induce dematuration at rates proportional to the fraction of bound VEGF receptor 2 (VEGFR-2) AND FGF receptor 1 (FGFR-1), respectively. Meanwhile, since maturation is expected to take place on a longer time scale than dematuration, and little maturation is expected to take place in bFGF and VEGF-A165 experiments [6], to simplify our model we neglect vessel maturation. Based on evidence in [19], mature vessels are viewed as immobile and stable, and only dematuration contributes to their evolution.
Immature vessels are produced as a result of tip movement, via the snail-trail approach. Meanwhile, we assume that ECs associated with immature vessels rely on VEGF-A165 and bFGF for survival. Therefore, in the absence of both VEGF-A165 and bFGF, immature vessels regress.
2.4.3. Modelling sprout tips
Both VEGF-A165 and bFGF binding to immature vessels stimulate the production of sprout tips. As for immature vessels, in the absence of both VEGF-A165 and bFGF, tips die. They are also annihilated when they undergo anastomosis with vessels or other tips. Sprout tips move via chemotaxis (in response to spatial gradients in both VEGF-A165 and bFGF) and also undergo random motion.
2.4.4. VEGF-A165 and bFGF crosstalk
It is widely believed that bFGF induces angiogenesis upstream of VEGF-A, partly via the VEGF-A/VEGFR-2 system [20]. More specifically, exposure to bFGF is believed to upregulate the expression of VEGFR-2 [21] and stimulate ECs to produce VEGF-A [22]. This may explain why blockade of the VEGF-A/VEGFR-2 pathway inhibits FGF-induced angiogenesis [22]. By contrast, blockade of FGF/FGFR signalling appears to have a less marked effect on VEGF-A-induced angiogenesis [20]. In our model, we incorporate this crosstalk. We suppose that the number of VEGFR-2 molecules per EC increases linearly with the fraction of bound FGFR-1 receptors and that this increased receptor density, in turn, leads to increased uptake of VEGF-A165 by ECs, increased VEGF-A165-induced sprouting and increased dematuration in the presence of VEGF-A165. We also include an additional source term in the VEGF-A165 equation to model EC release of VEGF-A165 at a rate proportional to the bound fraction of FGFR-1 molecules.
2.4.5. Modelling the VEGF-A165 and bFGF distributions
AF distributions are assumed to depend on diffusion, natural decay, EC uptake and drainage through the vasculature. The release of AFs from pellets is incorporated into our model by imposing appropriate boundary conditions, described in brief below.
2.4.6. Initial and boundary conditions
In the absence of external stimuli, the cornea is avascular, bordered by a network of mature limbal vessels [23]. Accordingly, we model the initial distribution of vessels as a normally distributed collection of mature vessels, centred on x = 0. Meanwhile, the concentrations of both VEGF-A165 and bFGF are initially zero across the whole model domain. Within the constraints of our model, these initial conditions are consistent with the assumption that the system is initially in a steady state and that the limbal vessels are mature and quiescent. At x = 0, we assume that the flux of AFs out of the domain is due to removal by the limbal vasculature. The boundary conditions for AFs at x = L are discussed separately below. For simplicity, we assume that sprout tips are unable to penetrate the pellet and that the limbus forms a barrier through which they cannot pass.
2.4.7. Modelling the controlled release of bFGF and VEGF-A165
The release of AFs from the pellets is incorporated via boundary conditions at x = L and is based on an approach presented in [13]. We assume that the concentration of AFs in the pellets is spatially uniform and that they bind reversibly to components contained within the pellets. Further, while bound AFs do not decay, unbound AFs decay at a constant rate. AFs also diffuse from the pellet into the cornea at a rate proportional to the difference in AF concentrations across the pellet interface. By coupling the concentrations of VEGF-A165 and bFGF in the pellet (at x = L) with their concentrations in our spatial domain (0 ≤ x < L), we can investigate the effects of altering the release dynamics of the AFs from a pellet using physically motivated parameters. Additionally, we can control the amount of VEGF-A165 or bFGF that is released into the cornea throughout a simulation.
2.5. Mathematical model simulation and parametrization
The mathematical model was solved using the method of lines, executed in Matlab®. Where possible model parameter values were estimated from published data; otherwise, physical arguments or previous modelling efforts were used to estimate them. Where neither of these options was viable, parameter values were manually tuned such that model simulation results were in good agreement with the data extracted from experimental images (§3, figure 5). See the electronic supplementary material for details of the model parametrization and method of numerical solution.
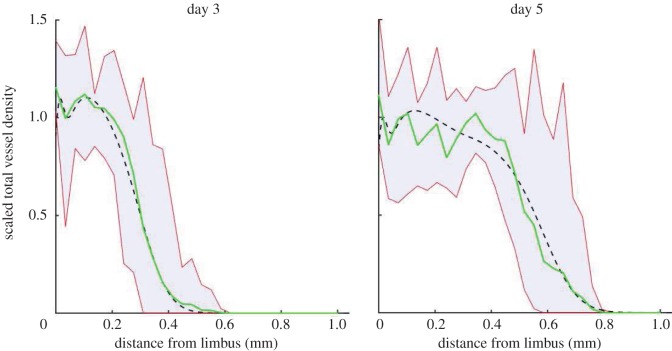
Figure 5.
Vessel density profiles obtained from the semi-automated segmentation of cornea images for (a) VEGF-A165 and (b) bFGF. The mean vessel density profile is shown as the range of vessel densities at each location across all experiments (shaded region). (Online version in colour.)
When generating numerical simulations, we focused on four in vivo scenarios (A1–A4). Defining, for convenience, [VT]init and [FT]init as the initial concentrations of VEGF-A165 and bFGF in pellets, respectively, we considered:
(A1) Control experiments: [VT]init = [FT]init = 0.
(A2) VEGF-A165 experiments: [VT]init at its default value, [FT]init = 0.
(A3) bFGF experiments: [VT]init = 0, [FT]init at its default value.
(A4) bFGF + VEGF-A165 experiments: [VT]init and [FT]init are set to their default values.
Simulations of bFGF experiments and VEGF-A165 experiments (A2 and A3) were used for model parametrization. We then used the model to predict the effect of simultaneous administration of bFGF and VEGF-A165 (A4).
3. Results
3.1. Experimental observations
For each set of experiments, VEGF-A165 (n = 9) and bFGF (n = 10), and at each time-point, the vascular density profiles (e.g. figure 2f) were averaged (over the experimental repeats) and the results are shown in figure 5. Our image analysis reveals that, while the vasculature travels further towards the bFGF pellets, the mean density of the neovasculature is transiently greater when VEGF-A165 pellets are used. Our results also suggest that bFGF pellets induce a more sustained angiogenic response than their VEGF-A165 counterparts. In what follows, mathematical model results were compared to the averaged, dynamic and spatially resolved data presented in figure 5.
3.2. Model parametrization and general model behaviour
A1. Control experiments
For in vivo control experiments, when no AF was administered, no angiogenic response was recorded. For the in silico experiments, in the absence of external stimuli ([VT]init = [FT]init = 0) the dependent variables remain unchanged from their initial values: the limbal vessels remain mature and no growth is stimulated, consistent with the in vivo experiments.
A2. VEGF-A165-induced angiogenesis experiments
Figure 6 shows the results of model simulation when default parameter values are used and VEGF-A165 alone is administered. Typical simulations proceed as follows. Initially, VEGF-A165 is released from the pellet, causing the VEGF-A165 concentration adjacent to it to increase rapidly until it reaches a maximum value at approximately t = 4.5 h (data not shown). Thereafter, as VEGF-A165 levels in the pellet decline, the VEGF-A165 concentration in the cornea adjacent to it also declines. At the same time, VEGF-A165 diffuses across the cornea towards the limbal vessels, where it stimulates vessel dematuration and the production of sprout tips. The tips migrate up spatial gradients of VEGF-A165, towards the pellet, leaving behind them a trail of vessels. Since vessels are VEGF-A165 sinks, continued vascular growth creates a barrier to the VEGF-A165, preventing it from reaching the limbal vasculature. Consequently, because it depends on VEGF-A165 levels, tip production at the limbus halts and is localized instead around the leading edge of the vascular front. Such behaviour is consistent with that observed in retinal angiogenesis experiments [24], justifying our choice of parameter values. As the simulation proceeds, and VEGF-A165 levels in the pellet dwindle, the rates of tip production and migration slow, and significant levels of vessel regression occur. This is evidenced by a reduction in the amplitude of the non-dimensionalized vascular density from 1.1 to 1 between days 3 and 5 in figure 6 (see the electronic supplementary material for details of model non-dimensionalization).
Figure 6.
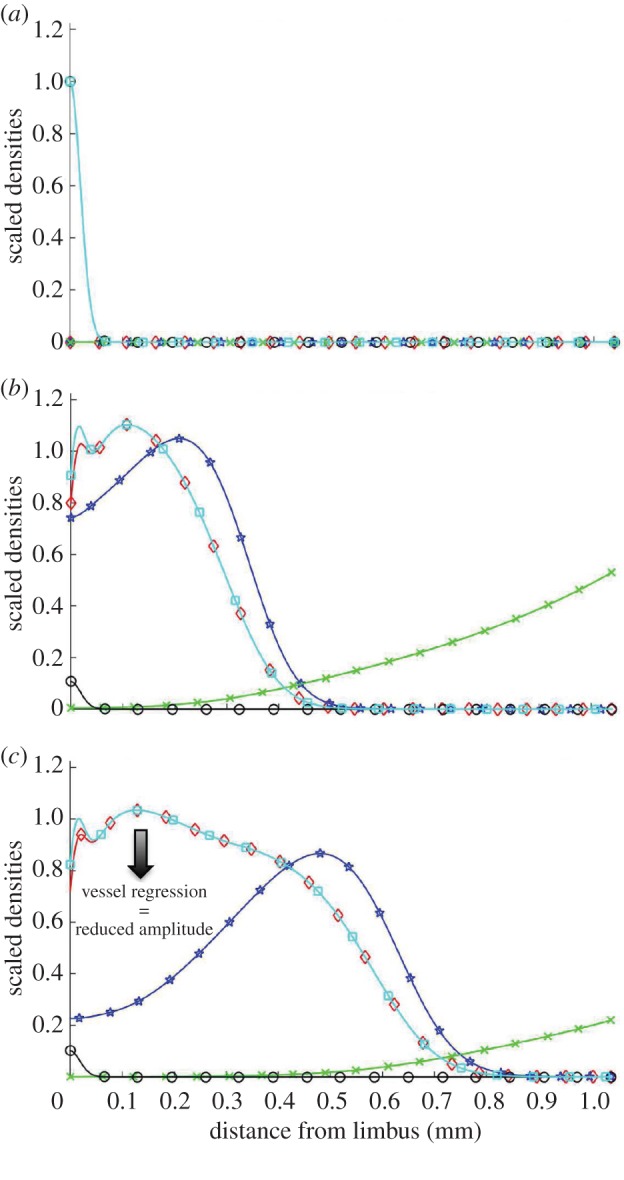
Results from a typical numerical simulation of our mathematical model showing the angiogenic response of the limbal vessels to a VEGF-A165 pellet implanted in the cornea. Non-dimensionalized distributions of all state variables are overlaid for three time-points. Total vessel density (mature + immature), squares; mature vessel density, circles; immature vessel density, diamonds; sprout tip density, stars; VEGF-A165 concentration, crosses. (a) Initial conditions. The cornea is initially avascular and contains no VEGF-A165. Mature limbal vessels border the cornea. (b) Day 3 results. VEGF-A165 is released from the pellet and diffuses towards the limbus where it stimulates vessel dematuration and tip production. The tips migrate by chemotaxis towards the pellet, leaving behind them a trail of immature vessels. (c) Day 5 results. As VEGF-A165 levels in the pellet decline, vascular growth slows and vessel regression occurs near the limbus (arrow). (Online version in colour.)
Figure 7 shows that the model is in good agreement with data extracted from experimental images when default parameter values are used (root mean squared error, RMSE = 0.075). Model results are consistent with the experimental data in terms of the amplitude of the vascular density, the extent to which vascular growth towards the pellet has occurred and also the overall shape of the vascular density profiles at both time-points of interest. Demonstrating consistency of simulation results with these data allows us to fix model parameters associated with VEGF-A165-induced angiogenesis.
Figure 7.
Comparison of model results with data from VEGF-A165 experiments when default parameters are used. The dashed lines show model predictions, the solid lines show averaged experimental data and the shaded regions show the range in densities across the experimental dataset. (Online version in colour.)
A3. bFGF-induced angiogenesis experiments
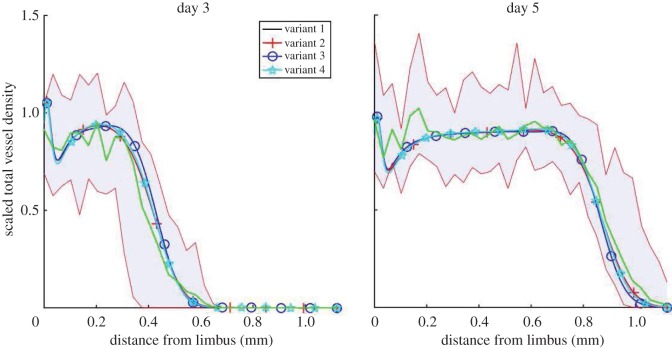
To determine the impact of VEGF-A/bFGF crosstalk on the angiogenic response of the corneal vasculature, we performed in silico knock-out experiments, in which different crosstalk terms were eliminated in turn. The four model variants we consider are summarized in table 1. Each variant is parametrized so that it is quantitatively consistent with the data from bFGF-induced angiogenesis experiments (figure 5b). This allows us to fix model parameters related to bFGF-induced angiogenesis. Since VEGF-A165 acts downstream of bFGF it is not necessary to re-parametrize each model variant with respect to the VEGF-A165 experiments and parameters associated with VEGF-A165-induced angiogenesis can be considered fixed. A comparison between experimental data and numerical results for all four model variants (when bFGF is administered alone) is shown in figure 8. In each case, there is good quantitative agreement between model results and the experimental data (0.058 < RMSE < 0.0615). Indeed, all four model variants are almost indistinguishable when tested using bFGF only.
Table 1.
We formulate four model variants in which two documented mechanisms of crosstalk between VEGF-A165 and bFGF are either included or excluded.
| variant 1 | variant 2 | variant 3 | variant 4 | |
|---|---|---|---|---|
| bFGF-induced VEGF-A165 production | – | + | – | + |
| bFGF-induced VEGFR-2 upregulation | – | – | + | + |
Figure 8.
Comparison of alternative bFGF model results with experimental data. As before, the solid lines show averaged experimental data and the shaded regions show the range in densities across experimental datasets. (Online version in colour.)
With regards to model parametrization, our simulations suggest that the more sustained angiogenic response observed in bFGF experiments may be due to bFGF having a longer half-life than VEGF-A165. That is, bFGF remains stable inside the pellet and cornea for longer than VEGF-A165 and, thus, may elicit an angiogenic response for a longer period of time.
3.3. Sensitivity analysis suggests a fundamental limitation to the reproducibility of cornea micropocket experiments
We have performed a local parameter sensitivity analysis on our model, assessing the effect of changes in individual parameter values on outputs such as the amplitude and location of the vascular wavefront on day 5 of simulations (see the electronic supplementary material for full details). We found that model outputs are most sensitive to those parameters that affect the availability of AFs to the vasculature, e.g. the distance between the pellet and the limbus, the rate at which the AF decays, and parameters regulating AF release from the pellet. Model results are also sensitive to parameters affecting the response of ECs to AF exposure, e.g. the chemotactic sensitivity of sprout tips and the rate at which new tips are produced in the presence of the AFs. The model predicts, in particular, that the neoangiogenic response of the limbal vessels is highly sensitive to the distance between the pellet and the limbal vessels, with our simulation results being almost twice as sensitive to variations in pellet location than to any other parameter. Consider, for example, VEGF-A165-induced angiogenesis simulations when default model parameters are used, where the location of the vascular front on day 5 is located 0.55 mm from the limbus. Varying the location of the pellet by ±10% results in a ±25% change in vascular front location on day 5. By contrast, changes of ±10% in [VT]init result in a ±15% change in the same metric. Thus, our sensitivity analysis suggests that variation in pellet placement may be a large source of noise in experimental results. Regardless of cellular and genetic variability, pellet (mis-)placement may, then, fundamentally limit the precision, and thus the reproducibility and repeatability, of cornea micropocket experiments. More seriously, it may significantly influence conclusions concerning the efficacy of anti-angiogenesis treatments.
3.4. Predicting the angiogenic response of corneal vasculature to VEGF-A165 and bFGF in combination (A4)
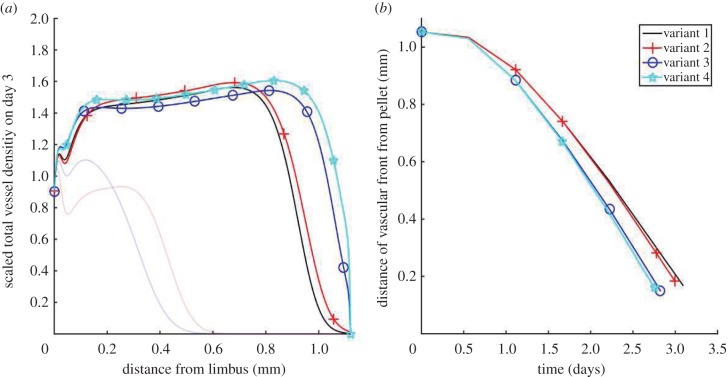
Having parametrized all model variants (table 1) against data derived from experiments recording the angiogenic response to pellets containing VEGF-A165 or bFGF, we now use those variants to predict the angiogenic response when VEGF-A165 and bFGF are combined. Figure 9 shows the non-dimensionalized total vascular density on day 3 of such in silico experiments. We also show how the location of the vascular front evolves, until the vasculature reaches the pellet and our model ceases to be valid. Our results suggest that bFGF-dependent VEGF-A165 production (symbols plus and stars) typically increases vascular density and marginally increases the front migration speed, whereas bFGF-dependent VEGFR-2 upregulation (circles and stars) increases the speed of front migration.
Figure 9.
All four model variants (table 1) are compared when vascular growth is stimulated by VEGF-A165 and bFGF in combination. (a) The angiogenic response on day 3. The angiogenic responses induced by each factor in isolation are also shown (faint lines). (b) The location of the vascular front is plotted over time. (Online version in colour.)
Evidently, even for the simplest model variant (variant 1, table 1), the predicted effects of bFGF and VEGF-A165 on the angiogenic response are nonlinear. In particular, (i) the maximum amplitude of the vascular wavefront is less than would be expected from an additive response and (ii) the extent of neovascularization towards the pellet is greater than would be expected from an additive response. These observations are explained as follows. Vessels are sinks of VEGF-A165 and bFGF. Thus, vascular growth creates a moving barrier to the AFs, preventing them from penetrating parts of the neovasculature closest to the limbus, and inhibiting further vascular growth there. The more dense the vascular network the more pronounced this effect is. Thus, while administering VEGF-A165 and bFGF in combination increases the vascular density, this negative feedback loop limits the additive effect of the two factors on vascular density. The increased vascular density, and thus increased uptake of AFs at the leading edge of the vascular front, also increases the local gradient of AFs to which sprout tips are exposed. Thus, the chemotactic forces experienced by the tips due to VEGF-A165 and bFGF are independently increased when the two factors are co-administered. The effect of crosstalk between VEGF-A165 and bFGF on the neovascular response may be explained in similar terms. For instance, the observation that bFGF-induced upregulation of VEGFR-2 expression increases the rate of tip migration in the presence of VEGF-A165 can be attributed to increased VEGF-A165 uptake by ECs, which increases the local gradient of VEGF-A165, and hence the chemotactic force experienced by sprout tips, at the vascular front.
3.5. Predicting the effect of anti-VEGF-A therapy on bFGF-induced angiogenesis
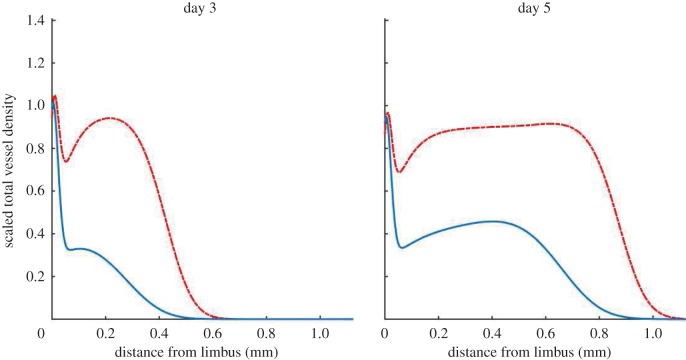
Including VEGF-A–bFGF crosstalk in our model enables us to predict the effect of anti-VEGF-A drugs on bFGF-induced angiogenesis. Figure 10 shows the effect of removing VEGF-A165 production from our full model (variant 4, table 1) when bFGF only is administered (A3). In this figure, the dashed curve represents a control experiment in which bFGF-induced angiogenesis occurs partially via the VEGF-A/VEGFR-2 pathway, while the solid curve corresponds to the expected angiogenic response when an anti-VEGF-A drug is added to the experimental system. This drug may, for example, sequester VEGF-A in the extracellular space or block VEGF-A binding to VEGFR-2. Our results are consistent with experiments in which fewer, thinner vessels with decreased branching points were observed when an anti-VEGF-A monoclonal antibody was administered systemically to mice participating in bFGF-induced corneal angiogenesis experiments [22]. In our model, fewer vessels correspond to a reduced amplitude in the advancing vascular wavefront. Similar reductions in the angiogenic response induced by bFGF are observed for variant 2 (table 1). Naturally, when bFGF-induced VEGF-A production is neglected (variants 1 and 3) the addition of an anti-VEGF-A drug does not affect the bFGF-induced angiogenic response.
Figure 10.
Complete sequestration of VEGF-A165 in the extracellular space diminishes the angiogenic response of the limbal vessels when exposed to bFGF alone. Dashed lines represent the results from in silico experiments in which our full model (variant 4, table 1) was simulated. Solid lines are results from numerical simulations in which VEGF-A165-induced angiogenesis is completely inhibited. (Online version in colour.)
4. Discussion and conclusion
Algorithms designed to segment vessels from images continue to improve. In isolation, thorough and accurate image analysis provides a detailed perspective on what constitutes biologically realistic vascular growth and may also provide insight into the mechanisms of action of anti-angiogenic drugs and the impact of molecular dysregulation on vascular morphology. Moreover, image analysis provides an avenue through which quantitative links can be made between experimental assays and spatially resolved, tissue scale mathematical models of angiogenesis. However, until now such algorithms have not been fully exploited for the purposes of mathematical model development, parametrization and validation. The spatially resolved, quantitative information which we extract from images allows us to better estimate mathematical model parameters. To further illustrate this point, consider the following. If our model were parametrized such that numerical results were consistent with experiments, but only with respect to the extent of neovascularization, the spatial profile of the vascular density could take any shape as long as it extended the correct distance towards the pellet. Figure 11 shows three vessel density profiles generated using our mathematical model, each of which extend the same distance towards the pellet, but which have very different density profiles. Each of these profiles corresponds to a different set of model parameters. Clearly, by using the location of the vascular front only to guide model parametrization, no single parametrization emerges as better than the next. To differentiate between the three parametrizations more information is needed. By estimating the vessel density and showing how it varies in space and evolves over time, our analysis provides a more detailed description of angiogenesis, allowing us to better constrain model parameter values. This, in turn, provides us with greater confidence in what our mathematical model reveals about our experimental system.
Figure 11.
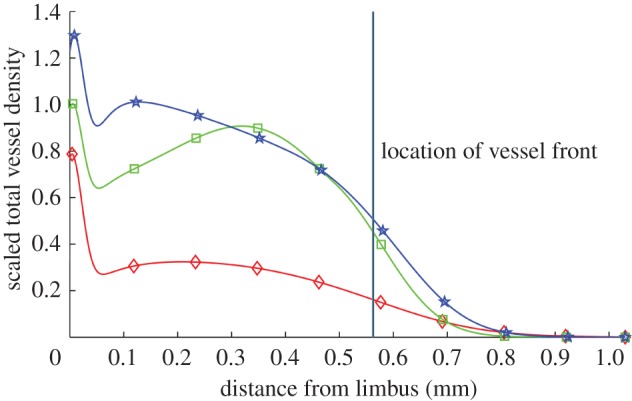
Vessel density profiles generated by our model. The location of the front of each density profile is the same but the profiles are vastly different in shape. The location of the vascular front is defined as the location at which the vascular density becomes half maximal (disregarding the limbus). (Online version in colour.)
In summary, our present study has focused around the development of a proof of principle pipeline, wherein image analysis and mathematical modelling techniques have been integrated into an experimental programme in which angiogenesis is studied in the cornea micropocket assay. The application of image processing techniques facilitated the extraction of quantitative spatio-temporal data from images which are cheaply and routinely captured during experiments. A mathematical model was then developed and parametrized according to these data. The mathematical model extended previous models [10,11] by accounting for vessel maturity and the controlled release of an AF from a pellet. Moreover, we extended these models to describe the response of the corneal vasculature to the co-administration of two of the most potent AFs involved in intra-tumoural angiogenesis, VEGF-A165 and bFGF. Although crosstalk between VEGF-A and bFGF has been hypothesized for a number of years, this is the first time, to the best of our knowledge, that these hypotheses have been formalized within the context of a mathematical model. Furthermore, only one other model of corneal angiogenesis accounts explicitly for the controlled release of an AF from a pellet [13]. While this model provided valuable insight into bFGF-induced angiogenesis in the cornea, it was hybrid and stochastic in nature and thus, given the computational time required to run simulations, was unsuitable for performing parameter sensitivity analyses. By contrast, the simple, deterministic model developed here allows for efficient exploration of parameter space. Like similar existing mathematical models, our model suggests that successful and biologically realistic angiogenesis relies upon striking a delicate balance between the rate of tip production and the response of those tips to gradients in AFs. Moreover, the availability of those AFs to the vasculature, both at and behind the vascular front, clearly plays an important part in the system dynamics. This is consistent with experimental evidence suggesting that the delivery and dosage of VEGF-A, in particular, must be ‘exquisitely regulated in [a] spatial, temporal and quantitative manner to avoid vascular disaster’ [25]. Our sensitivity analysis further suggests that a significant proportion of the variability in experimental results could be due to differences in where the pellet is placed in the cornea, with the extent of neovascularization in simulations varying by up to ±25% with only a ±10% variation in pellet placement. Thus, our sensitivity analysis corroborates what has long been a concern of the experimental community, that accurate pellet placement is critical if one is to obtain reproducible and reliable results using this assay [26]. Indeed, our model outputs are also sensitive to the values of other parameters, in particular those which determine the delivery of AFs to the vasculature, such as the decay rate of VEGF-A165. This may suggest an important avenue of future work. That is, to incorporate a more accurate model of AF transport, which may, for example, take into account the presence of endogenous inhibitors [27]. However, the accurate parametrization of such a detailed transport model is conditional upon the availability of data relating to in vivo concentrations and gradients of AFs. If such data should become available, they would also be useful for more accurately parametrizing other aspects of the model. Then, it still remains to be seen whether such a model, which incorporates more accurate AF transport mechanisms, would produce more accurate predictions than those produced when a simplified transport model is adopted.
We have used our model to investigate documented mechanisms of crosstalk between VEGF-A and bFGF. In our model, bFGF-induced upregulation of VEGFR-2 expression increases the rate of tip migration in the presence of VEGF-A. Meanwhile, VEGF-A production in ECs due to bFGF exposure appears to affect simulation results less markedly, causing small increases in tip cell migration speed and overall vessel density. In addition, our model predicts that strong anti-VEGF-A therapy can cause a reduction in vascular density similar to that seen in experiments performed by Seghezzi et al. [22].
The fact that our model can capture quantitatively the dynamics of vascular growth in different experimental scenarios indicates that it may be capturing the key physical and biological mechanisms underlying angiogenesis in cornea micropocket experiments. However, future work should entail validating the predictions made in this paper by comparing them with appropriate quantitative experimental data. For instance, experiments of bFGF-induced angiogenesis in which strong anti-VEGF-A therapy is administered could be performed. The resulting in vivo angiogenic responses (vascular density profiles) could be quantitatively compared to the results presented in figure 10. Similarly, data from experiments in which angiogenesis is stimulated by VEGF-A165 and bFGF in combination could be compared with the results presented in figure 9. Additionally, spatially resolved data which detail the locations of sprout tips would enable further model validation and allow us further to constrain the model parameters. In the longer term, we envision extending our model to simulate vascular tumour growth, so that we may predict the efficacy of anti-VEGF-A drugs in a tumour micro-environment where vascular remodelling occurs in response to multiple AFs. Such a model may provide insight into FGF resistance to anti-VEGF-A therapies and the potential efficacy of combined anti-FGF and anti-VEGF-A therapies. The work presented here provides a strong foundation for the development of such a model as it allows us to demonstrate consistency of model results with detailed quantitative data emerging from a simple experimental system.
Throughout this paper, we have assumed that the vasculature detected in experimental images is identifiable with that in our model. However, experimental images show only perfused vessels whereas our model implicitly accounts for both perfused and unperfused vessels, i.e. immature vessels could be perfused or unperfused but our model does not differentiate between these two sub-populations. In the biological system, when sprouts first form, they are not perfused. In order to become perfused, a reasonable assumption is that vessels must first anastomose to form a closed loop, allowing blood to flow. Thus, in practice, there is a lag-time between tip cell production, subsequent migration and the emergence of a perfused vessel which is identifiable with vessels in the experimental images. Since we do not model individual vessels, modelling the transition of a vessel from an unperfused to a perfused state in a mechanistic way is particularly challenging. Another avenue of continuing work involves the formulation of a composite hybrid model of corneal angiogenesis which distinguishes between perfused and unperfused vessels in a mechanistic way. We intend to use this hybrid model, in part, to investigate how the relative distributions of perfused and unperfused vessels evolve over time and in response to changes in parameter values. Such a model will enable us to put into context the comparison that we make between experimental images and results from continuum model simulations presented here.
Finally, if we are to move towards a more quantitative understanding of angiogenesis, an integrated approach, such as the one presented here, is essential. In particular, a move towards a more quantitative angiogenesis modelling regime necessitates the emergence of quantitative data which is spatially and temporally resolved, and the insight it can provide. The successful merging of the two complementary fields of image analysis and mathematical modelling in angiogenesis research will allow for improved parametrization of mathematical models of angiogenesis in general. Furthermore, comparing simulation results from mathematical models of angiogenesis to quantitative data, which are spatially and temporally resolved wherever possible, will enable modellers to build the confidence in these models which is needed if they are to gain widespread acceptance within the biological community.
Supplementary Material
Ethics
All experimental study protocols were reviewed and approved by local government. Mice were handled according to committed guidelines (GV-Solas; Felasa; TierschG) and the animal facility has been accredited by AALAAC.
Data accessibility
Images used for model parametrization are hosted on figshare (http://dx.doi.org/10.6084/m9.figshare.1176779). Matlab code for efficient reproduction of the image analysis results and for running model simulations is also available (http://dx.doi.org/10.6084/m9.figshare.1205083).
Authors' contributions
E.L., M.T., F.H. and S.H. conceived of, designed and carried out in vivo experiments. A.J.C. and R.P.N. developed the image analysis tools. A.J.C. performed the image analysis. A.J.C., H.M.B., P.K.M., T.Q., E.S. and J.C. contributed to the development of the mathematical model. A.J.C. implemented and parametrized the mathematical model, carried out in silico experiments and wrote the first draft of the manuscript. All authors agree with manuscript results and conclusions. All authors made critical revisions and approved the final version.
Competing interests
We declare we have no competing interests.
Funding
A.J.C. and R.P.N. acknowledge the financial support of the University of Oxford, the Systems Approaches to Biomedical Sciences Centre for Doctoral Training (SABS-CDT) and the UK Engineering and Physical Sciences Research Council (EPSRC). Contributions by A.J.C. are also supported in part by F. Hoffman La-Roche Ltd. J.C. is supported by the EPSRC (grant no. EP/I017909/1) and Microsoft Research Ltd. E.L., M.T., F.H., S.H., T.Q. and E.S. made contributions to this work while employed by F. Hoffman La-Roche Ltd. The authors confirm that the funders had no influence over the study design, content of the article or selection of this journal.
References
- 1.Augustin HG, Young Koh G, Thurston G, Alitalo K. 2009. Control of vascular morphogenesis and homeostasis through the angiopoietin-Tie system. Nat. Rev. Mol. Cell Biol. 10, 165–177. ( 10.1038/nrm2639) [DOI] [PubMed] [Google Scholar]
- 2.Hegen A, Koidl S, Weindel K, Marmé D, Augustin HG, Fiedler U. 2004. Expression of angiopoietin-2 in endothelial cells is controlled by positive and negative regulatory promoter elements. Arterioscl. Thromb. Vas. 24, 1803–1809. ( 10.1161/01.ATV.0000140819.81839.0e) [DOI] [PubMed] [Google Scholar]
- 3.Jakobsson L, et al. 2010. Endothelial cells dynamically compete for the tip cell position during angiogenic sprouting. Nat. Cell Biol. 12, 943–953. ( 10.1038/ncb2103) [DOI] [PubMed] [Google Scholar]
- 4.Gaengel K, Genove G, Armulik A, Betsholtz C. 2009. Endothelial-mural cell signaling in vascular development and angiogenesis. Arterioscl. Thromb. Vas. 29, 630–638. ( 10.1161/ATVBAHA.107.161521) [DOI] [PubMed] [Google Scholar]
- 5.Rogers MS, Birsner AE, D'Amato RJ. 2007. The mouse cornea micropocket angiogenesis assay. Nat. Protoc. 2, 2545–2550. ( 10.1038/nprot.2007.368) [DOI] [PubMed] [Google Scholar]
- 6.Cao R, Bråkenhielm E, Pawliuk R, Wariaro D, Post MJ, Wahlberg E, Leboulch P, Cao Y. 2003. Angiogenic synergism, vascular stability and improvement of hind-limb ischemia by a combination of PDGF-BB and FGF-2. Nat. Med. 9, 604–613. ( 10.1038/nm848) [DOI] [PubMed] [Google Scholar]
- 7.Thomas M, et al. 2013. A novel angiopoietin-2 selective fully human antibody with potent anti-tumoral and anti-angiogenic efficacy and superior side effect profile compared to pan-angiopoietin-1/-2 inhibitors. PLoS ONE 8, e54923 ( 10.1371/journal.pone.0054923) [DOI] [PMC free article] [PubMed] [Google Scholar]
- 8.Chung AS, Ferrara N. 2011. Developmental and pathological angiogenesis. Annu. Rev. Cell Dev. Biol. 27, 563–584. ( 10.1146/annurev-cellbio-092910-154002) [DOI] [PubMed] [Google Scholar]
- 9.Presta M, Dell'Era P, Mitola S, Moroni E, Ronca R, Rusnati M. 2005. Fibroblast growth factor/fibroblast growth factor receptor system in angiogenesis. Cytokine Growth Factor Rev. 16, 159–178. ( 10.1016/j.cytogfr.2005.01.004) [DOI] [PubMed] [Google Scholar]
- 10.Balding D, McElwain D. 1985. A mathematical model of tumour-induced capillary growth. J. Theor. Biol. 114, 53–73. ( 10.1016/S0022-5193(85)80255-1) [DOI] [PubMed] [Google Scholar]
- 11.Byrne HM, Chaplain MAJ. 1996. Explicit solutions of a simplified model of capillary sprout growth during tumor angiogenesis. Appl. Math. Lett. 9, 69–74. ( 10.1016/0893-9659(95)00105-0) [DOI] [Google Scholar]
- 12.Scianna M, Bell CG, Preziosi L. 2013. A review of mathematical models for the formation of vascular networks. J. Theor. Biol. 333, 174–209. ( 10.1016/j.jtbi.2013.04.037) [DOI] [PubMed] [Google Scholar]
- 13.Tong S, Yuan F. 2008. Dose response of angiogenesis to basic fibroblast growth factor in rat corneal pocket assay: II. Numerical simulations. Microvasc. Res. 75, 16–24. ( 10.1016/j.mvr.2007.09.005) [DOI] [PubMed] [Google Scholar]
- 14.Thackray BD, Nelson AC. 1993. Semi-automatic segmentation of vascular network images using a rotating structuring element (ROSE) with mathematical morphology and dual feature thresholding. IEEE Trans. Med. Imaging 12, 385–392. ( 10.1109/42.241865) [DOI] [PubMed] [Google Scholar]
- 15.Watson MG, McDougall SR, Chaplain MAJ, Devlin AH, Mitchell CA. 2012. Dynamics of angiogenesis during murine retinal development: a coupled in vivo and in silico study. J. R. Soc. Interface 9, 2351–2364. ( 10.1098/rsif.2012.0067) [DOI] [PMC free article] [PubMed] [Google Scholar]
- 16.Al-Rawi M, Qutaishat M, Arrar M. 2007. An improved matched filter for blood vessel detection of digital retinal images. Comput. Biol. Med. 37, 262–267. ( 10.1016/j.compbiomed.2006.03.003) [DOI] [PubMed] [Google Scholar]
- 17.Chanwimaluang T, Fan G. 2003. An efficient blood vessel detection algorithm for retinal images using local entropy thresholding. In Proc. 2003 Int. Symp. on Circuits and Systems, Bangkok, Thailand, 25–28 May 2003, vol. 5, pp. V-21–V24. ( 10.1109/ISCAS.2003.1206162) [DOI] [Google Scholar]
- 18.Zheng X, Koh GY, Jackson T. 2013. A continuous model of angiogenesis: initiation, extension, and maturation of new blood vessels modulated by vascular endothelial growth factor, angiopoietins, platelet-derived growth factor-B, and pericytes. Disc. Cont. Dyn. Syst. B 18, 1109–1154. ( 10.3934/dcdsb.2013.18.1109) [DOI] [Google Scholar]
- 19.Hall A. 2006. Review of the pericyte during angiogenesis and its role in cancer and diabetic retinopathy. Toxicol. Pathol. 34, 763–775. ( 10.1080/01926230600936290) [DOI] [PubMed] [Google Scholar]
- 20.Murakami M, Sakurai T. 2012. Role of fibroblast growth factor signaling in vascular formation and maintenance: orchestrating signaling networks as an integrated system. Wiley Interdisc. Rev. Syst. Biol. Med. 4, 615–629. ( 10.1002/wsbm.1190) [DOI] [PubMed] [Google Scholar]
- 21.Murakami M, Nguyen LT, Hatanaka K, Schachterle W, Chen PY, Zhuang ZW, Black BL, Simons M. 2011. FGF-dependent regulation of VEGF receptor 2 expression in mice. J. Clin. Invest. 121, 2668–2678. ( 10.1172/JCI44762DS1) [DOI] [PMC free article] [PubMed] [Google Scholar]
- 22.Seghezzi G et al. . 1998. Fibroblast growth factor-2 (FGF-2) induces vascular endothelial growth factor (VEGF) expression in the endothelial cells of forming capillaries: an autocrine mechanism contributing to angiogenesis. J. Cell Biol. 141, 1659–1673. ( 10.1083/jcb.141.7.1659) [DOI] [PMC free article] [PubMed] [Google Scholar]
- 23.Papas EB. 2003. The limbal vasculature. Contact Lens Anterior Eye 26, 71–76. ( 10.1016/S1367-0484(02)00054-1) [DOI] [PubMed] [Google Scholar]
- 24.Gerhardt H. 2003. VEGF guides angiogenic sprouting utilizing endothelial tip cell filopodia. J. Cell Biol. 161, 1163–1177. ( 10.1083/jcb.200302047) [DOI] [PMC free article] [PubMed] [Google Scholar]
- 25.Yancopoulos GD, Davis S, Gale NW, Rudge JS, Wiegand SJ, Holash J. 2000. Vascular-specific growth factors and blood vessel formation. Nature 407, 242–248. ( 10.1038/35025215) [DOI] [PubMed] [Google Scholar]
- 26.Fan T-PD, Polverini J. 1997. In vivo models of angiogenesis. In Tumour angiogenesis (eds Bicknell R, Lewis CE, Ferrara N), pp. 5–18. Oxford, UK: Oxford University Press. [Google Scholar]
- 27.Ambati BK, et al. 2006. Corneal avascularity is due to soluble VEGF receptor-1. Nature 443, 993–997. ( 10.1038/nature05249) [DOI] [PMC free article] [PubMed] [Google Scholar]
Associated Data
This section collects any data citations, data availability statements, or supplementary materials included in this article.
Supplementary Materials
Data Availability Statement
Images used for model parametrization are hosted on figshare (http://dx.doi.org/10.6084/m9.figshare.1176779). Matlab code for efficient reproduction of the image analysis results and for running model simulations is also available (http://dx.doi.org/10.6084/m9.figshare.1205083).


