Abstract
Using biological sensors, aquatic animals like fishes are capable of performing impressive behaviours such as super-manoeuvrability, hydrodynamic flow ‘vision’ and object localization with a success unmatched by human-engineered technologies. Inspired by the multiple functionalities of the ubiquitous lateral-line sensors of fishes, we developed flexible and surface-mountable arrays of micro-electromechanical systems (MEMS) artificial hair cell flow sensors. This paper reports the development of the MEMS artificial versions of superficial and canal neuromasts and experimental characterization of their unique flow-sensing roles. Our MEMS flow sensors feature a stereolithographically fabricated polymer hair cell mounted on Pb(Zr0.52Ti0.48)O3 micro-diaphragm with floating bottom electrode. Canal-inspired versions are developed by mounting a polymer canal with pores that guide external flows to the hair cells embedded in the canal. Experimental results conducted employing our MEMS artificial superficial neuromasts (SNs) demonstrated a high sensitivity and very low threshold detection limit of 22 mV/(mm s−1) and 8.2 µm s−1, respectively, for an oscillating dipole stimulus vibrating at 35 Hz. Flexible arrays of such superficial sensors were demonstrated to localize an underwater dipole stimulus. Comparative experimental studies revealed a high-pass filtering nature of the canal encapsulated sensors with a cut-off frequency of 10 Hz and a flat frequency response of artificial SNs. Flexible arrays of self-powered, miniaturized, light-weight, low-cost and robust artificial lateral-line systems could enhance the capabilities of underwater vehicles.
Keywords: biomimetic sensors, underwater sensing, piezoelectric flow sensor, canal neuromast, superficial neuromast
1. Introduction
1.1. Biological hair cell sensors in nature
In nature, there exist numerous and diverse highly sensitive biological sensors, which work on the principles of mechanotransduction, serving various sensing needs in amniota including crickets, amphibians, fishes and humans [1]. For instance, a 570 µm tall hair cell on crickets can detect air velocity of around 0.05 mm s−1 [2]. Hair cells present in the inner ear of the cochlea respond at impressive speed to fluid motions and play a quintessential role in hearing and balance [3]. Tiny hair cell bundles constitute the basic functional elements of all these sensors which translate mechanical stimuli into the electrical signals across the cell membrane [1,4,5]. The lateral-line system in fish and amphibians basically uses arrays of hair cell sensors for flow velocity and flow direction sensing [6,7] and the hair cells in limb joints of insects allow them to detect the orientation of their angled leg joints [8,9]. Despite the rich functionality and diversity in sensing applications, the fundamental sensing principle of all the biological hair cells is similar. Most hair cells consist of long cilia that protrude into the external flow and act as a mechanical connection transducing the flow generated displacements to the neurons connected at the base of the cilia. The physical dimensions of the hair cells are designed to suit the concerned application. The sizes of the biological hair cells may range from as small as 2 µm in height and 0.1 µm in width (in mammalian inner ear hair cells) [10], to as big as 1500 µm in height (in cercal wind-receptor hair cells in crickets) [8] and 500 µm in width (in cupula in fish) [11]. Studies by biologists suggest that the biological hair cell sensors through unique material and structural designs achieve ultrahigh sensitivity, high accuracy, low threshold detection limits and fast response [1]. Hair cell-like sensor design for artificial micro-electromechanical systems (MEMS) flow sensors through biomimetic principles is certainly a very interesting path which provides significant advantages for unmanned underwater vehicles (UUVs). It allows emulation of the structural and functional design principles of the micro- and nano-sensors found in nature. Moreover, micro-fabrication is a mature field that offers the flexibility to deploy various biomimetic polymer materials and novel fabrication methods to realize the complex structural features of the biological sensors. The novel principles derived from the observed function of animals, combined with modern MEMS sensor design techniques enable us to develop sensors with better sensing abilities.
1.2. Mechanosensory lateral-line sensors
The lateral line found on the body of fishes supports important functions, such as prey tracking [12], schooling [13] and vortex sensing [14]. In addition, fishes are known to actively control their kinematics to interact with oncoming externally generated vortices, in order to extract energy from the flow and thereby reduce their locomotory energy expenditure, such as in the Karman gaiting of trout [14].
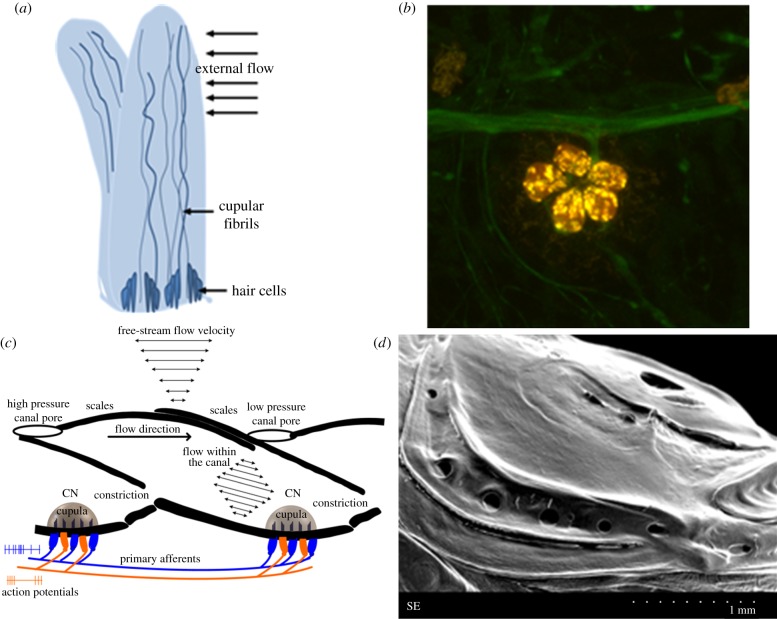
The sensory units of the lateral line called neuromasts are spread over large portions of the fish body [15]. These neuromasts are mainly divided into two types of sub-modalities known as superficial neuromasts (SNs) and canal neuromasts (CNs), each performing a unique function. The SNs are located superficially on the skin and function as velocity sensors by responding to differential movement between the fish body and the surrounding water. The CNs are embedded in sub-dermal channels and exposed to external flow through series of pores on the skin of the fish that lead to the channel [16]. A single neuromast exists embedded within the canal at the centre of two consecutive pores. CNs act as acceleration sensors, i.e. they respond proportional to the acceleration of water outside the canal. Since water flow is produced inside the canal only by pressure differences between the canal pores, CNs are also called pressure-gradient sensors. Aside from the differences in dimensions such as the shape and height of the cupula, the basic neuromast morphology and sensing principle of the CNs and the SNs are similar [17,18]. Each neuromast consists of hair cells embedded within a soft gelatinous cupula [19]. The cupula acts as a mechanical connection between the external flow stimuli and the embedded hair cells and responds to the flow disturbances generated due to the relative motion between the body of the fish and surrounding fluid. The hair cells form the fundamental sensing elements, which act as mechano-electrical transducers by converting the flow induced mechanical bending into electrical potentials that are sent through the innervated afferent fibres to the brain of the fish [1]. CNs perform several unique sensory features that are not observed in SNs. Canals enhance the signal-to-noise ratio of sensing at the neuromast by separating biologically relevant signals from background noises and self-generated noises [20]. CNs are insensitive to the dc-component of the bulk water flow velocity, since these flows do not generate a pressure difference between consecutive pores of the canal and thereby do not elicit a response in the neuromast. The SNs and CNs, through division of labour, perform complete sensing in the frequency range 0–100 Hz without loss of sensitivity in the entire frequency range [20,21]. Figure 1 shows schematic and microscopic images of the biological SNs and CNs of the blind cave fish.
Figure 1.
The mechanosensory SN and CN sensors. (a) A schematic describing the basic anatomy of a SN sensor and its principle of sensing. (b) Confocal laser scanning microscopy image, showing the hair cells of a neuromast stained in red and the lateral-line nerve stained in green. Courtesy Whitney's Laboratory for Marine Bioscience, St Augustine, Florida. (c) A schematic describing the biomechanical noise rejection features of the CN. (d) A scanning electron microscope image of canal pores in blind cave fish. A single neuromast exists embedded within the canal at the centre of the region between the pores. (Online version in colour.)
1.3. Micro-electromechanical systems artificial lateral lines
Given the capabilities of flow sensing that natural hair cells show, considerable attention has been devoted recently towards the development of biomimetic hair cell MEMS sensors [22]. This is a challenging task due to the complex three-dimensional structures of the neuromast sensors, and the demands for highly sensitive yet robust devices. Integration of the three-dimensional structures with the sensing base and organization of sensors into arrays is also a challenge. Although monolithically integrated fabrication of the vertically standing artificial cilia along with the sensing base has been conducted in the past [23], this method is cumbersome in terms of fabrication and might often result in low yield. Moreover, most of the hair cell sensors developed in the past were designed using piezoresistive or metal strain gauge-based sensing principle [7,24–27]. All these sensors require a power supply in order to bias the sensor into a Wheatstone bridge configuration and the voltage output generated due to the flow stimulus is measured. In this work, for the first time, we propose arrays of bioinspired and self-powered MEMS flow sensors that work based on piezoelectric sensing principle and thus do not need a power supply.
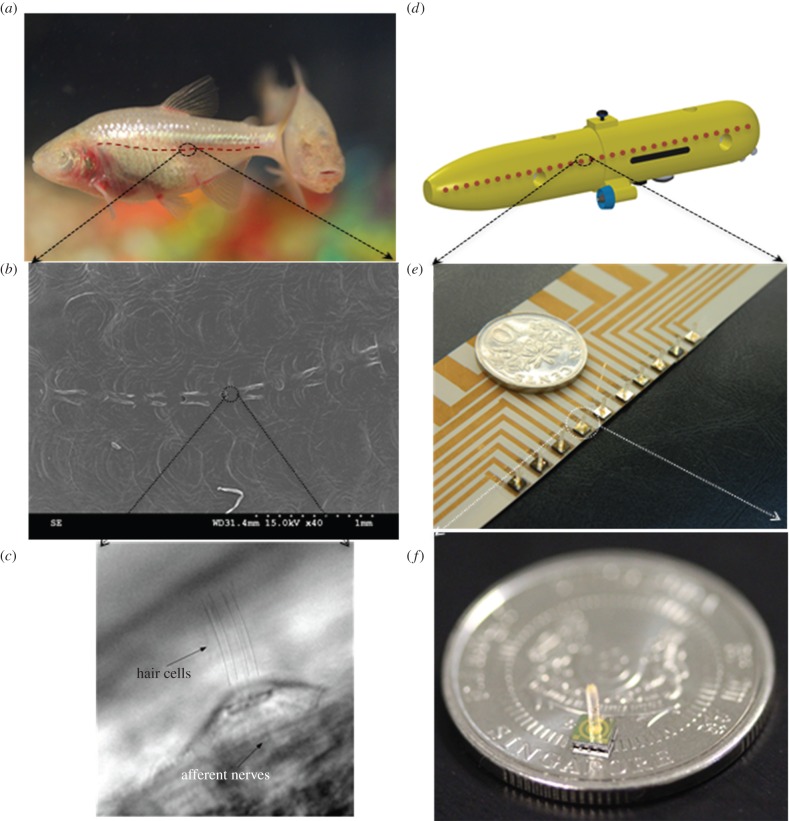
Here we present the design, fabrication and complete characterization of a two-dimensional artificial lateral line formed by novel piezoelectric MEMS hair cell flow sensors. The flow-sensing abilities of the individual piezoelectric flow sensors are thoroughly analysed using a dipole (vibrating sphere) in water. The ability of the two-dimensional array of the piezoelectric hair cell sensors in locating an underwater stimulus is validated through detailed experimental analysis. We also developed a flexible CN-inspired package to reduce the effect of steady and low-frequency flows on the sensor. Figure 2 depicts the translation of the functionality of the lateral lines in fish to the artificial lateral lines on UUVs. Availability of artificial sensors that emulate the lateral lines of fish could bring a significant enhancement in the control and manoeuvring abilities of UUVs.
Figure 2.
Bioinspired MEMS flow sensors. (a) A photograph of the blind cavefish showing the approximate location of the lateral line of neuromast sensors. (b) Scanning electron microscope image of the lateral line showing the CN sensors on the fish. A single neuromast exists embedded between successive tiny pores seen on the lateral line. (c) An individual neuromast sensor as seen through a direct interference contrast microscope. (d) A representative schematic of an UUV showing the line of location of the sensors for near-field underwater sensing. (e) A flexible array of MEMS piezoelectric self-powered flow sensors on LCP substrate, fabricated in this work. (f) The size of an individual MEMS flow sensor as compared to a Singapore 10 cents coin. (Online version in colour.)
2. Artificial hair cell sensor development
2.1. Sensor structure and sensing principle
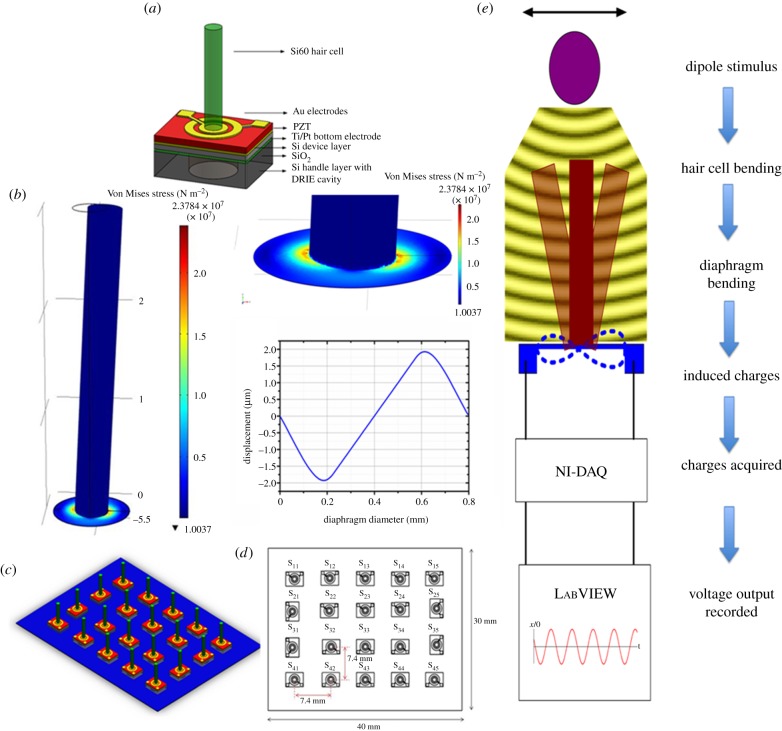
The piezoelectric MEMS hair cell sensors developed in this work consist of three major parts: piezoelectric Pb(Zr0.52Ti0.48)O3 (lead zirconium titanate or PZT) sensing membrane, high-aspect-ratio artificial hair cell located at the centre of the PZT membrane, and canal-inspired package for noise rejection. The device structure is schematically diagrammed in figure 3a. Each sensor contains a sensing membrane of diameter 800 µm and measures a footprint of 1.4 × 1.4 mm. The sensing membrane consists of a 3 µm thick PZT layer with Pt bottom electrode and gold top electrode contacting the PZT diaphragm on both the sides. A micro-stereolithographic assembly (µ-SLA) process is employed to fabricate high-aspect-ratio cylindrical pillars. Movement of underwater objects generates disturbances that cause a pressure gradient across the hair cell present in their vicinity. The bending moment in the hair cell is transferred to the piezoelectric membrane attached to the hair cell. The stress due to bending generates electric charge that is collected through the contact pads. A schematic of the sensor structure is shown in figure 3a. A representative schematic of the working mechanism of the artificial hair cell sensor is described in figure 3b. The stress and displacement profile of the PZT membrane, for a pressure of 10 Pa exerted on a quarter of the perimeter of the hair cell, is simulated through three-dimensional finite-element analysis.
Figure 3.
Sensor structure and design. (a) A schematic illustrating the structure of the sensor, the design of the circular and ring electrode and various materials employed in sensor fabrication. (b) Finite-element analysis of bending the hair cell that induces deformation on the PZT diaphragm when the sensor faces a pressure of 10 Pa on a quarter of the perimeter of the hair cell. Insets show a zoom-in view of the diaphragm and the displacement profile along the diameter of the diaphragm. (c) Schematic of the array of 4 × 5 of the proposed sensors. (d) Various dimensions of the proposed array and sensor locations. (e) Schematic of the working principle of the sensor and data acquisition process.
We developed flexible one- and two-dimensional arrays of PZT hair cell sensors that are surface-mountable on the streamlined bodies of UUVs. Flexible arrays are formed by mounting the sensors on liquid crystal polymer (LCP) substrate which is patterned with metal interconnects. The first array consists of 10 sensors arranged in a single row with a sensor-to-sensor spacing of 5 mm. The second array consists of a two-dimensional arrangement of 20 sensors in a 4 × 5 pattern with a total array footprint of 30 × 40 mm. Schematics of the organization of the sensors in the array showing various dimensions involved in the array design are depicted in figure 3c,d. Figure 3e illustrates the working principle of the sensor and data acquisition process. Acquiring and analysing the outputs of all the sensors in the array (that depict the flow field generated by a stimulus projected along the sensor array) can provide valuable information about identifying the position, velocity and the shape of an underwater object.
We used the dipole to characterize our artificial lateral line since the theory of dipole flow fields has been well studied in the past [21,28], which allows us to conduct theoretical studies to verify our experimental results. In addition, a dipole-generated flow field closely represents those generated by freely swimming fish which form the stimulus for biological lateral lines in fishes [22]. When the dipole vibrates in water, it displaces the surrounding water and the water moves around the dipole into the region that has just vacated. For simplicity, we neglected the water displacements that occur due to gravity, temperature differences and rotational motion but only considered the flow generated due to the movement of the dipole.
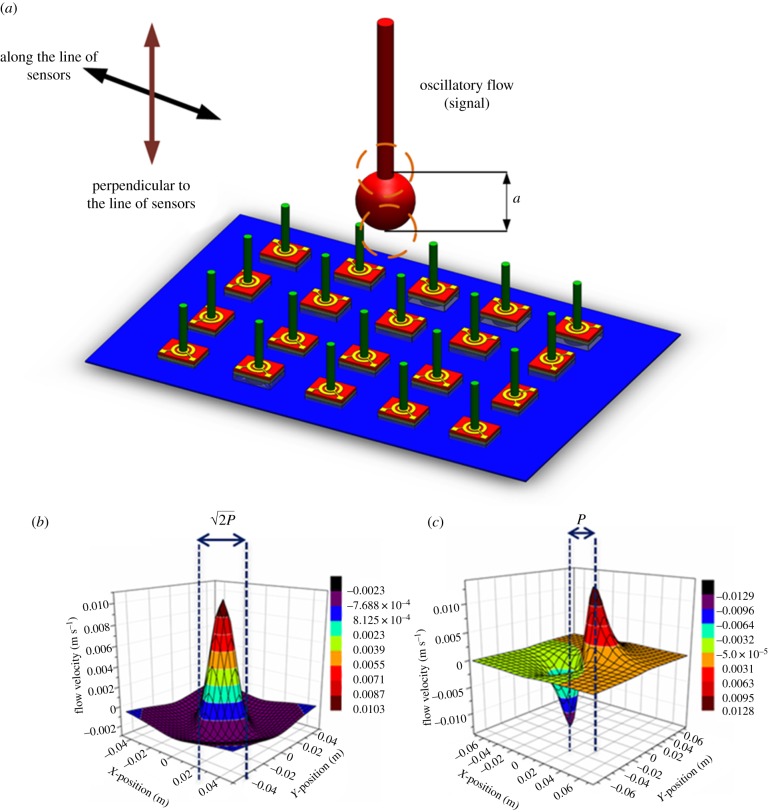
We calculated the flow velocities at various points along the plane of artificial lateral line of sensors (represented in figure 4a) for two cases of dipole vibrating in the plane parallel to the array of sensors and in the plane perpendicular to the plane of sensors. According to the dipole model developed in [29–31], the dipole parallel to the array of the sensors generates a flow velocity along the line of sensors as described by
 |
2.1 |
When the dipole vibrates perpendicular to the array of sensors it generates a flow velocity along the line of sensors as described by
| 2.2 |
Figure 4.
Object detection principles. (a) A simplified schematic of experimental set-up used for dipole localization. Analytical models of the flow velocity distribution for cases when the dipole vibrates (b) parallel and (c) perpendicular to the plane of the sensor array. Constant parameters used in plotting the analytical data were kept the same as those in experiments presented to keep a close comparison. A dipole of diameter A = 8 mm oscillating at an observation distance P = 25 mm, at a frequency f = 35 Hz and a displacement amplitude a = 1 mm were used to obtain the analytical plots.
In equations (2.1) and (2.2), A is diameter of the dipole, f is frequency of oscillation, a is displacement amplitude, P is observation distance (distance between dipole source and sensor membrane), ω is the angular frequency and μ(t) = 2πωaA3.
Figure 4b,c describes the analytically calculated velocity distributions for cases that the dipole is vibrating parallel and perpendicular to the x-axis. In the case of parallel oscillation, the water velocity is an even function and the distance between zeros is  , while in the case of perpendicular oscillation condition, the water velocity is an odd function and the distance between maximum and minimum is P [15]. The analysis presented in this section is beneficial to design experiments so as to obtain sufficient information with an array of sensors to be able to determine the location, pressure difference amplitude, distance and direction of movement of the oscillatory flow source.
2.2. Sensor design
The design of the electrodes on the PZT membrane for charge collection and the hair cell design have been optimized in order to achieve higher sensitivity and lower threshold detection limits. In designing the piezoelectric sensors, we developed a bottom floating electrode design which consists of a top electrode with circular and ring patterns and a floating bottom electrode [32,33]. In this design, two separate electrodes collect the stress polarities in the central region and the peripheral region of the diaphragm. The floating bottom electrode is not patterned and extends completely under the PZT layer. When working in a sensor mode, in the case of the conventional sensor design with no floating electrode, the voltage integral path is constrained in the gaps between the ring and the circular electrodes and therefore the voltage is much smaller. In the proposed floating electrode design, the voltage integral path goes first from the central electrode to the bottom electrode, and then to the top ring electrode. In this way the entire area under the top ring electrode is used. In addition, the high strain gradient that occurs at the circumference of the pillar causes an enhanced voltage generation due to piezoelectric effect.
2.3. Artificial lateral-line fabrication
Individual piezoelectric artificial hair cell sensors are fabricated through a unique combination of MEMS micromachining process and sol–gel method for the growth of the thin-film Pb(Zr0.52 Ti0.48)O3, described in [32,34]. In order to simplify the fabrication process, the hair cells are fabricated separately and then mounted at the centre of the PZT diaphragms. The individual sensors are then packaged into flexible arrays. The fabrication of the piezoelectric sensing base commences with the deposition of thin Ti/Pt (30/300 nm) layer that forms the floating bottom electrode by sputter coating on the device layer of a 4-inch silicon on insulator (SOI) wafer with orientation  . After which a 3 µm thick PZT layer is spin-coated on the Pt electrode by employing sol–gel method. In the third step, the top electrode is formed by sputter-coating Au/Cr(150/20 nm) layer on top of the PZT layer. The top electrode is then patterned to form the circular and ring electrodes by lift-off process. A cavity that is aligned with the circular electrode on the top-side is etched into the handle layer of the SOI wafer by deep reactive ion etching (DRIE) process to form the sensing membrane. The DRIE process also defines the dicing lines between the sensors and the individual sensors can be separated from the wafer.
High-aspect-ratio hair cells, 2700 µm tall and 350 µm in diameter are fabricated by the µ-SLA process. Fabrication of high-aspect-ratio structures with SU-8 photoresist is well established in the past [35,36]; however, the process requires various optimization steps to achieve tall, high-aspect-ratio structures. In addition, other fabrication complexities are involved with the process that could reduce the surface flatness of the high-aspect-ratio SU-8 structures such as unintentional tilt in the baking process, dirt particles and curvature of the substrate or mask. Unlike SU-8 processing that has been mainly used for hair cell fabrication in the past [22], µ-SLA is a less cumbersome process that can form high-aspect-ratio pillars. µ-SLA is micro-manufacturing process that allows building of three-dimensional microstructures directly from the model created by computer-aided design softwares [37]. Ιt develops micro components by solidifying liquid monomer in a layer-by-layer fashion. The micro-pillar hair cells in this work are fabricated on a SLA VIPER machine from Si60 polycarbonate polymer material. The high-aspect microstructures are formed by scanning a 355 nm UV beam of spot size 0.01 mm on the liquid monomer Si60. Independent nanoindentation experiments to characterize the material properties of the hair cell revealed a Young's modulus of 2.5–3 GPa.
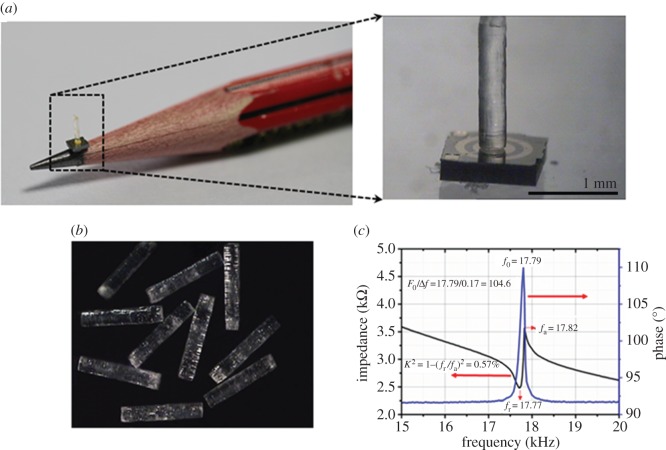
The hair cells are then carefully mounted at the centre of the PZT sensing base by using a precise X–Y–Z position controller. Firstly, a micro-drop of EPO-TEK-H70E non-conducting epoxy is drop-cast at the centre of the PZT diaphragm by using a micro-pipette attached to a precise X–Y–Z position controller. The pillar is held with micro-tip tweezers and positioned on top of the epoxy dot on the PZT membrane. The positioning is carefully adjusted by observing through a high-speed camera that monitors the movement of the micro-tip that holds the hair cell. The device is then heat-treated for 12 h at 55°C to allow the epoxy to cure and make a strong bond between the hair cell and the membrane. Figure 5a,b shows the optical images of the MEMS hair cell sensor. The individual sensors are poled by applying a DC voltage of 30 V for 20 min between the electrodes. Poling treatment is required to align the ferroelectric domains of the PZT composite. Before testing, individual sensors are characterized by using an Agilent 4294A precision impedance analyser. An example of impedance and phase response of the proposed sensor in air is shown in figure 5c. The sensor shows a resonant frequency of 17.7 kHz and a high Q-value of 104.6 as calculated by fitting the Lorentz function with a phase response. The resonant frequency and the quality factor might vary slightly from sensor to sensor even though they are fabricated in the same batch. This is due to the slight non-uniformity of the layers deposited during the sensor fabrication, and non-uniformity of the DRIE cavity that leads to membranes of slightly varying thickness. The difference in residual stress generated between the deposited layers in the sensing membrane might also lead to changes in the sensitivity of the sensor. It was ensured that all the sensors chosen for the array showed close resonant frequency and quality factor.
Figure 5.
Optical images of (a) the size of the sensor as compared to the nib of a pencil and individual sensor after fabrication showing the electrode design and the vertically standing hair cell. (b) High-aspect hair cells fabricated by SLA. (c) Impedance and phase spectra of the sensor. (Online version in colour.)
In order to conduct object detection experiments, it is necessary to employ arrays of sensors that are capable of determining the local flow velocity. Flexibility of the array is required to enable mounting the array on the surface of streamlined UUVs for use in real time. Electrical connections are formed on a 100 µm thick LCP 3908 film by gold deposition and lift-off processes. These electrical connections enable easy wiring by extending the small-sized sensor contact pads to larger workable sizes. Photographs of the flexible sensor arrays (one-dimensional and two-dimensional) developed on LCP substrate are shown in figure 6.
Figure 6.
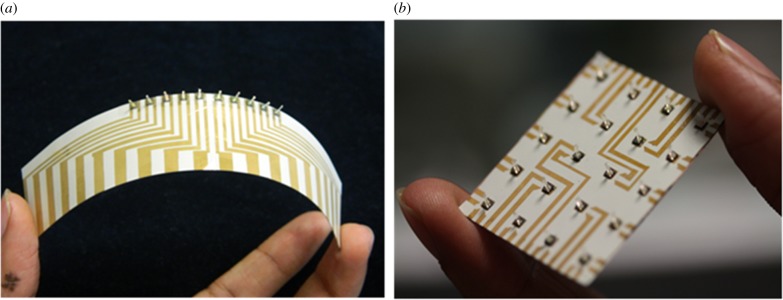
Photographs of the flexible arrays of fabricated hair cells. (a) One-dimensional array with a footprint of 65 × 40 mm. (b) Two-dimensional array with a footprint of 30 × 30 mm. (Online version in colour.)
3. Experimental set-up
In all the experiments presented, a dipole is used to perform hydrodynamic characterization of the arrays under biologically relevant scenarios [15]. A dipole of diameter of 8 mm is set to vibrate using a permanent magnet mini-shaker (model 4810, B&K, Norcross, GA, USA). The dipole is connected to the membrane of the mini-shaker by a stainless steel rod 120 mm long and 2 mm in diameter. The dipole can be driven at a desired amplitude and frequency controlled by a function generator connected to the mini-shaker. The signal from the function generator is amplified by a specified gain through a power amplifier (type 2718, B&K). The mini-shaker is inverted and mounted on top of a water tank of dimensions 1 m (L) × 0.6 m (W) × 0.4 m (H) so that the dipole is immersed 120 mm deep into water. In all the experiments, the output from the sensors is amplified 500 times using a SRS560 low-noise pre-amplifier. The output from the sensor is acquired using National Instruments data acquisition card (NI-DAQ) at a rate of 2 kHz and recorded in LabVIEW without filtration.
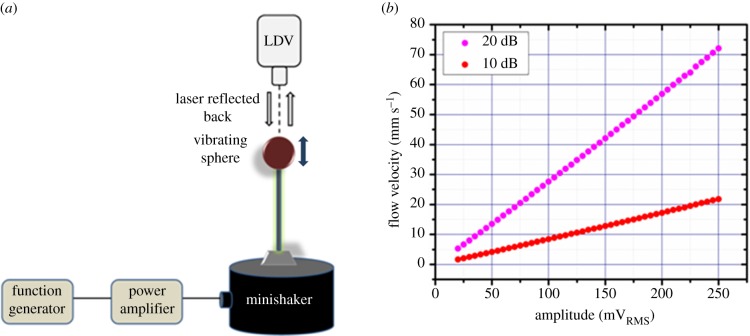
In general, the frequency range of relevance for underwater sensing applications is known to be from steady-state flows (0 Hz) to oscillatory flows of about 35 Hz [21]. Before testing the response of the hair cell sensors, the dipole source was characterized to determine the velocities generated by its vibration when driven at various amplitudes and frequencies. A PSV300 model laser Doppler vibrometer (LDV) is used to determine the displacement amplitude and velocity of the dipole for various driving amplitudes at 35 Hz. A schematic of the test apparatus and set-up is shown in figure 7a. Figure 7b shows the velocity of vibration of the dipole as a function of voltage amplitude of the sinusoidal stimulus supplied to the dipole. The experiment is repeated at gains of both 10 and 20 dB of the power amplifier. At a constant frequency, the flow velocity of the dipole increases linearly with increasing amplitude of vibration of the dipole.
Figure 7.
LDV characterization of the dipole. (a) A schematic that describes the LDV experimental set-up. (b) Velocity generated by the vibration of the dipole as a function of driving amplitude at a constant frequency of 35 Hz. (Online version in colour.)
Three major experiments are presented in this paper, which prove three different abilities of the proposed neuromast sensors. First, the flow velocity sensing experiments conducted using single SN sensors demonstrate the sensitivity and threshold detection limits of the sensors in sensing air and water flows. Second, the object localization experiments conducted using two- and one-dimensional arrays of hair cell sensors demonstrate the performance of the array of artificial SNs in locating an underwater stimulus source. Third, the frequency response experiments conducted using the artificial SNs and CNs which demonstrate high-pass filtering abilities of the CN and also flat frequency response for SN sensors.
4. Flow velocity sensing
The response of the hair cell sensor to various flow velocities generated by the oscillating dipole is measured to determine the sensitivity and the threshold detection limit of the sensor. The displacement amplitudes of the dipole are inferred from LDV results and the flow velocity is obtained at any observation distance from equation (2.1). Figure 8a,b shows the experimental results of flow sensing in air and water, respectively. As seen in figure 8 at each flow velocity, the sensor's output voltage is much higher for water flow as compared to air flow due to the difference in density of the two media by a factor of about 1000. In figure 8b, it can be observed that the increase in sensor output is very gradual for water flow velocities up to 20 mm s−1, corresponding to a Reynolds number (Re) of 50, beyond which the rate of increase of the sensor output is much higher. This is because for flow velocities (U) below Re ≈ 50, drag force (FD) generated due to skin friction on the standing pillar is the major contributor to the sensor output, which increases linearly with increasing flow velocity. However, at higher velocities, the pressure gradient dominates in the overall contribution to the sensor output [24]. Such a transition is not seen in the case of air flow sensing since the Re for the entire range of experimentally tested velocities is below 50 and skin friction stands as the sole contributor to sensor output. The hair cell sensors demonstrate a threshold sensing limit of 2.5 mm s−1 and 8.2 µm s−1 in air and in water flow velocities, respectively. The threshold detection limit is defined as that flow velocity below which the peak frequency in the fast Fourier transform of the dipole response could not be observed due the background noise. The sensors demonstrate a sensitivity of 0.82 mV/(mm s−1) and 22 mV/(mm s−1) in sensing air and water flow velocities, respectively. Threshold detected from oscillatory flow signals for fish varies between species from 18 to 36 µm s−1 for the frequency range of 10–20 Hz [38,39]. The threshold detection limits achieved by the proposed piezoelectric flow sensors are higher than those of the artificial flow sensors developed in the past [40–42].
Figure 8.
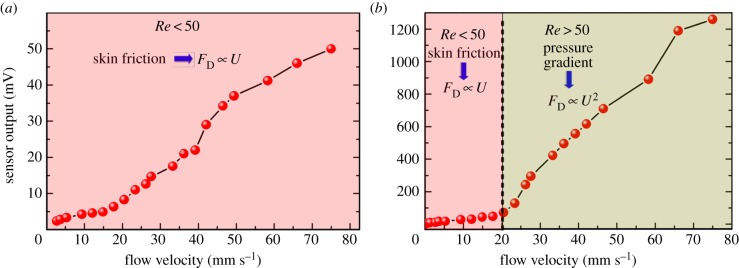
Experimental results demonstrating sensors output as a function of flow velocity in sensing oscillatory flows generated by the dipole stimulus in (a) air and (b) water. (Online version in colour.)
5. Object detection experiments
Inspired by the hydrodynamic sensing in fishes [21], in this section we demonstrate through experimental validations that arrays of artificial sensors with the ability to measure spatially distributed flow patterns can recreate the distance and exact location of a moving source. The information of the distance and location can be encoded from the signal acquired from the arrays of sensors. Three separate experiments are conducted to determine the location of the dipole, the observation distance of the dipole and change in dipole position in parallel to the sensor plane. Before conducting object localization experiments, the velocity sensitivities of each sensor of the array were characterized by using the dipole vibrating at various velocity amplitudes in quiescent water. This step ensures that there is no calibration required to reject errors that could happen due to sensitivity mismatch between sensors. When the dipole is located in the vicinity of the two-dimensional array of sensors, the flow velocity generated due to the vibration of the dipole is higher at the sensors which are closer to the dipole. Due to increased distance from the dipole, the sensors farther from the centre of the array see a lower velocity. Peak to peak of the voltage outputs from all the sensors of the array are obtained as a response to the dipole vibration. A ‘Mexican hat’ profile is fitted through the experimental data acquired from all the sensors of the two-dimensional array. As predicted by the theoretical analysis presented in §2.1 (figure 4), and as verified by the neuro-physiological studies conducted on lateral line of fish in the past [19,43], the spatial response of the sensor array resembles a ‘Mexican hat’ profile. Results presented in figure 9 show that the magnitude of voltage output is highest at the projected centre location of the dipole and it gradually decreases with increasing distance from the centre. In the experimental case, the peak is observed at (x, y) = (0, 0) since the dipole is located right at the centre of the array which is considered as the origin.
Figure 9.
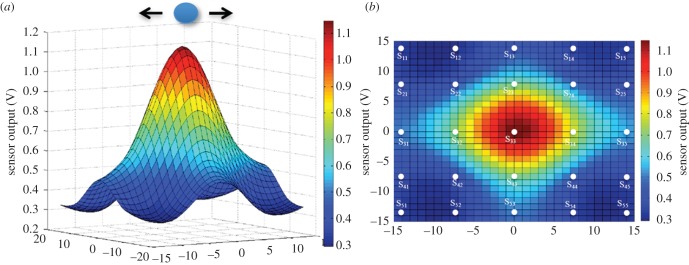
Results of object localization employing a two-dimensional array of 20 sensors. (a) A Gaussian fit drawn through the sensor outputs as a function of the location of the sensors with respect to the dipole stimulus. (b) Top-view of the Gaussian profile showing relative locations of the sensors in space.
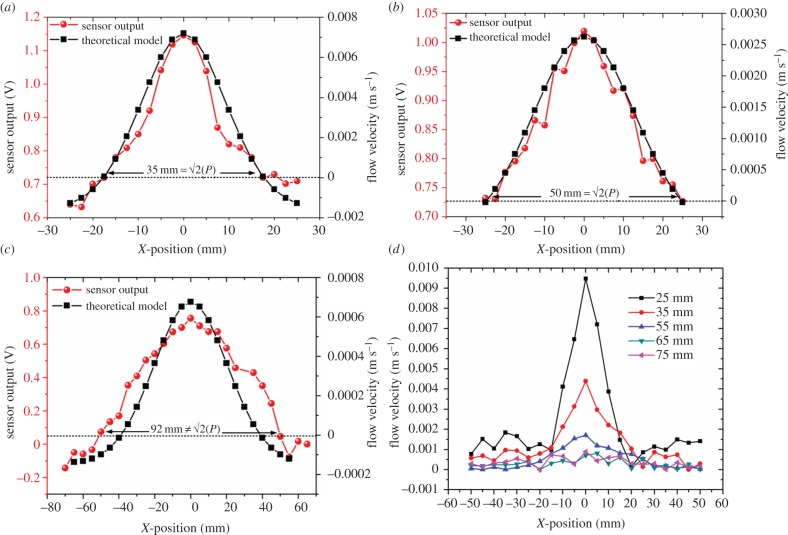
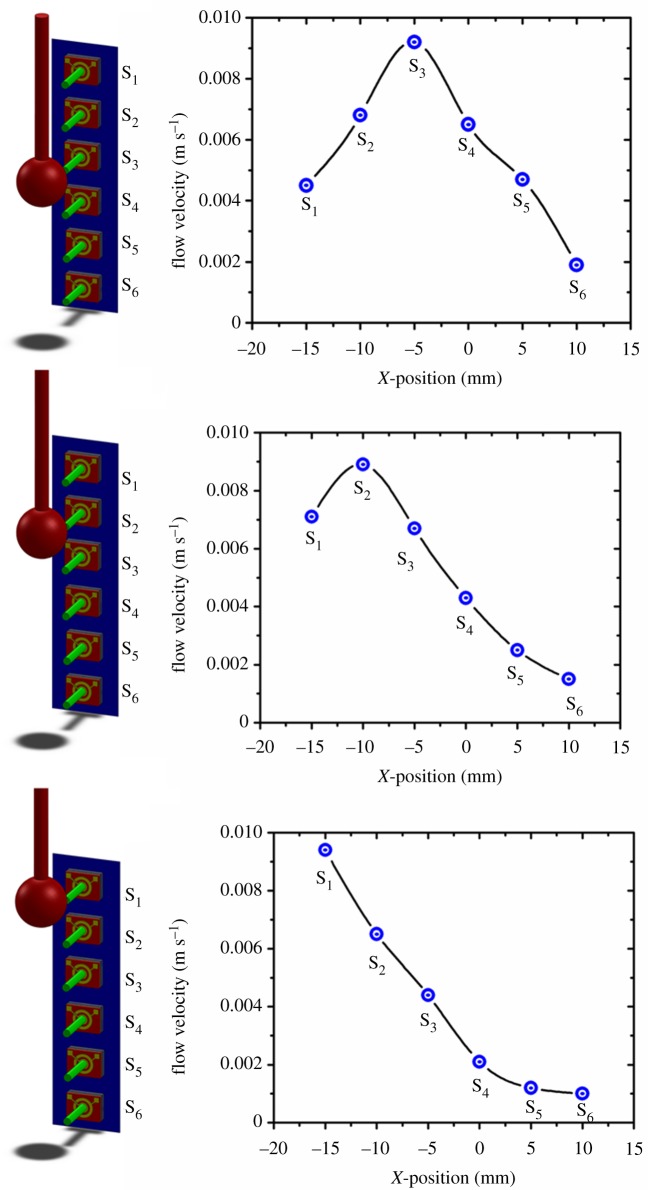
One-dimensional array of sensors is used to demonstrate the array's ability to determine the distance of the stimulus from the array. We conducted this experiment at various observation distances and experiments were repeated for five different arrays of sensors to verify the reproducibility of the results. We used the one-dimensional array in order to reduce the number of data recordings. Although the array only has 10 sensors, we obtained 20 measurement points by shifting the array by 2.5 mm (half the sensor-to-sensor spacing) while keeping the dipole location the same and re-conducting the experiment. The dipole is located at the centre of the array which is represented as the origin. Results presented in figure 10a,b demonstrate that the array of sensors is able to estimate the observation distance P. The parameters in equation (2.1) are f = 35 Hz, a = 1 mm, A = 8 mm and amplitude of 250 mVRMS. Employing theoretical predictions described in §2.1, and output of the artificial lateral line, the actual distances of P = 25 and 35 mm as 24.75 and 35.35 mm (error 1%). In addition, in an attempt to evaluate the maximum observation distance that the array can still localize the dipole source, we performed a similar experiment for various observation distances ranging from 25 to 75 mm. As shown in figure 10c, by increasing the observation distance the accuracy of object localization by the array decreases due to flow damping. The localization error for the observation distance of 55 mm increased to 28%. Figure 10d shows the flow velocities obtained from array of sensors at various observation distances. An additional experiment, by moving the dipole parallel to the sensor array is conducted to determine the response of the array to moving stimulus source. The position of the dipole is shifted parallel to the array as the outputs from sensors are acquired, simultaneously. As can be seen in figure 11, the peak output of the array which corresponds to the location of the dipole shifts along with the current location of the dipole.
Figure 10.
Characterization of dipolar flow fields using artificial lateral-line sensors. The responses from 20 sensors (in red) to a dipole stimulus vibrating at x = 0 and theoretical predictions of flow velocities at various points along the array (in blue) are plotted for array to sensor distances of (a) 25, (b) 35 and (c) 55 mm. (d) Flow velocity as a function position of sensors for various observation distances. (Online version in colour.)
Figure 11.
Experimental results showing the response of the array of sensors to dipole stimulus whose position is shifted parallel to the array. (Online version in colour.)
6. Frequency response of the artificial canal and superficial neuromasts
When artificial SNs are employed in real-time underwater sensing situations, in addition to the stimulus-generated forces, low-frequency disturbances, such as the flow generated by the vehicle's own motion as well as external disturbances such as tidal streams and waves, provide high-amplitude noise in the sensor measurements. In order to overcome these problems, we developed a biomimetic canal packaging that encapsulates the hair cell sensors and functions similar to the CNs of fishes. The developed artificial CNs not only protect the hair cells from the high pressure of steady or low-frequency flows but also function as tuneable filters to avoid low-frequency flows. Figure 12a shows a schematic of the arrangement of the array of hair cells within the canal structure. Although, in reality, canals have complex geometries [17], to simplify the design and experimental analysis of flow filtering features, we considered CNs with straight-walled semi-circular tubes. Various important parameters involved in the artificial CN structure design are canal dimensions, distance between the pores and diameter of the pores [17]. The fabrication process of the artificial CNs used in this work has been elaborated in our previous work [44]. Figure 12a shows the optical image of the cross section represented by AA plane in the schematic in figure 12b. The canal pores and the embedded hair cells and the locations of the pores are shown in figure 12b.
Figure 12.
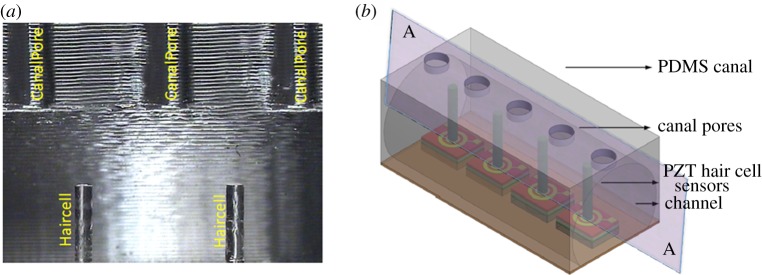
Biomimetic artificial CN sensors. (a) A cross-sectional optical microscopic view of the canal. The canal is mounted in such a way that each hair cell is positioned at the centre of two consecutive pores which lead external flows into the canal. (b) Schematic array of sensors showing the dicing plane along which the microscopic image in (a) is taken. (Online version in colour.)
We conducted a comparative experimental study of the frequency response of the artificial SNs and CNs using the dipole source which is positioned at an observation distance of 25 and 120 mm deep into water. The artificial superficial and canal sensors are simultaneously exposed to the dipole-generated oscillatory flows at varying frequencies. In general, the flow velocity generated by the dipole source depends on frequency and amplitude of the vibration. Therefore, amplitude must be modulated in order to maintain the flow velocity at a constant magnitude while increasing the frequency of vibration. The combinations of amplitudes and frequencies to maintain a constant flow velocity of 70 mm s−1 were determined through LDV experiments. As the frequency of the dipole is swept from 1 to 100 Hz, the outputs of both the SN and CN sensors are acquired simultaneously. Figure 13 shows the frequency response plots of the artificial superficial and canal sensors. The results for the artificial SN sensor show that the sensor's response is independent of the frequency. In the case of the CN sensor, pressure difference between the canal pores drives the fluid in the canal, which is opposed by the friction generated due to the walls of the semi-circular canal. At low frequencies, the frictional forces dominate the response and thereby result in lower activation of the hair cell. In addition, at low frequencies, the displacement of water particles outside the canal is larger than that inside the canal resulting in the high-pass filtering nature seen in figure 13. Experimental results in figure 13 demonstrate that the CNs eliminate steady-state flows and substantially filter oscillatory flows below a frequency of 10 Hz. The attenuation of low frequencies clearly illustrates how the canal mechanics play a crucial role in the success of operation of these sensors in the presence of low-frequency noises.
Figure 13.
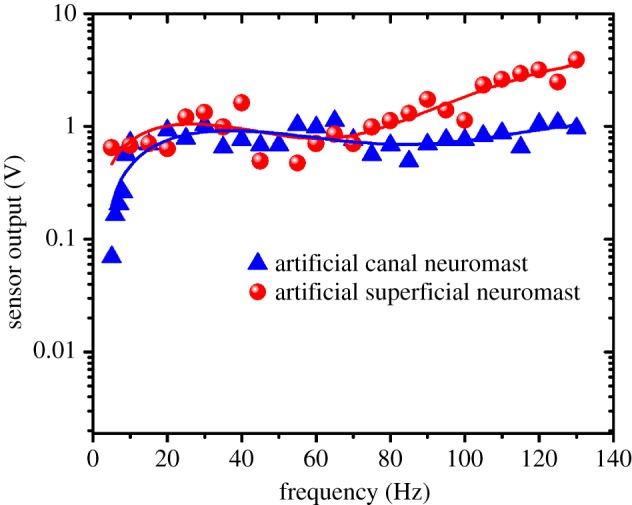
Frequency responses of the artificial SN and CN demonstrating high-pass filtering nature of the CN and a flat frequency response for the SN. (Online version in colour.)
7. Conclusion and outlook
Translating the sensory abilities of the ubiquitous lateral-line mechanosensory system to an artificial sensor platform brings substantial improvement in the sensing capabilities of UUVs for improved navigation and control. In an effort to develop such an artificial lateral-line sensing system, we fabricated flexible and surface-mountable two-dimensional arrays of self-powered, light-weight, ultrasensitive and reliable piezoelectric MEMS flow sensors. These flow sensors consist of high-aspect-ratio hair cells fabricated by stereolithography that are mounted at the centre of micro-diaphragm PZT sensors. Individual PZT flow sensors are characterized for flow velocity sensing by employing a dipole stimulus. The sensors demonstrated ultrahigh flow sensitivities of 0.8 mV/(mm s−1) and 22 mV/(mm s−1) at 35 Hz in sensing air and water flows, respectively, with threshold velocity detection limits as low as 2.5 mm s−1 and 8.2 µm s−1 in air and water flows, respectively. In order to evaluate the object detection abilities of the array, we conducted three major experiments, wherein the arrays were employed to determine the location and distance of the object. We also developed artificial CNs that could substantially filter oscillatory flows below 10 Hz. Artificial hair cell arrays such as the ones presented in this work will assist UUV engineers to enhance the situational awareness of UUVs and biologists to understand the locomotory and detection mechanisms in fishes.
Supplementary Material
Authors' contributions
M.A. designed the MEMS sensors, conducted the sensor fabrication, packaged the array of sensors, performed object detection experiments, analysed the results and drafted the article. A.G.P.K. performed the flow-sensing experiments, analysed the results, conducted calibration experiments, prepared the figures and wrote several sections of the manuscript. M.E.W. helped with performing experiments, analysis and interpretation of data. J.M. and M.S.T. conceived and supervised the project. All the authors contributed to the discussion of results and critical reading of the manuscript.
Competing interests
We declare we have no competing interests.
Funding
This research was funded by the Singapore National Research Foundation (NRF) through the Singapore-MIT Alliance for Research and Technology (SMART) Center, Center for Environmental Sensing and Modeling (CENSAM) IRG. This work was also funded by the 8th Innovation grant cycle ING148079-ENG from the SMART Innovation Center Singapore.
References
- 1.Jaalouk DE, Lammerding J. 2009. Mechanotransduction gone awry. Nat. Rev. Mol. Cell Biol. 10, 63–73. ( 10.1038/nrm2597) [DOI] [PMC free article] [PubMed] [Google Scholar]
- 2.Shimozawa T, Murakami J, Kumagai T. 2003. Cricket wind receptors: thermal noise for the highest sensitivity known. In sensors and sensing in biology and engineering (eds Barth FG, Humphrey JAC, Secomb TW), pp. 145–157. New York, NY: Springer. [Google Scholar]
- 3.Fettiplace R, Hackney CM. 2006. The sensory and motor roles of auditory hair cells. Nat. Rev. Neurosci. 7, 19–29. ( 10.1038/nrn1828) [DOI] [PubMed] [Google Scholar]
- 4.Coombs S, Van Netten SM. 2006. The hydrodynamics and structural mechanics of the lateral line system. In Fish biomechanics (eds Shadwick R, Lauder G), pp. 103–139. New York, NY: Elsevier. [Google Scholar]
- 5.Van Netten SM, Dinklo T, Marcotti W, Kros CJ. 2003. Channel gating forces govern accuracy of mechano-electrical transduction in hair cells. Proc. Natl Acad. Sci. USA 100, 15 510–15 515. ( 10.1073/pnas.2632626100) [DOI] [PMC free article] [PubMed] [Google Scholar]
- 6.Chambers LD, Akanyeti O, Venturelli R, Ježov J, Brown J, Kruusmaa M, Fiorini P, Megill WM. 2014. A fish perspective: detecting flow features while moving using an artificial lateral line in steady and unsteady flow. J. R. Soc. Interface 11, 20140467 ( 10.1098/rsif.2014.0467) [DOI] [PMC free article] [PubMed] [Google Scholar]
- 7.Kottapalli AGP, Asadnia M, Miao JM, Barbastathis G, Triantafyllou MS. 2012. A flexible liquid crystal polymer MEMS pressure sensor array for fish-like underwater sensing. Smart Mater. Struct. 21, 115030 ( 10.1088/0964-1726/21/11/115030) [DOI] [Google Scholar]
- 8.Shimozawa T, Kumagai T, Baba Y. 1998. Structural scaling and functional design of the cercal wind-receptor hairs of cricket. J. Comp. Physiol. A 183, 171–186. ( 10.1007/s003590050245) [DOI] [Google Scholar]
- 9.Droogendijk H, de Boer MJ, Sanders RGP, Krijnen GJM. 2014. A biomimetic accelerometer inspired by the cricket's clavate hair. J. R. Soc. Interface 11, 20140438 ( 10.1098/rsif.2014.0438) [DOI] [PMC free article] [PubMed] [Google Scholar]
- 10.Möller AR. 2003. Sensory systems: anatomy and physiology. San Diego, CA: Academic press. [Google Scholar]
- 11.Vannetten SM, Khanna SM. 1994. Stiffness changes of the cupula associated with the mechanics of hair cells in the fish lateral line. Proc. Natl Acad. Sci. USA 91, 1549–1553. ( 10.1073/pnas.91.4.1549) [DOI] [PMC free article] [PubMed] [Google Scholar]
- 12.Gemmell BJ, Adhikari D, Longmire EK. 2014. Volumetric quantification of fluid flow reveals fish's use of hydrodynamic stealth to capture evasive prey. J. R. Soc. Interface 11, 20130880 ( 10.1098/rsif.2013.0880) [DOI] [PMC free article] [PubMed] [Google Scholar]
- 13.Marras S, Killen SS, Lindstroem J, McKenzie DJ, Steffensen JF, Domenici P. 2015. Fish swimming in schools save energy regardless of their spatial position. Behav. Ecol. Sociobiol. 69, 219–226. ( 10.1007/s00265-014-1834-4) [DOI] [PMC free article] [PubMed] [Google Scholar]
- 14.Liao JC, Beal DN, Lauder GV, Triantafyllou MS. 2003. Fish exploiting vortices decrease muscle activity. Science 302, 1566–1569. ( 10.1126/science.1088295) [DOI] [PubMed] [Google Scholar]
- 15.Coombs S. 2001. Smart skins: information processing by lateral line flow sensors. Auton. Robots 11, 255–261. ( 10.1023/A:1012491007495) [DOI] [Google Scholar]
- 16.Barbier C, Humphrey JAC. 2009. Drag force acting on a neuromast in the fish lateral line trunk canal. I. Numerical modelling of external–internal flow coupling. J. R. Soc. Interface 6, 627–640. ( 10.1098/rsif.2008.0291) [DOI] [PMC free article] [PubMed] [Google Scholar]
- 17.Webb JF. 2013. Morphological diversity, development, and evolution of the mechanosensory lateral line system. In The lateral line system (eds Coombs S, Bleckmann H, Fay RR, Popper AN). Springer Handbook of Auditory Research, vol. 48, pp. 17–72. New York, NY: Springer; ( 10.1007/2506_2013_12) [DOI] [Google Scholar]
- 18.Montgomery JC, Coombs S, Baker CF. 2001. The mechanosensory lateral line system of the hypogean form of astyanax fasciatus. Environ. Biol. Fish. 62, 87–96. ( 10.1023/A:1011873111454) [DOI] [Google Scholar]
- 19.Coombs S, Van Netten S. 2006. The hydrodynamics and structural mechanics of the lateral line system. Fish Physiol. 23, 103–139. ( 10.1016/S1546-5098(05)23004-2) [DOI] [Google Scholar]
- 20.Yang Y, Klein A, Bleckmann H, Liu C. 2011. Artificial lateral line canal for hydrodynamic detection. Appl. Phys. Lett. 99, 023701 ( 10.1063/1.3610470) [DOI] [Google Scholar]
- 21.Yoshizawa M, Jeffery WR, van Netten SM, McHenry MJ. 2014. The sensitivity of lateral line receptors and their role in the behavior of Mexican blind cavefish (Astyanax mexicanus). J. Exp. Biol. 217, 886–895. ( 10.1242/jeb.094599) [DOI] [PMC free article] [PubMed] [Google Scholar]
- 22.Liu C. 2007. Recent developments in polymer MEMS. Adv. Mater. 19, 3783–3790. ( 10.1002/adma.200701709) [DOI] [Google Scholar]
- 23.Engel JM, Chen J, Liu C, Bullen D. 2006. Polyurethane rubber all-polymer artificial hair cell sensor. J. Microelectromech. Syst. 15, 729–736. ( 10.1109/JMEMS.2006.879373) [DOI] [Google Scholar]
- 24.Peleshanko S, et al. 2007. Hydrogel-encapsulated microfabricated haircells mimicking fish cupula neuromast. Adv. Mater. 19, 2903–2909. ( 10.1002/adma.200701141) [DOI] [Google Scholar]
- 25.Tao JL, Yu X. 2012. Hair flow sensors: from bio-inspiration to bio-mimicking—a review. Smart Mater. Struct. 21, 113001 ( 10.1088/0964-1726/21/11/113001) [DOI] [Google Scholar]
- 26.Kottapalli AGP, Asadnia M, Miao JM, Triantafyllou MS. 2014. Soft polymer membrane micro-sensor arrays inspired by the mechanosensory lateral-line on the blind cavefish. J. Intel. Mater. Syst. Struct. 26, 38–46. ( 10.1177/1045389X14521702) [DOI] [Google Scholar]
- 27.Chen N, Tucker C, Engel JM, Yang Y, Pandya S, Liu C. 2007. Design and characterization of artificial haircell sensor for flow sensing with ultrahigh velocity and angular sensitivity. J. Microelectromech. Syst. 16, 999–1014. ( 10.1109/JMEMS.2007.902436) [DOI] [Google Scholar]
- 28.Yang Y, Nguyen N, Chen N, Lockwood M, Tucker C, Hu H, Bleckmann H, Liu C, Jones DL. 2010. Artificial lateral line with biomimetic neuromasts to emulate fish sensing. Bioinspir. Biomim. 5, 016001 ( 10.1088/1748-3182/5/1/016001) [DOI] [Google Scholar]
- 29.Dagamseh A, Wiegerink R, Lammerink T, Krijnen G. 2013. Imaging dipole flow sources using an artificial lateral-line system made of biomimetic hair flow sensors. J. R. Soc. Interface 10, 20130162 ( 10.1098/rsif.2013.0162) [DOI] [PMC free article] [PubMed] [Google Scholar]
- 30.Goulet J, Engelmann J, Chagnaud BP, Franosch J-MP, Suttner MD, van Hemmen JL. 2008. Object localization through the lateral line system of fish: theory and experiment. J. Comp. Physiol. A 194, 1–17. ( 10.1007/s00359-007-0275-1) [DOI] [PubMed] [Google Scholar]
- 31.Pandya S, Yang Y, Jones DL, Engel J, Liu C. 2006. Multisensor processing algorithms for underwater dipole localization and tracking using MEMS artificial lateral-line sensors. EURASIP J. Adv. Signal Process. 2006, 076593 ( 10.1155/ASP/2006/76593) [DOI] [Google Scholar]
- 32.Asadnia M, Kottapalli AGP, Shen Z, Miao J, Triantafyllou M. 2013. Flexible and surface-mountable piezoelectric sensor arrays for underwater sensing in marine vehicles. IEEE Sens. J. 13, 3918–3925. ( 10.1109/JSEN.2013.2259227) [DOI] [Google Scholar]
- 33.Asadnia M, Kottapalli AGP, Miao JM, Randles AB, Sabbagh A, Kropelnicki P, Tsai JM. 2014. High temperature characterization of PZT(0.52/0.48) thin-film pressure sensors. J. Micromech. Microeng. 24, 015017 ( 10.1088/0960-1317/24/1/015017) [DOI] [Google Scholar]
- 34.Asadnia M, Kottapalli AGP, Shen Z, Miao JM, Barbastathis G, Triantafyllou MS. 2013. Flexible, zero powered, piezoelectric MEMS pressure sensor arrays for fish-like passive underwater sensing in marine vehicles. In 26th IEEE Int. Conf. on Micro Electro Mechanical Systems, Taipei, Taiwan, 20–24 January 2013, pp. 126–129. ( 10.1109/MEMSYS.2013.6474193) [DOI] [Google Scholar]
- 35.Chaudhri BP, Ceyssens F, De Moor P, Van Hoof C, Puers R. 2010. A high aspect ratio SU-8 fabrication technique for hollow microneedles for transdermal drug delivery and blood extraction. J. Micromech. Microeng. 20, 064006 ( 10.1088/0960-1317/20/6/064006) [DOI] [Google Scholar]
- 36.Natarajan S, Chang-Yen DA, Gale BK. 2008. Large-area, high-aspect-ratio SU-8 molds for the fabrication of PDMS microfluidic devices. J. Micromech. Microeng. 18, 045021 ( 10.1088/0960-1317/18/4/045021) [DOI] [Google Scholar]
- 37.Asadnia M, Kottapalli AGP, Haghighi R, Cloitre A, Alvarado PV, Miao J, Triantafyllou M. 2015. MEMS sensors for assessing flow-related control of an underwater biomimetic robotic stingray. Bioinspir. Biomim. 10, 036008 ( 10.1088/1748-3190/10/3/036008) [DOI] [PubMed] [Google Scholar]
- 38.McConney ME, Chen N, Lu D, Hu HA, Coombs S, Liu C, Tsukruk VV. 2009. Biologically inspired design of hydrogel-capped hair sensors for enhanced underwater flow detection. Soft Matter 5, 292–295. ( 10.1039/b808839j) [DOI] [Google Scholar]
- 39.Coombs S, Jansse J. 1989. Peripheral processing by the lateral line system of the mottles sculpin (Cottus bairdi). In The mechanosensory lateral line: neurobiology and evolution (eds Coombs S, Görner P, Münz H), pp. 299–319. New York, NY: Springer; ( 10.1007/978-1-4612-3560-6_15) [DOI] [Google Scholar]
- 40.Engel JM, Chen J, Bullen D, Liu C. 2005. Polyurethane rubber as a MEMS material: characterization and demonstration of an all-polymer two-axis artificial hair cell flow sensor. In 18th IEEE Int. Conf. on Micro Electro Mechanical Systems, Miami Beach, FL, 30 January–3 February 2005, pp. 279–282. ( 10.1109/MEMSYS.2015.1453921) [DOI] [Google Scholar]
- 41.Zhang S, Lou L, Park W-T, Lee C. 2012. Characterization of a silicon nanowire-based cantilever air-flow sensor. J. Micromech. Microeng. 22, 095008 ( 10.1088/0960-1317/22/9/095008) [DOI] [Google Scholar]
- 42.Song C, Aiyar AR, Kim SH, Allen MG. 2011. Exploitation of aeroelastic effects for drift reduction, in an all-polymer air flow sensor. Sens. Actuators A Phys. 165, 66–72. ( 10.1016/j.sna.2010.01.008) [DOI] [Google Scholar]
- 43.Coombs S. 1994. Near field detection of dipole sources by the goldfish (Carassium auratus) and the mottled sculpin (Cottus bairdi). J. Exp. Biol. 190, 109–129. [DOI] [PubMed] [Google Scholar]
- 44.Kottapalli AGP, Asadnia M, Miao J, Triantafyllou M. 2014. Touch at a distance sensing: lateral-line inspired MEMS flow sensors. Bioinspir. Biomim. 9, 046011 ( 10.1088/1748-3182/9/4/046011) [DOI] [PubMed] [Google Scholar]
Associated Data
This section collects any data citations, data availability statements, or supplementary materials included in this article.


