Abstract
Observations suggest that the landscape of marine phytoplankton assemblage might be strongly heterogeneous at the dynamical mesoscale and submesoscale (10–100 km, days to months), with potential consequences in terms of global diversity and carbon export. But these variations are not well documented as synoptic taxonomic data are difficult to acquire. Here, we examine how phytoplankton assemblage and diversity vary between mesoscale eddies and submesoscale fronts. We use a multi-phytoplankton numerical model embedded in a mesoscale flow representative of the North Atlantic. Our model results suggest that the mesoscale flow dynamically distorts the niches predefined by environmental contrasts at the basin scale and that the phytoplankton diversity landscape varies over temporal and spatial scales that are one order of magnitude smaller than those of the basin-scale environmental conditions. We find that any assemblage and any level of diversity can occur in eddies and fronts. However, on a statistical level, the results suggest a tendency for larger diversity and more fast-growing types at fronts, where nutrient supplies are larger and where populations of adjacent water masses are constantly brought into contact; and lower diversity in the core of eddies, where water masses are kept isolated long enough to enable competitive exclusion.
Keywords: phytoplankton, biodiversity, diatoms, mesoscale eddies, submesoscale fronts
1. Introduction
Phytoplankton form the base of the marine food web, providing an essential ecological function for all marine life. The question of how their diversity and assemblage is distributed over the global ocean is important for the functioning of oceanic ecosystems and ocean biogeochemical cycles [1,2]. While the broad contrasts in phytoplankton diversity and assemblage between the tropical and polar oceans are being revealed [3–8], detailed observations have suggested that the marine phytoplankton diversity landscape might be strongly heterogeneous over short distances, i.e. 10–100 km [9–15]. However, little is known about this small-scale variability of diversity, and its biological and biogeochemical implications. This is further complicated by the fact that small-scale observations are sparse and can only provide a glimpse of the complex, time-evolving situation.
To understand biodiversity variability, it is necessary to consider the full drivers of plankton biogeography. The biogeography of phytoplankton diversity and assemblage is primarily controlled by adaptation of phytoplankton to their environment, i.e. mainly temperature, nutrient availability, predation and vertical stability [16–18]. However, the local balance between growth, losses and competition driven by environmental conditions is not sufficient to fully explain this biogeography. Unlike terrestrial ecosystems, the phytoplankton landscape is dynamic: phytoplankton are constantly being dispersed by surface currents, such that the distribution of individual phytoplankton types results from a balance between net local growth, competition and dispersal [19]. Of particular relevance here is the ‘ocean weather’ [20], i.e. the strong variability of ocean currents at the mesoscale (approx. 100 km) and submesoscale (approx. 10 km). Importantly, the timescales associated with this mesoscale turbulence are a few months for mesoscale eddies and a few days for submesoscale fronts, and may resonate with phytoplankton biological and ecological timescales. In this work, we hypothesize that mesoscale and submesoscale currents provide a dynamical landscape that shapes the distribution of phytoplankton assemblage and affects phytoplankton diversity on timescales of days to months.
Mesoscale and submesoscale patchiness in the total population of marine phytoplankton (e.g. chlorophyll concentration) is a prominent feature of satellite ocean colour images and has received significant attention over the past decade (see reviews by [21–23]). In contrast, only a few studies have examined how the composition of the phytoplankton population varied over these small scales. This is important, because some types are more efficient at exporting carbon than others [24]. The few observational studies that have considered the mesoscale landscape of phytoplankton communities have found ambiguous results. For instance, low diatom abundance was found in a long-lived mesoscale eddy in the Gulf of Alaska [14], whereas high abundance was found in a mode-water eddy near Bermuda [12] and in a Gulf Stream warm-core ring [9]. Dominance of diatoms has also been reported over fronts [10,11] and optical remote sensing observations have revealed that phytoplankton assemblages with distinct optical properties were segregated on either sides of meandering submesoscale fronts [5,13]. In parallel to these sporadic observations, modelling studies using the multi-phytoplankton model DARWIN [25] embedded into a hierarchy of regional and global ocean configurations have examined the mean impact of mesoscale turbulence on phytoplankton diversity [19,26]. These studies suggested that dispersal induced by mesoscale turbulence enhances the ability of different phytoplankton types to coexist and could thus explain the existence of regional phytoplankton diversity hotspots.
To test our hypothesis, we used the DARWIN multi-phytoplankton model embedded in a high-resolution regional model representative of the North Atlantic, which allowed us to perform statistical analysis over a large number of mesoscale eddies and submesoscale fronts. For convenience, we divided the model phytoplankton types into two functional groups with differing effects on carbon fluxes, fast-growing opportunists such as sinking diatoms and other large phytoplankton types, and gleaners able to survive on minimal resources, such as phototrophic cyanobacteria and pico-eukaryotes, locked in a tightly coupled microbial loop. We examine the possibility that there is a prevalence of either opportunists or gleaners in eddies or at fronts. In addition, we characterize diversity according to the ability of different types to coexist, regardless of the group to which they belong. The question is whether eddies and/or fronts boost diversity and why. The model results are then discussed in terms of ecological and biogeochemical implications.
2. Method
We examine the small-scale distribution of numerous phytoplankton types in a numerical biophysical model that describes seasonally varying environmental conditions representative of the highly turbulent Northwest Atlantic ocean over the Gulf Stream region. The biological model equations (DARWIN, [25]) describe the evolution of a large set of phytoplankton types. The physical model (GYRE, [27]) accounts for variations in environmental conditions from the scale of oceanic basin to the submesoscale and for seasonality.
2.1. Model set-up
2.1.1. Biological model
The DARWIN model resolves 100 phytoplankton types, two grazer size classes and the cycling of nitrogen, phosphorus and silica through inorganic, living and dissolved and particulate organic forms. We use the DARWIN model version of [26] which is similar to that used in [3] (see reference [28], for details, equations and parameter values).
The phytoplankton types are divided into two broad groups. One group are small and have high nutrient affinity [29] and as such are more successful in stable low nutrient regimes (see discussion in reference [28]). We parametrize these types to have low growth rates typical of phototrophic cyanobacteria (e.g. Prochlorococcus and Synecococcus) and other picophytoplankton [30]. We refer to this group as ‘gleaners’. The second group is assumed to have high growth rates typical of diatoms, but to be bigger and thus have lower nutrient affinity and sinks gravitationally. This group is more successful in more seasonal regimes with higher nutrient supply. This group we will refer to as ‘opportunists’. Within these two groups, different light, temperature and resource requirements make each type unique and potentially better adapted to a specific environment. The parameters that define each type are randomly assigned within a range of plausible values. The two grazer classes (large and small) preferentially graze on the two phytoplankton groups based on size (i.e. large zooplankton preferentially feeds on opportunists). There is an additional linear loss term for the plankton to represent exudation and cell death.
2.1.2. Physical model
The ocean circulation and thermodynamics are assessed by solving the primitive equations with the ocean circulation model code nucleus for European modelling of the ocean (NEMO; [31]). The GYRE model domain features a rectangle of dimensions 2000 × 3000 km, of 4 km depth, rotated by 45° on the β-plane (figure 1a), with closed boundaries and forced at the surface with seasonal buoyancy fluxes and wind. The horizontal grid resolution is 1/54°, which permits the inclusion of mesoscale and submesoscale features of the flow with an effective resolution of 1/9° [32]. There are 30 vertical levels.
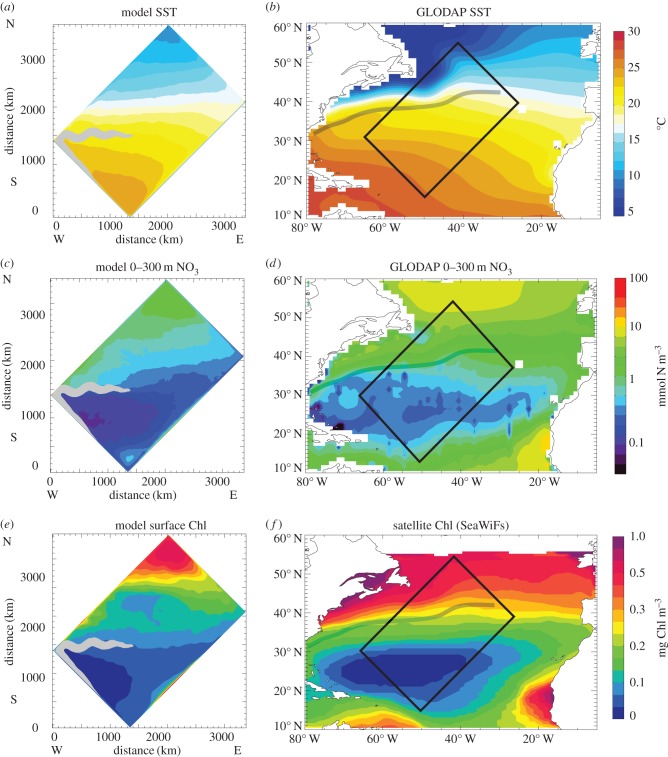
Figure 1.
Large-scale environment in the model (left panels) and observed in the North Atlantic (right panels). (a,b) Annual mean sea surface temperature (SST). (c,d) Annual nitrate concentration averaged over the top 300 m (in mmol N m–3). (e,f) Annual mean abundance of total phytoplankton at the surface (in mg Chl m–3). The grey shading overlaid on the model plots mark the surface extension of the model's western boundary current (surface velocity larger than 0.5 m s–1, i.e. the models' Gulf Stream). The mean Gulf Stream path is reported on the data plots with a dashed grey line. Temperature and nitrate data come from the Global Ocean Data Analysis Project (GLODAP). Phytoplankton data (chlorophyll) come from SeaWiFs satellite climatology. The black rectangle reported on the data plot is for illustrative purposes only and is not to scale.
2.1.3. Off-line model integration
Five years of high-resolution velocities, temperature and vertical mixing saved from the physical model were used to drive the DARWIN model in off-line mode within the Massachusetts Institute of Technology general circulation model (MITgcm) framework [33] at 1/9° horizontal resolution and integrated forward for 20 years, by repeating the 5 years of forcings provided by the physical model four times. We started from identical distributions of biomass for all plankton types, and from nutrient fields derived from [34]. Model outputs were saved every 2 days (48 h averages). The concentrations of phytoplankton and the diversity indexes shown below were averaged over the top 100 m. Our analysis is based on the past 5 years. This provides us five different realizations of seasonally evolving fronts and eddies.
2.2. Measures of diversity
Importantly, in the DARWIN model, the types are not mutually exclusive, but many can coexist at the same location, in different proportions [3,19,26,35]. We use two measures of diversity, the richness (R), defined as the number of phytoplankton types Pj that exceed a relative threshold biomass concentration of Pj > 10−5 max(Pj), and the Shannon index (H) which, in addition, accounts for the relative proportion of each type. H is larger when many types coexist in even proportions [36]: H = −∑jpj ln(pj), with pj the biomass of type Pj divided by the total biomass. H has its maximum value of ln(n), with n the number of types, when all types are represented by equal amounts.
2.3. General features of the model solution
The model solution consists of a seasonally varying, semi-realistic Northwest Atlantic with a baroclinically unstable jet (the model's Gulf Stream) separating a warm and nutrient-depleted subtropical region south of the jet from a colder, nutrient-replete subpolar gyre region north of it (figure 1a,c). These large-scale features represent the mean environmental conditions observed in the North Atlantic (figure 1b,d). In response to these environmental conditions, the model annual mean chlorophyll displays a marked latitudinal gradient with large values in the subpolar region and much lower values in the subtropical region, in agreement with satellite observations in the North Atlantic (figure 1e,f).
The instability of the model's Gulf Stream leads to a rapidly evolving mesoscale turbulence characterized by a large number of interacting mesoscale eddies and submesoscale thermal fronts (figure 2, see also animation provided as electronic supplementary material).
Figure 2.
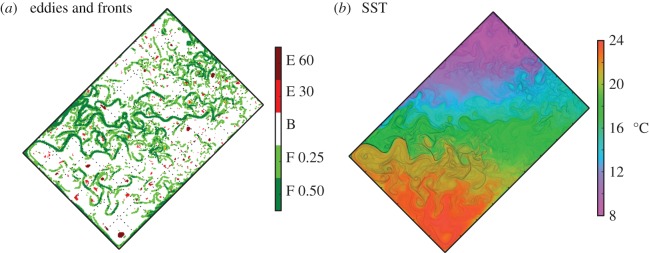
Model snapshots on day of year 100. (a) Identification of different features of the flow: eddies (E, in red) and fronts (F, in green). Two different tones of green and red are used to distinguish the strength of the criteria used to identify each feature: for eddies, retention times larger than 30 (resp. 60) days; for fronts, sea surface temperature (SST) gradients larger than 0.25 (resp. 0.5) °C per grid cell size. The background B is shown in white. (b) SST (colour scale) with finite size Lyapunov exponents (FSLE) overlaid (black contours). Annual animations of these two panels are provided as supplementary material (E2F2.mp4 and SST.mp4).
2.4. Identification of eddies and fronts
We performed statistical analysis of the distribution of gleaners, opportunists, richness and Shannon index in eddies and fronts. We identified fronts on the basis of the strength of the local sea surface temperature (SST) gradient. We used a threshold value of 0.5°C per grid cell size (i.e. roughly 0.5° over 10 km; dark green areas in figure 2a), which selected approximately 5% of the total number of grid cells. We also tested a smaller value (0.25°C per grid cell, light green in figure 2a), accounting for approximately 20% of the total number of grid cells.
The timescales associated with fronts were assessed by computing the finite size Lyaponov exponents (FSLE; figure 2b) from the time-varying model velocity field (see also [37], §2.1 for details on FSLE). FSLE measure the rate of divergence of particles transported by the flow. The correspondence between the meandering temperature patterns and the FSLE (figure 2b) indicated that the temperature fronts were created by horizontal stirring, and corresponded to dynamical fronts enclosing water masses of similar history [38]. The median timescales of the temperature fronts was 15 ± 16 days for fronts with SST gradients larger than 0.5°C per grid cell, 24 ± 17 days for gradients between 0.25 and 0.5°C per grid cell, and 33 ± 17 days for gradients between 0.1 and 0.25°C per grid cell. This timescale corresponds to the times it takes for nearby particles (1/18° appart) to diverge by 1° backward in time.
Mesoscale eddies were identified as the features that retained the same water mass in their core for more than 60 days (dark red areas in figure 2a), representing roughly 1% of the total number of grid cells. This criterion filters out non-retentive and short-lived eddies and retains only the retentive cores. We also conducted a sensitivity analysis with a less selective criteria of 30 days (light green in figure 2a), representing 3% of the grid cells.
Retention time was computed by advecting particles inside each eddy backward in time and marking the time at which a particle trajectory crosses the boundary of an eddy [37]. This boundary was defined as the region where strain and vorticity have the same intensity (i.e. where the Okubo–Weiss parameter is equal to zero). In other words, a map of retention times indicates for each point inside an eddy how long since a particle has entered that eddy. Although strong eddies (either in terms of vorticity or kinetic energy) may often display a trapping effect, looking at Eulerian (instantaneous) properties is not a precise proxy of retention. Retention in general depends on many features of an eddy's life cycle, such as its age, its drifting speed, and whether the eddy is intensifying or decaying. By explicitly looking at particle trajectories, all these time-dependent features are explicitly accounted for.
3. Results
3.1. Small-scale landscape of phytoplankton types
After an initial adjustment of 15 years, 20 out of the initial 100 types survived, whereas the others fell below the threshold of numerical noise and were assumed to have become extinct. On an annual mean, our model's subtropical gyre is dominated by the gleaners locked in tight coupling with the small grazer class, whereas the subpolar region is dominated by opportunists whose blooms lead to temporal increases in the larger grazer class (figure 3a). Within each of these two broad groups, the habitat of different types occupy distinct domains, characterized by specific environmental conditions (i.e. temperature and nitrate, figure 1a,c). Nutrient gradients explain the separation of the two groups between the two gyres, but temperature separates the habitats of different types within the groups (shading within the green and pink in figure 3). There is a strong bloom of opportunists in the subpolar gyre in spring, whereas gleaners show more even concentrations and dominate the phytoplankton biomass except during the bloom (see a movie of figure 4 provided as electronic supplementary material). These general features are consistent with observations [39,40].
Figure 3.
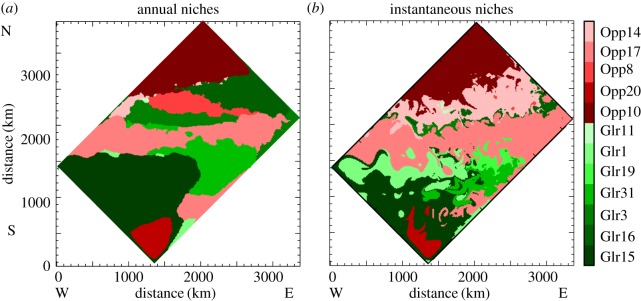
Niches of the different phytoplankton types, with opportunist niches in red tones and gleaner niches in green tones. Niches are defined as the areal extent where a type is more abundant than any other type. (a) Niches derived from annual mean abundances. (b) Niches derived from abundances on day of year 100. The large-scale distribution of niches is set by the large-scale environmental conditions, and these are being stirred by the turbulent flow.
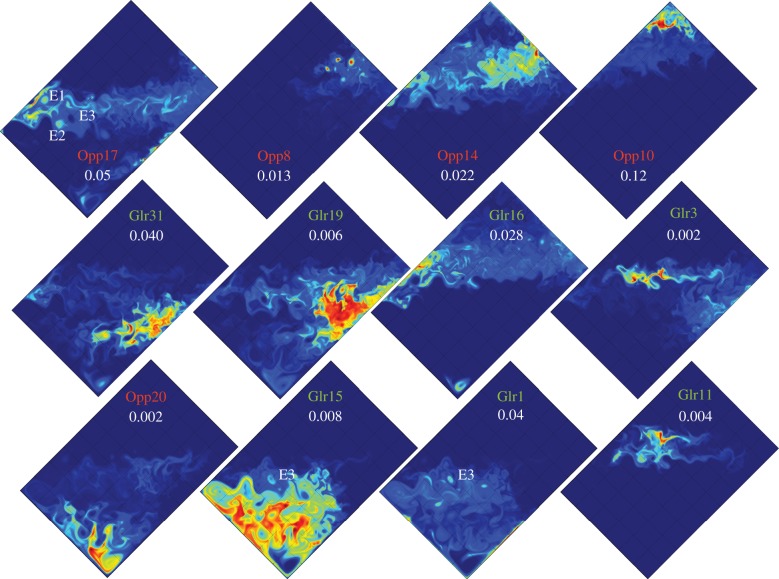
Figure 4.
Model snapshots on day of year 100. Shown are the 12 phytoplankton types that dominate during this time of year, five opportunists and seven gleaners. In order to highlight the spatial patterns, the colour scales are linearly fitted between 0 (blue filling) and each type maximum concentration (red filling). The maximum concentrations (in mmolP m−3) are indicated with white numbers. The plots are ordered from types occupying the north (upper right) to the south (lower left). An annual animation of this figure is provided as supplementary material (types.mp4).
A model's snapshot in spring highlights the complexity of habitats of the different temporally dominant phytoplankton types in the mesoscale flow (figure 4): the landscape of the different phytoplankton types at small spatial scale is organized in adjacent niches (figure 3b) which are delimited by the small-scale temperature fronts and FSLE (figure 2b). Hence, the model phytoplankton landscape is structured in niches which are dynamic in nature and shaped by the turbulent nature of the fluid at these scales (figure 3b). This model landscape is reminiscent of the landscape described by d'Ovidio et al. [13] on the basis of satellite observations of dominant phytoplankton types combined with estimates of dynamical fronts based on satellite altimetry. At first sight, the instantaneous phytoplankton landscape thus reflects the stirring by the mesoscale flow of large-scale niches spanning a few degrees in latitude and related to temperature (figure 3).
Importantly, although the signature of eddies and fronts is clearly visible on all snapshots in figure 4, there is no obvious segregation at the scale of eddies or at the scale of fronts, i.e. no obvious prevalence of either opportunists or gleaners in eddies or at fronts. All types display maxima in specific fronts. However, there is no clear distinction within eddies. For instance, Opp17 dominates in eddies E1 and E2, whereas Glea1 and 15 dominate in the nearby eddy E3. In this particular example, E3 forms an enclave of Glea1 and 15 within the niche occupied by Opp17; this enclave was created by the formation and displacement of E1 across the front formed by the jet. Waters from the niche of Glea1 and 15 are brought into the niche of Opp17, on a timescale short enough to maintain the dominance of Glea1 and 15 (see reference [41], for more details on this transport mechanism).
3.2. Statistical distribution of phytoplankton types
The synoptic distribution of gleaners and opportunists shows that both groups can be either absent or present in specific eddies or fronts (figure 4). Now, we examine whether there is a differentiation in the distributions of gleaners and opportunists on a statistical level, i.e. when their biomass is averaged over all fronts and all eddies, regardless of geographical location and time (figure 5).
Figure 5.
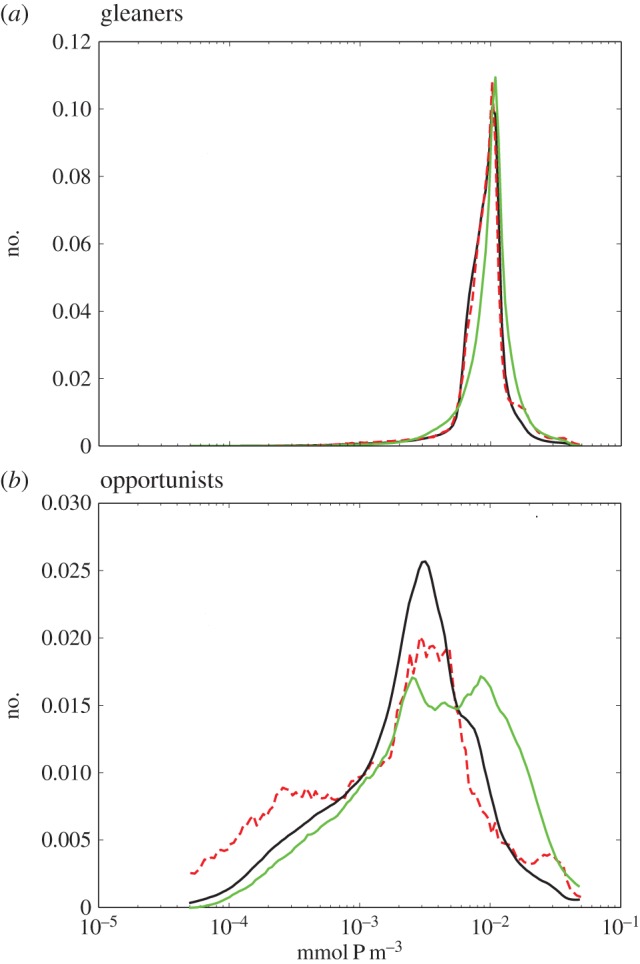
Distribution of (a) gleaners and (b) opportunists in fronts (green), eddies (dashed red), and in the background (black), regardless of location and time of year. Note the log scale. The distribution of opportunists is skewed towards larger values at fronts and lower values within the core of retentive eddies. The distribution of gleaners is more even.
The density distribution of gleaners is very peaked and reveals very little variability between eddy and frontal features (figure 5a). In contrast, the density distribution of opportunists is skewed towards the largest values at fronts (green, figure 5b), and towards the lowest values inside eddies (red, figure 5b). This indicates that the odds to encounter large abundances of opportunists are largest at fronts while it is more common to find low abundances in the core of eddies. These statistics are not significantly sensitive to the criteria used to select front and eddies (not shown; see Method).
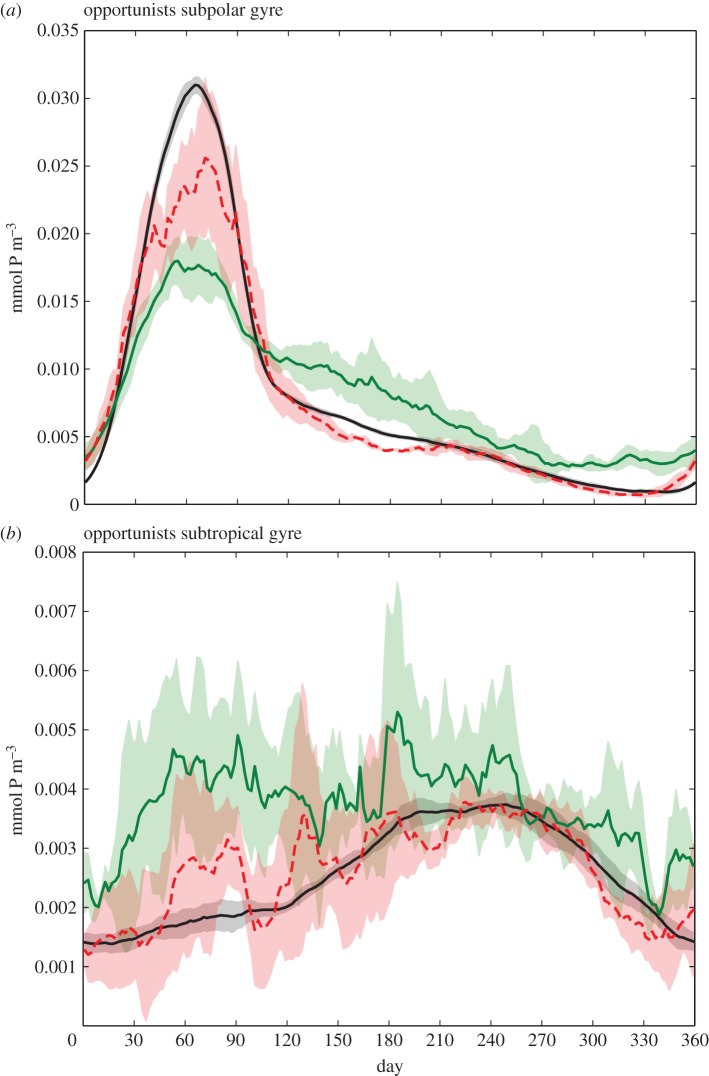
These results exhibit seasonality (figure 6): the larger abundance of opportunists at fronts is only valid in oligotrophic conditions. Such conditions prevail during summer in the subpolar gyre (figure 6a) and all year long in the subtropical gyre (figure 6b). The situation is different during the bloom in the subpolar gyre (figure 6a, days 30–90) during which the biomass of opportunists is strongly decreased at fronts compared with background conditions. The larger presence of opportunists at fronts during oligotrophic periods is consistent with the enhanced supply of nutrients from below driven by submesoscale vertical velocities associated with frontogenesis [42]. Inversely during the bloom, these vertical velocities subduct biomass [22].
Figure 6.
Seasonal evolution of opportunists in fronts (green), in eddies (dashed red), and in the background (black), in the subpolar gyre (north of the jet) (a) and in the subtropical gyre (south of the jet) (b). The colour shading shows the standard deviation over the 5 years of model run, i.e. over different realizations of eddies and fronts.
To sum up, there is no clear segregation in the presence of opportunists and gleaners at fronts or inside eddies in our results. However, we found that, with the exception of the bloom period, the proportion of opportunists to the total biomass is larger at fronts. We also find that gleaners are more evenly distributed, with less differentiation between fronts, eddies and background conditions than opportunists. These results are consistent with the fact that observations within eddies sometimes reveal the prevalence of gleaners and at other times the prevalence of opportunists [9,12,14]. The results are also consistent with the general observations that the concentration of opportunists at fronts is enhanced compared with surrounding areas [10,11].
3.3. Small-scale variability of diversity
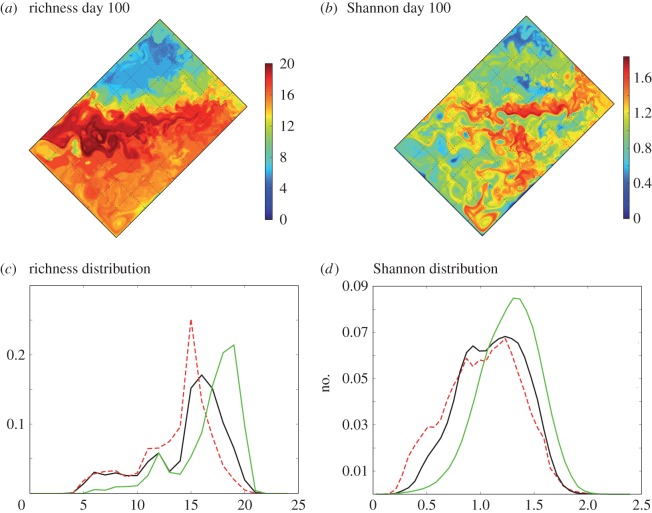
Finally, we examine how diversity is shaped by the mesoscale flow. An individual map of richness reveals a strong latitudinal gradient, with significantly larger richness in the subtropical gyre than in the subpolar gyre, and also a marked richness hot spot between the two gyres (figure 7a). The decline of diversity with increasing latitude and the presence of diversity hotspots over boundary currents are patterns that had previously been identified with a global coarse-resolution configuration of the DARWIN model [3]. The Shannon map is also strongly heterogeneous, but does not show such a clear latitudinal gradient, revealing that the relative richness of the subtropics is associated with a large degree of unevenness (figure 7b).
Figure 7.
Measures of diversity. (a) Snapshot of richness at day of year 100. (b) Snapshot of Shannon index at day of year 100. (c) Distribution of richness in fronts (green), eddies (dashed red) and in the background (black), regardless of location and time of year. (d) Distribution of Shannon index in fronts (green), eddies (dashed red) and in the background (black), regardless of location and time of year. The distributions are skewed towards larger diversity at fronts and lower diversity within the core of retentive eddies. Annual animations of the Shannon index is provided as electronic supplementary material (Shannon.mp4).
Importantly, both the Shannon (H) and richness (R) maps suggest a range of responses, especially within eddies (figure 7a). Some eddies and fronts are locations of local minima of H and R, others of local maxima. The statistical analysis reveals that the distribution of both H and R are clearly skewed towards larger values at fronts, and towards lower values inside eddies (figure 7c,d). Diversity is not always larger at fronts and lower within eddies but statistically over a large number of each feature, diversity is larger at fronts and lower within eddies. The fact that this result holds for both R and H shows that the extra types are not necessarily in small number.
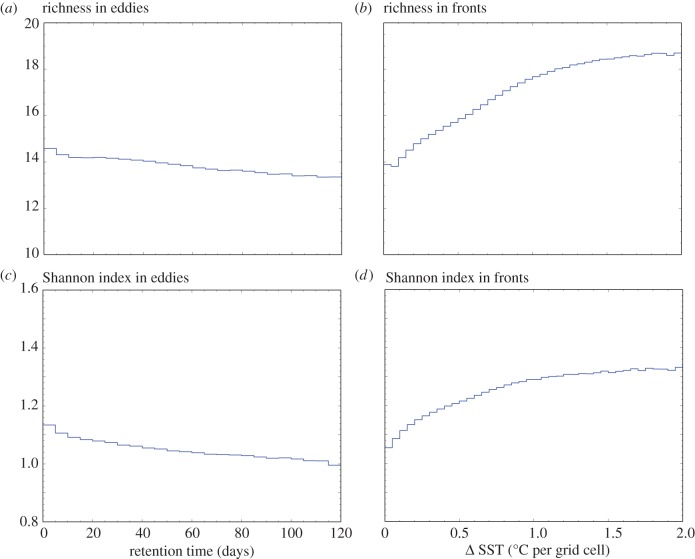
One question is the timescale over which these changes in diversity occur. Figure 8a,c shows that in the core of eddies, diversity decreases as the retention timescale of the eddy increases (in the range 0–3 months explored in this study), for both R and H. Inversely, diversity at fronts increases for stronger SST gradients (figure 8b,d), i.e. for faster separation timescales (in the range 1–60 days). These strong relationships highlight the resonance between the physical and biological timescales: the larger diversity at fronts is consistent with the mixing of phytoplankton communities on either side of these fronts that occurs on timescale faster than competitive exclusion. In contrast, the lower diversity in the core of eddies can be explained by the trapping of initially diverse communities over long enough to allow the decline of this diversity through competitive exclusion.
Figure 8.
(a) Mean richness in eddies against eddy retention timescale. (b) Mean richness in fronts against front SST gradient. (c) Mean Shannon index in eddies against eddy retention timescale. (d) Mean Shannon index in fronts against front SST gradient. In eddies, diversity decreases with increasing retention timescale; at fronts, diversity increases with increasing SST gradients, i.e. for faster mixing timescales.
4. Discussion
4.1. What shapes the biogeography of phytoplankton assemblage?
When applied to ocean microbes, the Baas Becking hypothesis—that ‘everything is everywhere, but, the environment selects’—posits that phytoplankton communities are efficiently dispersed by the moving ocean and their distribution is entirely determined by environmental conditions. However, microbial studies have shown that locations closely connected by advection over large distances (more than 1000 km) have more similar phytoplankton assemblages than those that are not [43]. Similar findings were established at smaller spatial scales (10–100 km), on the basis of optical satellite observations of phytoplankton types combined with advection estimates based on mesoscale currents from satellite altimetry [13].
In our model and at large spatial scales, the niches of dominant types are largely determined by the environmental conditions in nitrate and temperature (figure 3a), supporting the Baas Becking hypothesis. However, at smaller scale, mesoscale advection stirs the phytoplankton niches, as seen by their meandering shape that coincide with the physical features (figure 3b). These features are very dynamic. The mixing timescales associated with fronts (days) and the retention timescale associated with eddies (months) are such that they interact with the phytoplankton biological and ecological timescales. This has two main consequences: the enhancement of the proportion of opportunists at fronts, owing to the larger supplies of nitrate and the decrease in abundance of less competitive types in the core of eddies through competitive exclusion. Our model results thus suggest that the small-scale phytoplankton assemblage is determined by three factors: (i) the large-scale environmental conditions, which set the broad phytoplankton biogeography; (ii) horizontal stirring, which dynamically distorts the large-scale niches; and (iii) biological and ecological responses, on the dynamical timescales of fronts and eddies.
4.2. How does mesoscale turbulence affect phytoplankton diversity?
The competitive exclusion principle posits that only a few types (equal to the number of limiting resources) should survive [44]. The high phytoplankton diversity observed in reality appears contradictory to the competitive exclusion principle (the ‘paradox of the plankton’, [45]). Two previous model studies have suggested that mesoscale turbulence could explain this paradox; using only two phytoplankton types (one less competitive than the other), Bracco et al. [46] suggested that eddies provided a shelter to the weakest type in a highly turbulent flow. Perruche et al. [47] also used a two types system (a gleaner and an opportunist) to suggest that there would be mutual exclusion in a quiescent ocean but that both could survive in an eddying flow.
The model used here is more complex than in these two previous studies. Our model allows for diversity within each of these two groups. Moreover, in our model, different types have the ability to coexist even in a quiescent ocean, because different combinations of physiological parameters can lead to similar fitness [3]. An additional important difference is that we account for the variability in environmental conditions over basinwide distances and over the seasonal cycle. With these differences in mind, our conclusions on how mesoscale turbulence affects phytoplankton diversity are more complex than those of [46] and [47].
In agreement with [46], we find that eddies act as shelters. These shelters enable the transport of type from the region where it is best adapted to a region where it is less adapted over spatial scales of the order of a few hundred kilometres and timescales of a few months. In that sense, eddies tend to increase diversity at the scale of the region in which they pass through. However, in contrast to [46], our experiments reveal that within eddy cores, diversity is generally less than background conditions, because another important impact of this sheltering effect is to facilitate competitive exclusion. Moreover, in agreement with [47], we find that mesoscale turbulence enhances local coexistence over submesoscale fronts. This increased diversity at fronts can be attributed to two factors: first, the fact that types best adapted to different environmental conditions on either side of fronts are being constantly brought in contact with one another over those fronts, and second, the larger supply of nutrients which allows new types (essentially opportunist types) to grow.
However, our results also suggest that the larger diversity at the local scale evidenced by the studies of [46] and [47] is not necessarily associated with an overall increase of diversity at basin scale, and thus might not be sufficient to explain the paradox of plankton. Indeed, in our experiments, mesoscale turbulence mainly acts to redistribute different plankton types that populate different parts of the basin where different large-scale conditions prevail but does not increase global diversity. This is further highlighted by comparing the simulation presented here with another simulation (presented in reference [26]) where mesoscale turbulence was suppressed, but the large-scale environmental conditions were kept identical. The comparison of the number of types that self-assembled in these two simulations revealed that, with the inclusion of eddies and fronts, the total global number of types present in the model domain remained more or less constant ([26], their fig. 4). We conclude that the total global number of types is set by variations in environmental conditions over basin-wide distances, and that mesoscale turbulence mostly acts to bring into contact populations of adjacent water masses at submesoscale fronts, creating local diversity hot spots and to allow more efficient competitive exclusion in the core of eddies. Our results thus confirm the previous finding that fronts and eddies can increase diversity at the local scale but do not allow us to conclude that mesoscale turbulence can increase diversity globally and thus explain the paradox of plankton.
5. Conclusion
We have used a multi-phytoplankton model embedded into a turbulent flow to show that phytoplankton diversity and composition was shaped by the mesoscale flow in environmental conditions reminiscent of the subtropical and subpolar North Atlantic. Our model results suggest that large-scale environmental conditions exert a strong control on the distribution of types, with mesoscale turbulence acting to stir large-scale niches. They suggest that the phytoplankton diversity landscape varies over temporal and spatial scales that are one order of magnitude smaller than those of the basin-scale environmental conditions. Given that the mesoscale and submesoscale features are rapidly evolving, a practical consequence, when thinking of observations at a fixed station, is that temporal changes in phytoplankton assemblages can either reflect seasonal variations or small-scale horizontal advection. Moreover, this finding explains why any combination of opportunists and gleaners, any level of diversity, can occur in eddies and fronts. Nevertheless, our statistical analysis suggests a tendency for an enhanced proportion of opportunists and larger diversity at fronts, and for lower diversity in the core of retentive eddies. The relatively modest magnitude of this tendency suggests statistically weak biogeochemical feedback of the small-scale heterogeneity in phytoplankton types, though potentially larger in individual features or over longer timescales. Because mixing at fronts occurs on timescale faster than competitive exclusion while retention within eddies can exceed this timescale, an enhancement in diversity is suggested to occur over fronts, and a diminution of diversity within eddies. Importantly, for ecological matters, the total number of types, or total diversity of phytoplankton, is not affected, but the very dynamic and small-scale nature of diversity distribution makes it particularly challenging to estimate from field studies.
These tendencies could only be discriminated on a statistical basis, which suggests that in situ observations in individual features cannot easily be extrapolated. An extremely large number of observations would be necessary, in order to derive statistics similar to those in this model. Remotely sensed [48,49] as well as in situ optical observations [50] offer an appealing framework for this task. The prominent role of stirring of large-scale niches on planktonic diversity further supports the possibility of estimating hotspots of diversity from optical niche heterogeneity, as proposed by [5]. The promising increase in resolution of future altimetry missions (Surface Water and Ocean Topography, https://swot.jpl.nasa.gov/) should enable us to relate these distributions to those of fronts and eddies.
An effect that was not accounted for in this study is how mesoscale turbulence interferes in the interactions between phytoplankton and their grazers. This effect is potentially important as the timescales of phytoplankton loss processes are close to those of mesoscale turbulence. Moreover, observations suggest that mesoscale turbulence might also shape the distribution of zooplankton types [51]. Addressing this question requires a model with more complexity in the description of grazers [52,53] and will be the subject of a subsequent study.
Acknowledgements
M.L. is grateful to the Earth, Atmospheric and Planetary Science Department of MIT for inviting her as a Houghton Lecturer, which enabled her to initiate this work. We are grateful for support from GPDGSO.
Competing interests
We declare we have no competing interests.
Funding
CNES-TOSCA, National Science Foundation (grant no. OCE-1048926 MOBY and grant no. OCE-1434007), Gordon and Betty Moore Foundation.
References
- 1.Laws EA, Landry MR, Barber RT, Campbell L. 2000. Carbon cycling in primary production bottle incubations: inferences from grazing experiments and photosynthetic studies using 14C and 18O in the Arabian Sea. Deep Sea Res. 47, 1339–1352. ( 10.1016/S0967-0645(99)00146-0) [DOI] [Google Scholar]
- 2.Ptacnik R, Solimini AG, Andersen T. 2008. Diversity predicts stability and resource use efficiency in natural phytoplankton communities. Proc. Natl Acad. Sci. USA 105, 5134–5138. ( 10.1073/pnas.0708328105) [DOI] [PMC free article] [PubMed] [Google Scholar]
- 3.Barton AD, Dutkiewicz S, Flierl G, Bragg J, Follows MJ. 2010. Patterns of diversity in marine phytoplankton. Science 327, 1509–1511. ( 10.1126/science.1184961) [DOI] [PubMed] [Google Scholar]
- 4.Chust G, Irigoien X, Chave J, Harris RP. 2012. Latitudinal phytoplankton distribution and the neutral theory of biodiversity. Glob. Ecol. Biogeogr. 22, 531–543. ( 10.1111/geb.12016) [DOI] [Google Scholar]
- 5.De Monte S, Soccodato A, Alvain S, d'Ovidio F. 2013. Can we detect oceanic biodiversity hotspots from space? ISME J. 7, 2054–2056. ( 10.1038/ismej.2013.72) [DOI] [PMC free article] [PubMed] [Google Scholar]
- 6.Mousing EA, Ellegaard M, Richardson K. 2014. Global patterns in phytoplankton community size structure—evidence for a direct temperature effect. Mar. Ecol. Prog. Ser. 497, 25–38. ( 10.3354/meps10583) [DOI] [Google Scholar]
- 7.Sunagawa S, et al. 2015. Structure and function of the global ocean microbiome. Science 348, 1261359 ( 10.1126/science.1261359) [DOI] [PubMed] [Google Scholar]
- 8.Bork P, Bowler C, de Vargas C, Gorsky G, Karsenti E, Wincker P. 2015. Tara oceans studies plankton at planetary scale. Science 348, 873 ( 10.1126/science.aac5605) [DOI] [PubMed] [Google Scholar]
- 9.Gould RW., Jr 1988. Net phytoplankton in a Gulf Stream warm-core ring: species composition, relative abundance, and the chlorophyll maximum layer. Deep Sea Res. A, Oceanogr. Res. Papers 35, 1595–1614. ( 10.1016/0198-0149(88)90105-7) [DOI] [Google Scholar]
- 10.Claustre H, Kerhervé P, Marty JC, Prieur L, Videau C, Hecq JH. 1994. Phytoplankton dynamics associated with a geostrophic front: ecological and biogeochemical implications. J. Mar. Res. 52, 711–742. ( 10.1357/0022240943077000) [DOI] [Google Scholar]
- 11.Allen J, et al. 2005. Diatom carbon export enhanced by silicate upwelling in the northeast Atlantic. Nature 437, 728–732. ( 10.1038/nature03948) [DOI] [PubMed] [Google Scholar]
- 12.McGillicuddy DJ, et al. 2007. Eddy/wind interactions stimulate extraordinary mid-ocean plankton blooms. Science 316, 1021–1026. ( 10.1126/science.1136256) [DOI] [PubMed] [Google Scholar]
- 13.d'Ovidio F, De Monte S, Alvain S, Dandonneau Y, Lévy M. 2010. Fluid dynamical niches of phytoplankton types. Proc. Natl Acad. Sci. USA 107, 18 366–18 370. ( 10.1073/pnas.1004620107) [DOI] [PMC free article] [PubMed] [Google Scholar]
- 14.Peterson TD, Crawford DW, Harrison PJ. 2011. Evolution of the phytoplankton assemblage in a long-lived mesoscale eddy in the eastern Gulf of Alaska. Mar. Ecol. Prog. Ser. 424, 53–73. ( 10.3354/meps08943) [DOI] [Google Scholar]
- 15.Villar E, et al. 2015. Environmental characteristics of Agulhas rings affect interocean plankton transport. Science 348, 1261447 ( 10.1126/science.1261447) [DOI] [PubMed] [Google Scholar]
- 16.Margalef R. 1968. Perspectives in ecological theory. Chicago, IL: University Chicago Press. [Google Scholar]
- 17.Johnson ZI, Zinser ER, Coe A, McNulty NP, Woodward EMS, Chisholm SW. 2006. Niche partitioning among prochlorococcus ecotypes along ocean-scale environmental gradients. Science 311, 1737–1740. ( 10.1126/science.1118052) [DOI] [PubMed] [Google Scholar]
- 18.Thomas MK, Kremer CT, Klausmeier CA, Litchman E. 2012. A global pattern of thermal adaptation in marine phytoplankton. Science 338, 1085–1088. ( 10.1126/science.1224836) [DOI] [PubMed] [Google Scholar]
- 19.Clayton S, Dutkiewicz S, Jahn O, Follows MJ. 2013. Dispersal, eddies, and the diversity of marine phytoplankton. Limnol. Oceanogr. Fluids Environ. 3, 182–197. ( 10.1215/21573689-2373515) [DOI] [Google Scholar]
- 20.Williams RG, Wilson C, Hughes CW. 2007. Ocean and atmosphere storm tracks: the role of eddy vorticity forcing. J. Phys. Oceanogr. 37, 2267–2289. ( 10.1175/JPO3120.1) [DOI] [Google Scholar]
- 21.Lévy M. 2008. The modulation of biological production by oceanic mesoscale turbulence. In Transport and mixing in geophysical flows: ten years after. Lect. Notes Phys vol. 744 (eds Weiss JB, Provenzale A), pp. 219–261. Berlin, Germany: Springer. [Google Scholar]
- 22.Lévy M, Ferrari R, Franks PJS, Martin AP, Rivière P. 2012. Bringing physics to life at the submesoscale. Geophys. Res. Lett. 39, L14602. [Google Scholar]
- 23.McGillicuddy DJ. 2016. Mechanisms of physical–biological–biogeochemical interactions at the oceanic mesoscale. Anu. Rev. Mar. Sci. 8, 13.1–13.36. [DOI] [PubMed] [Google Scholar]
- 24.Laws EA, Falkowski PG, Smith WO, Ducklow H, McCarthy JJ. 2000. Temperature effects on export production in the open ocean. Glob. Biogeol. Cycle 14, 1231–1246. ( 10.1029/1999GB001229) [DOI] [Google Scholar]
- 25.Follows M, Dutkiewicz S, Grant S, Chisholm S. 2007. Emergent biogeography of microbial communities in a model ocean. Science 315, 1843–1846. ( 10.1126/science.1138544) [DOI] [PubMed] [Google Scholar]
- 26.Lévy M, Jahn O, Dutkiewicz S, Follows MJ. 2014. Phytoplankton diversity and community structure affected by oceanic dispersal and mesoscale turbulence. Limnol. Oceanogr. Fluids Environ. 4, 67–84. ( 10.1215/21573689-2768549) [DOI] [Google Scholar]
- 27.Lévy M, Klein P, Tréguier AM, Iovino D, Madec G, Masson S, Takahashi K. 2010. Modifications of gyre circulation by sub-mesoscale physics. Ocean Model. 34, 1–15. ( 10.1016/j.ocemod.2010.04.001) [DOI] [Google Scholar]
- 28.Dutkiewicz S, Follows MJ, Bragg JG. 2009. Modeling the coupling of ocean ecology and biogeochemistry. Glob. Biogeol. Cycle 23, GB4017. [Google Scholar]
- 29.Aksnes DL, Egge JK. 1991. A theoretical model for nutrient uptake in phytoplankton. Mar. Ecol Prog. Ser. Oldendorf. 70, 65–72. ( 10.3354/meps070065) [DOI] [Google Scholar]
- 30.Maranon E, Cermeño P, López Sandoval DC, Rodríguez Ramos T, Sobrino C, Huete Ortega M, Blanco JM, Rodríguez J. 2013. Unimodal size scaling of phytoplankton growth and the size dependence of nutrient uptake and use. Ecol. Lett. 16, 371–379. ( 10.1111/ele.12052) [DOI] [PubMed] [Google Scholar]
- 31.Madec G. 2008. NEMO ocean engine. Note du Pole de modelisation de l'Institut Pierre-Simon Laplace No. 27 1–217. See http://www.nemo-ocean.eu/content/download/21612/97924/file/NEMO_book_3_4.pdf. [Google Scholar]
- 32.Lévy M, Resplandy L, Klein P, Capet X, Iovino D, Ethé C. 2012. Grid degradation of submesoscale resolving ocean models: benefits for offline passive tracer transport. Ocean Model. 48, 1–9. ( 10.1016/j.ocemod.2012.02.004) [DOI] [Google Scholar]
- 33.Marshall J, Hill C, Perelman L, Adcroft A. 1997. Hydrostatic, quasi-hydrostatic, and nonhydrostatic ocean modeling. J. Geophys. Res. 102, 5733–5752. ( 10.1029/96JC02776) [DOI] [Google Scholar]
- 34.Lévy M, Iovino D, Resplandy L, Klein P, Madec G, Tréguier AM, Masson S, Takahashi K. 2012. Large-scale impacts of submesoscale dynamics on phytoplankton: local and remote effects. Ocean Model. 43–44, 77–93. ( 10.1016/j.ocemod.2011.12.003) [DOI] [Google Scholar]
- 35.Vallina SM, Ward BA, Dutkiewicz S, Follows MJ. 2014. Maximal feeding with active prey-switching: a kill-the-winner functional response and its effect on global diversity and biogeography. Prog. Ocean 120, 93–109. ( 10.1016/j.pocean.2013.08.001) [DOI] [Google Scholar]
- 36.Stirling G, Wilsey B. 2001. Empirical relationships between species richness, evenness, and proportional diversity. Am. Nat. 158, 286–299. ( 10.1086/321317) [DOI] [PubMed] [Google Scholar]
- 37.d'Ovidio F, De Monte S, Penna AD, Cotté C, Guinet C. 2013. Ecological implications of eddy retention in the open ocean: a Lagrangian approach. J. Phys. A, Math. Theor. 46, 254023 ( 10.1088/1751-8113/46/25/254023) [DOI] [Google Scholar]
- 38.d'Ovidio F, Isern-Fontanet J, López C, Hernández-García E, García-Ladona E. 2009. Comparison between Eulerian diagnostics and finite-size Lyapunov exponents computed from altimetry in the Algerian basin. Deep Sea Res. I 56, 15–31. [Google Scholar]
- 39.Dandonneau Y, Montel Y, Blanchot J, Giraudeau J, Neveux J. 2006. Temporal variability in phytoplankton pigments, picoplankton and coccolithophores along a transect through the North Atlantic and tropical southwestern Pacific. Deep Sea Res. I 53, 689–712. ( 10.1016/j.dsr.2006.01.002) [DOI] [Google Scholar]
- 40.Alvain S, Moulin C, Dandonneau Y, Loisel H. 2008. Seasonal distribution and succession of dominant phytoplankton groups in the global ocean: a satellite view. Glob. Biogeol. Cycle 22, GB3001. [Google Scholar]
- 41.Lévy M. 2003. Mesoscale variability of phytoplankton and of new production: impact of the large-scale nutrient distribution. J. Geophys. Res. 108, 3358 ( 10.1029/2002JC001577) [DOI] [Google Scholar]
- 42.Klein P, Lapeyre G. 2009. The oceanic vertical pump induced by mesoscale and submesoscale turbulence. Annu. Rev. Mar. Sci. 1, 351–375. ( 10.1146/annurev.marine.010908.163704) [DOI] [PubMed] [Google Scholar]
- 43.Wilkins D, van Sebille E, Rintoul SR, Lauro FM, Cavicchioli R. 2013. Advection shapes southern ocean microbial assemblages independent of distance and environment effects. Nat. Commun. 4, 1–7. ( 10.1038/ncomms3457) [DOI] [PubMed] [Google Scholar]
- 44.Hardin G. 1960. The competitive exclusion principle. Science 131, 1292–1297. ( 10.1126/science.131.3409.1292) [DOI] [PubMed] [Google Scholar]
- 45.Hutchinson GE. 1961. The paradox of the plankton on JSTOR. Am. Nat. 95, 137–145. ( 10.1086/282171) [DOI] [Google Scholar]
- 46.Bracco A, Provenzale A, Scheuring I. 2000. Mesoscale vortices and the paradox of the plankton. Proc. R. Soc. Lond. B 267, 1795–1800. ( 10.1098/rspb.2000.1212) [DOI] [PMC free article] [PubMed] [Google Scholar]
- 47.Perruche C, Rivière P, Lapeyre G, Carton X, Pondaven P. 2011. Effects of surface quasi-geostrophic turbulence on phytoplankton competition and coexistence. J. Mar. Res. 69, 105–135. ( 10.1357/002224011798147606) [DOI] [Google Scholar]
- 48.Alvain S, Moulin C, Dandonneau Y, Bréon FM. 2005. Remote sensing of phytoplankton groups in case 1 waters from global SeaWiFS imagery. Deep Sea Res. I 52, 1989–2004. ( 10.1016/j.dsr.2005.06.015) [DOI] [Google Scholar]
- 49.Uitz J, Claustre H, Griffiths F, Ras J, Garcia N. 2009. A phytoplankton class specific primary production model applied to the Kerguelen Islands region (Southern Ocean). Deep Sea Res. I 56, 541–560. ( 10.1016/j.dsr.2008.11.006) [DOI] [Google Scholar]
- 50.Cetinić I, Perry MJ, D'Asaro E, Briggs N, Poulton N, Sieracki ME, Lee CM. 2015. A simple optical index shows spatial and temporal heterogeneity in phytoplankton community composition during the 2008 North Atlantic bloom experiment. Biogeosciences 12, 2179–2194. ( 10.5194/bg-12-2179-2015) [DOI] [Google Scholar]
- 51.Wiebe PH, Flierl GR. 1983. Euphausiid invasion/dispersal in gulf stream cold-core rings. Mar. Freshw. Res. 34, 625–652. ( 10.1071/MF9830625) [DOI] [Google Scholar]
- 52.Ward BA, Dutkiewicz S, Jahn O, Follows MJ. 2012. A size-structured food-web model for the global ocean. Limnol. Oceanogr. 57, 1877–1891. ( 10.4319/lo.2012.57.6.1877) [DOI] [Google Scholar]
- 53.Taniguchi DAA, Franks PJS, Poulin FJ. 2014. Planktonic biomass size spectra: an emergent property of size-dependent physiological rates, food web dynamics, and nutrient regimes. Mar. Ecol. Prog. Ser. 514, 13–33. ( 10.3354/meps10968) [DOI] [Google Scholar]


