

Abstract
The transcription factor C/EBPα is required for granulocytic differentiation of normal myeloid progenitors and is frequently inactivated in acute myeloid leukemia (AML) cells. Ectopic expression of C/EBPα in AML cells suppresses proliferation and induces differentiation suggesting that restoring C/EBPα expression/activity in AML cells could be therapeutically useful. Unfortunately, current approaches of gene or protein delivery in leukemic cells are unsatisfactory. However, “drug repurposing” is becoming a very attractive strategy to identify potential new uses for existing drugs. In this study, we assessed the biological effects of candidate C/EBPα-mimetics identified by interrogation of the Connectivity Map database. We found that amantadine, an antiviral and anti-Parkinson agent, induced a monocyte-macrophage-like differentiation of HL60, U937, Kasumi-1 myeloid leukemia cell lines, as indicated by morphology and differentiation antigen expression, when used in combination with suboptimal concentration of all trans retinoic acid (ATRA) or Vit D3. The effect of amantadine depends, in part, on increased activity of the vitamin D receptor (VDR), since it induced VDR expression and amantadine-dependent monocyte-macrophage differentiation of HL60 cells was blocked by expression of dominant-negative VDR. These results reveal a new function for amantadine and support the concept that screening of the Connectivity Map database can identify small molecules that mimic the effect of transcription factors required for myelo-monocytic differentiation.
Keywords: cell cycle, differentiationm, leukemia, therapy, transcription factor
Introduction
Acute myeloid leukemia (AML) is a blood cancer characterized by the expansion of transformed myeloid progenitors which exhibit a severe block in their ability to differentiate into mature granulocytes or macrophages; as a result, these cells accumulate inside the bone marrow interfering with normal hematopoiesis.1 The growth advantage and the differentiation arrest of AML cells are thought to be caused by aberrant regulation of distinct genes such as those encoding for a constitutively active tyrosine kinase and a transcription factor.2,3
In particular, lineage-specific transcription factors are mutated or functionally inactivated in AML, suggesting a pathogenic link with the aberrant differentiation of AML cells.4
One such gene, the transcription factor C/EBPα, is required for granulocytic differentiation of normal myeloid progenitors and is frequently inactivated in AML cells.5
Structural and non-structural mechanisms are responsible for inactivation of C/EBPα in AML cells. Mutations of the C/EBPα gene are detected in approximately 10% of AML patients and fall into 2 major categories: i) those that abolish the expression of the p42 protein while retaining expression of p30 (an isoform lacking the N-terminal transactivation domain); and ii) insertions/deletions near the basic region (BR)-leucine zipper (LZ) domain that impair DNA binding activity.6 The importance of the ratio between the p42 and the p30 isoforms is demonstrated by the observation that the selective knockout of p42 in mice retaining expression of the p30 isoform leads to AML formation with high penetrance,7 while restoring p42 expression suppressed leukemogenesis.8
Expression of C/EBPα can be negatively regulated at the transcriptional level by promoter hypermethylation or by direct transcriptional repression by the AML1-ETO oncoprotein in AML patients with the 8;21 translocation.9
C/EBPα is also inactivated post-transcriptionally by the mRNA-binding protein calreticulin that inhibits C/EBPα mRNA translation in AML patients with the 3;21 translocation or inv(16) or post-translationally via serine 21 phosphorylation in AML patients with the FLT3-ITD mutation.10
Restoring C/EBPα expression/activity could be an effective strategy to eradicate of AML cells by inhibition of proliferation and induction of differentiation. Different approaches such as gene-therapy based on lentiviral vectors, fusion proteins engineered to pass through cellular membranes,11 nanoparticles that target a TAT-bound protein to specific cell subsets via antibody binding to surface markers12 are currently under investigation, but the efficacy of these strategies is unclear. For AML treatment, recent studies have focused on the development of differentiation therapies using ATRA combined with epigenetic modifiers13-17; this approach is based on findings indicating that epigenetic mechanisms, including DNA methylation, histone methylation and acetylation, are involved in the repression of RARα expression in non-APL AML cells.18,19
The Connectivity Map database (www.broadinstitute.org/cmap/) was generated at the Broad Institute of MIT and Harvard and it was made available in 2006.20 The first version (Build 01) was built by assessing the effects of 164 small-molecule perturbagenes (FDA-approved drugs and nondrug bioactive “tool” compounds) on the transcriptome of 5 cancer cell lines. Subsequently, this database was expanded to 1,309 FDA-approved small molecules generating 6,100 gene expression profiles from 7,056 microarray chips.
Given the large amount of collected data, the real challenge for an optimal use of the cMap is data analysis. In the last few years, uploaded data were re-elaborated by different groups in order to make such data more usable and different version of the cMap such as MANTRA,21,22 sscMap,23 cudaMap24 were developed.
Several studies have demonstrated that interrogation of the Connectivity Map database could provide a powerful tool to elucidate the mechanism of action of small molecules20,25,26 or to reveal new functional connections with known compounds.27,28 However, the most important potential application of cMap analysis is “drug repurposing,” namely the discovery that known drugs may have entirely new therapeutic targets. Examples of “drug repurposing” were reported in acute lymphoid leukemia (ALL),26 skeletal muscle atrophy (SMA),29 inflammatory bowel disease (IBD),30 breast cancer,31 and hepatocellular carcinoma.32
In the present study, we interrogated the cMap database to identify small molecules that may mimic the biological effects of the transcription factor C/EBPα in AML cells.
Results
Identification of candidate C/EBPα-mimetics by interrogation of the Connectivity Map database
To identify small molecules (“perturbagenes”) that may mimic the biological effects induced by ectopic expression of C/EBPα in myeloid leukemia cells, we queried the Connectivity Map database with a subset of C/EBPα-regulated genes (“C/EBPα gene signature”) identified through transcriptional profiling of K562 cells expressing a tamoxifen-regulated C/EBPα-ER chimeric protein.33
In particular, the Connectivity Map database was queried with a subset of up-regulated and down-regulated genes representing those associated with myeloid differentiation (“up-tags”) or inhibition of cell proliferation (“down-tags”) (Table 1). Using this approach, we identified 8 compounds displaying positive connectivity with the “C/EBPα gene signature” (Table 2).
Table 1.
43-gene signature of differentially expressed genes in K562 cells ectopically expressing the C/EBPα-ER chimera. Upregulated (left column) and down-regulated (right column) selected genes are listed in alphabetical order
| Up-regulated genes | Downregulated genes |
|---|---|
| Acyl-CoA synthetase long-chain family member 1 | Ankyrin 1 |
| Annexin A1 | CD69 |
| C/EBPα | Cyclin D1 |
| C/EBPγ | Cyclin D2 |
| C/EBPδ | Cyclin-dependent kinase 6 (CDK 6) |
| C/EBPε | Cyclin-dependent kinase inhibitor 1C (CDKN1C) |
| CD64 | GATA2 |
| Chitinase-3-like protein 1 (CHI3L1) | Growth factor indipendent 1B (GFI-1 B) |
| CXCR4 | HOXC4 |
| Cyclin G2 | Interleukin-10α receptor (IL10α-r) |
| FUT4 | Interleukin-2 receptor γ (IL2-rG) |
| GCSF-receptor (GCSF-r) | JUN D |
| Interleukin-1 receptor (IL1-r) | Keratin 19 (K19) |
| Interleukin-4 receptor (IL4-r) | KIT |
| Interleukin-6 receptor (IL6-r) | Leptin receptor (LEP-r) |
| Matrxi metalloprotease 8 (MMP8) | Myc |
| Monocyte to macrophage differentiation-associated | Perforin 1 |
| Myeloperoxidase (MPO) | PIM2 |
| Neutrophil elastase (ELANE) | STAT5 A |
| Plasminogen activator, urokinase receptor (PLAUR) | T cell receptor β constant 1 |
| S100 calcium binding protein A8 | |
| Secretory leukocyte peptidase inhibitor (SLP1) | |
| TNFα-induced protein 6 (TNFAIP6) |
Table 2.
Rank-ordered list of compounds after cMap query and post-processed selection. The table shows the dose used to generate the signature of differentially expressed genes for every small-molecule, the connectivity score and its up-score and down-score components
| cMap molecule name | cMap dose | connectivity score | up-score | down-score |
|---|---|---|---|---|
| diperodon | 9 µM | 0.91 | 0.364 | −0.249 |
| tranylcypromine (PCPA) | 24 µM | 0.905 | 0.331 | −0.279 |
| rolipram | 15 µM | 0.887 | 0.33 | −0.267 |
| griseofulvin | 11 µM | 0.884 | 0.357 | −0.239 |
| pilocarpine | 15 µM | 0.853 | 0.352 | −0.222 |
| kawain | 17 µM | 0.821 | 0.416 | −0.136 |
| amantadine | 10 µM | 0.81 | 0.291 | −0.254 |
| tretinoin (all-trasn retinoic acid, ATRA) | 1 µM | 0.807 | 0.267 | −0.277 |
Since little or no information is available on the effective dose of most compounds, different drug concentrations were tested in order to identify an appropriate dose (neither toxic nor ineffective) for each compound. Initially, cells were treated with the drug concentration utilized to generate the Connectivity Map's data (Table 2). Proliferation was assessed after treatment for 24, 48, 72 hours and 6 days; since most compounds had no appreciable effects on morphology, they were used at concentrations higher of those utilized to generate the cMap database (Fig. S1). Based on the results of these assays, rolipram and pilocarpine were excluded from further studies because they had no effect even at a very high concentration; we excluded also kawain because morphological analysis (data not shown) showed that growth inhibition was due to cytotoxicity. Finally, griseofulvin was also excluded because at the concentration reported in the cMap database, it strongly inhibited proliferation. Morphological analysis (data not shown) revealed that the effect was due to a massive block of cytokinesis. However, at lower concentrations, there was neither inhibition of proliferation nor block of cytokinesis.
Moreover, ATRA and PCPA, 2 additional drugs identified by our screening, were not further analyzed because it is well established that they promote granulocytic differentiation in leukemic cells.34-37
In summary, after these analyses, diperodon, a local anesthetic, and amantadine, an anti-viral and anti-Parkinson drug, were selected for further studies. On the assumption that, like PCPA,38 diperodon and amantadine may not be able to induce differentiation when used alone, experiments were also performed upon co-treatment with ATRA, used at a suboptimal concentration insufficient for granulocytic differentiation.
Diperodon treatment inhibits proliferation but has modest effects on differentiation of HL60 cells
After preliminary experiments, we selected 40μM as the optimal diperodon concentration for treatment of HL60 cells. Therefore, proliferation and differentiation of HL60 cells was assessed after treatment with ATRA alone (10nM), diperodon alone (40μM) or the ATRA-diperodon combination (10nM and 40μM, respectively). Treatment with ATRA alone slightly reduced proliferation of HL60 cells, whereas treatment with diperodon alone or with the ATRA-diperodon combination was much more effective; in particular, co-treated cells exhibited a 60% decrease of proliferation at day 6 (Fig. 1A).
Figure 1.

Effect of diperodon, ATRA, or the diperodon-ATRA combination on the proliferation and differentiation of HL60 cells. Proliferation (A) and differentiation marker expression (CD11b,CD15, CD14, and CD163) by flow cytometry analysis (B–E), of HL60 cells treated with diperodon, ATRA or the diperodon-ATRA combination. Data are reported as mean ± SD of three independent experiments. Statistical significance was calculated using unpaired, 2-tailed Student's t test and considered significant with p < 0 ,05. “NS” indicates not statistically significant differences.
To assess if reduced proliferation was associated with induction of differentiation, the immunophenotype of ATRA and/or diperodon-treated cells was evaluated at 3 and 6 d post-treatment by staining with anti-CD11b, anti-CD14, anti-CD15 and anti-CD163 antibodies which detect common markers of granulocytic and monocytic differentiation. At day 3, we observed a statistically significant increase in CD11b levels in cells co-treated with ATRA + diperodon compared to untreated cells or to cells treated with ATRA or diperodon only. Percentage of CD11b positivity and differences between treatments were similar at day 6 (Fig. 1B; Fig. S2A).
Compared to untreated cells or cells treated with ATRA alone, treatment with diperodon, either alone or in combination with ATRA, led to higher CD15 expression both at day 3 and day 6; however, CD15+ positivity was only approximately 20% and most changes are not statistically significant (Fig. 1C, Fig. S2B). CD14 positivity was very similar to that of CD15, exhibiting a slight increase in diperodon-treated cells, at both time points. However, CD14 levels were very low and the differences were not significant except for the ATRA + diperodon versus the diperodon treatment at day 3 (Fig. 1D; Fig. S2C).
Finally, we also assessed the expression of the monocytic differentiation antigen CD163 (Fig. 1E; Fig. S2D). At day 3, CD163 levels were slightly up regulated by treatment with diperodon only, or upon co-treatment with ATRA; however, the levels of expression were quite low. At day 6, the various treatments did not induce significant changes in CD163 levels.
To further characterize the differentiation of diperodon-treated HL60 cells, we assessed the expression of CD11b, CD14 and CD163 by real-time Q-PCR. In the case of CD11b, mRNA levels do not correlate with cytofluorimetric values because the highest expression of CD11b mRNA was detected in cells treated for 72 h with ATRA only (Fig. 2A), while levels of the surface protein were higher in cells co-treated with ATRA + diperodon. Conversely, CD14 mRNA levels were higher in diperodon-treated cells, in good agreement with flow cytometry data (Fig. 2B). Likewise, expression of CD163 was also induced by treatment with diperodon only (Fig. 2C).
Figure 2.
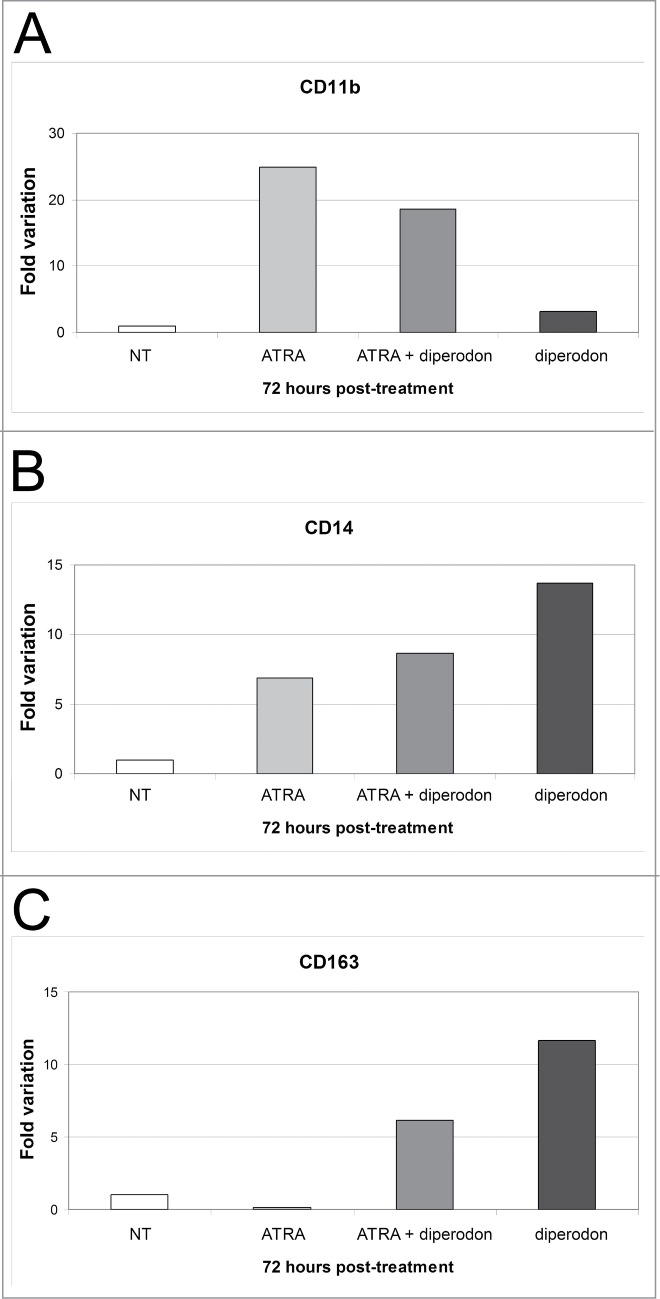
Effect of diperodon, ATRA, or the diperodon-ATRA combination on mono-macrophage differentiation marker expression in HL60 cells. (A–C) mRNA levels of CD11b, CD14 and CD163 detected by real time PCR in HL60 cells treated (72 h) with diperodon, ATRA or the diperodon-ATRA combination. Expression of the housekeeping gene HPRT was used as internal control. Results are reported as normalized-fold variation over untreated cells (NT) taken as 1. Graphs are representative of 3 independent experiments.
The differentiation-inducing effect of a compound is best evaluated by morphological analysis; thus, we assessed the morphology of May-Grünwald-Giemsa-stained cytospins of treated HL60 cells. At day 6, ATRA-treated cells maintained a blast-like morphology with some metamyelocytes and rare band cells; this result was expected because cells were treated with a concentration of ATRA 100-fold lower than the standard concentration used to induce granulocytic differentiation. Cells grown in presence of diperodon only showed an increased cytoplasm but did not display hallmarks of differentiation. In contrast, cells treated with ATRA + diperodon exhibited a heterogeneous morphology characterized by increased cytoplasm and bean-shaped nuclei; however, the morphology did not allow a clear distinction between monocyte-macrophage- or metamyelocyte-like cells and a large number of undifferentiated blasts were still present (Fig. 3A).
Figure 3.
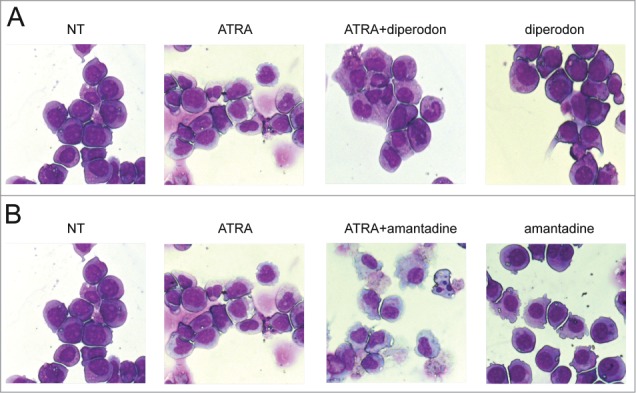
Morphology of of HL60 cells treated with diperodon, amantadine, ATRA or the diperodon-ATRA or the amantadine-ATRA combination in HL60 cells. Light microscopy images of May–Grünwald-Giemsa stained HL60 cells treated for 6 d with diperodon, ATRA, or the diperodon-ATRA combination (A) or with amantadine, ATRA, or the amantadine-ATRA combination (B). Original magnification 40×.
In summary, diperodon is unable induce terminal differentiation as indicated by morphological analyses; however, it appears to have a partial effect based on changes in the expression of some monocyte/macrophage differentiation markers.
Treatment with amantadine promotes the monocyte-macrophage-like differentiation of HL60 cells
Preliminary results indicated that amantadine used at a concentration of 200µM had cytostatic but not cytotoxic effects. Thus, HL60 cells were cultured for 6 d in presence of amantadine (200µM), ATRA (10nM), or the combination ATRA-amantadine (10nM and 200μM, respectively). Compared to untreated cells, all 3 treatments caused a marked growth inhibition. At day 3 post-treatment, there was no difference in the number of cells cultured in the presence of ATRA + amantadine or amantadine alone. By contrast, at day 6, the ATRA-amantadine co-treatment had a clear cytotoxic effect with cell counts lower of those at day 0 (Fig. 4A).
Figure 4.
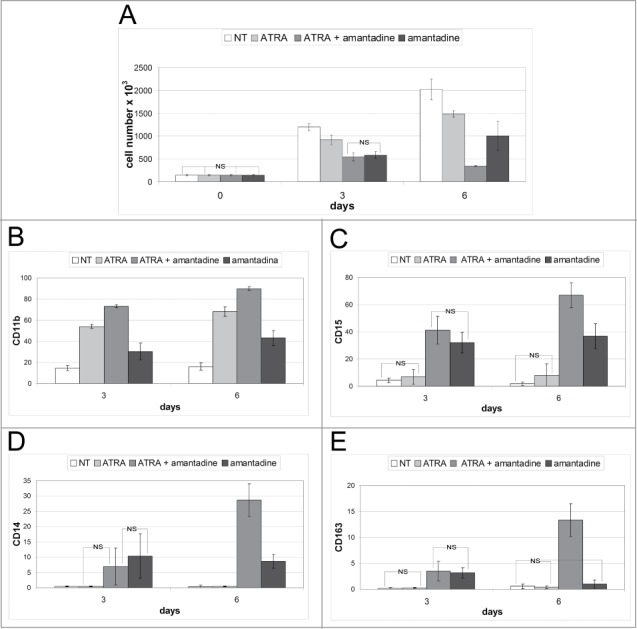
Effect of amantadine, ATRA, or the amantadine-ATRA combination on the proliferation and differentiation of HL60 cells. Proliferation (A) and differentiation marker expression (CD11b,CD15, CD14, and CD163) by flow cytometry analysis (B–E), of HL60 cells treated with amantadine, ATRA or the amantadine-ATRA combination. Data are reported as mean ± SD of three independent experiments. Statistical significance was calculated using unpaired, 2-tailed Student's t test and considered significant with P < 0 ,05. “NS” indicates not statistically significant differences.
To assess if these effects on cell proliferation correlated with induction of terminal differentiation, we evaluated the immunophenotype of drug-treated cells. Thus, 3 and 6 d after treatment, cells were tested for expression of the surface markers CD11b, CD15, CD14 and CD163. As expected, treatment with ATRA alone induced a marked increase in CD11b positivity, at day 3 and 6, but the co-treatment further increased the number of cells expressing this marker (approximately 20% at both time-points) (Fig. 4B; Fig. S3A). Expression of CD15 was upregulated only in cells treated with amantadine, alone or with ATRA; in particular, co-treated cells exhibited a marked increase in CD15 levels at day 6 (Fig. 4C; Fig. S3B). The trend of CD14 positivity was similar to that of CD15: CD14 levels were barely detectable in untreated and ATRA-treated cells, while treatment with amantadine, alone or with ATRA, induced an increase in positivity at 3 and 6 d However, the co-treatment induced a marked increase in CD14 surface levels only at day 6 (Fig. 4D; Fig. S3C). Expression of the CD163 antigen was barely detectable in untreated and ATRA-treated cells while treatment with amantadine, with or without ATRA, caused a slight increase at day 3. By contrast, expression of CD163 was strongly induced at day 6 by the ATRA + amantadine co-treatment (Fig. 4E; Fig. S3D).
The effects of amantadine were further investigated by assessing CD11b, CD14 and CD163 mRNA levels 3 d post-treatment. Consistent with flow cytometry data, CD11b mRNA levels were up-regulated in cells co-treated with ATRA and amantadine and, to a lesser extent, in cells treated with ATRA only. Compared to untreated cells, even cells treated with amantadine only displayed enhanced expression of CD11b, but the relative increase is considerably lower than that induced by the other treatments (Fig. 5A). Expression of CD14 mRNA was also consistent with cytofluorimetric data: treatment with amantadine only induced an increase in CD14 mRNA levels but the increase was higher in the co-treated samples (Fig. 5B). Expression of CD163 mRNA was low in untreated and ATRA-treated cells; by contrast, such levels were markedly upregulated in cells treated with amantadine (alone or with ATRA) (Fig. 5C). Once again, the co-treatment with ATRA was more effective than amantadine only in inducing the increase in CD163 expression.
Figure 5.
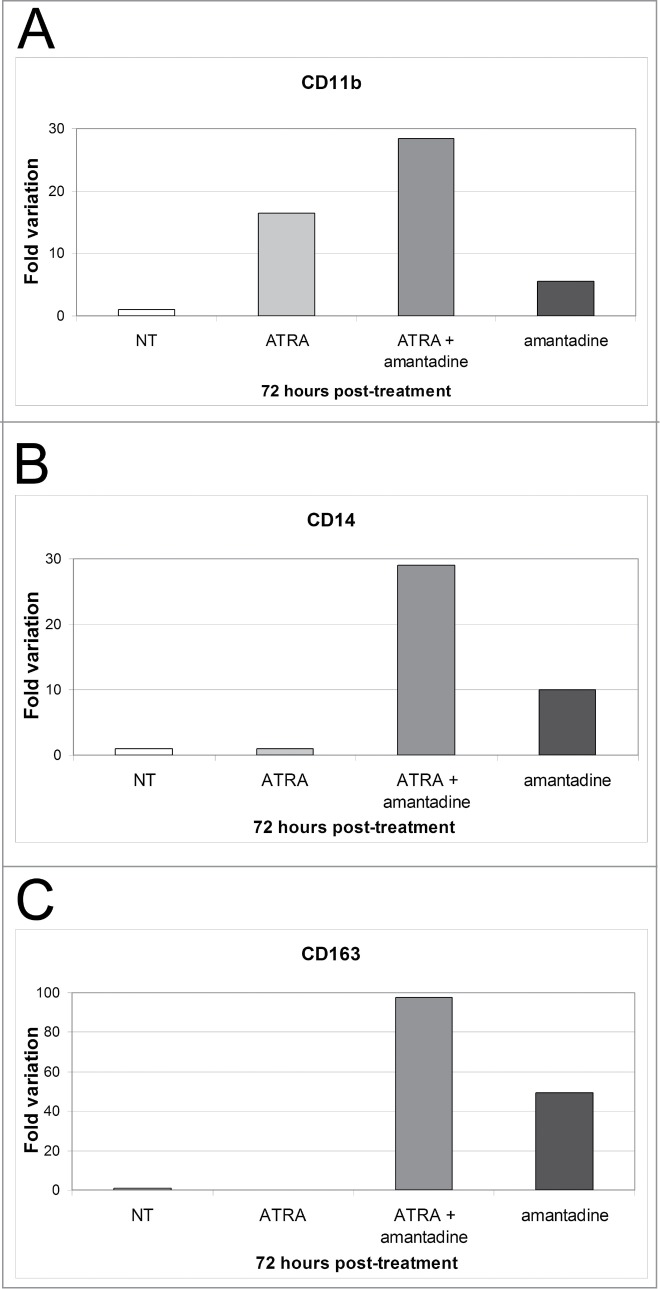
Effect of amantadine, ATRA, or the amantadine-ATRA combination on mono-macrophage differentiation marker expression in HL60 cells. (A–C) mRNA levels of CD11b, CD14 and CD163 detected by real time PCR in HL-60 cells treated (72 h) with amantadine, ATRA or the amantadine-ATRA combination. Expression of the housekeeping gene HPRT was used as internal control. Results are reported as normalized-fold variation over untreated cells (NT) taken as 1. Graphs are representative of 3 independent experiments.
To confirm that treatment with amantadine induced a monocyte-macrophage-like differentiation, cell morphology was evaluated by May–Grünwald-Giemsa staining of cytospin preparations (Fig. 3B). Cells grown in presence of amantadine only displayed a non-uniform morphology characterized by the presence of leukemic blasts and of monocyte-macrophage-shaped cells (approximately 20 and 25% in each field at day 3 and 6, respectively). In sharp contrast, cells co-treated with ATRA and amantadine exhibited a uniform morphology characterized by the presence of macrophage-shaped cells (approximately 50 and 95% in each field at day 3 and 6, respectively), single or in aggregates, with features of apoptosis such as pyknotic nuclei.
Effects of amantadine treatment on the cell cycle of HL60 cells
The effects of amantadine on the cell cycle of HL60 cells were also evaluated. DNA-content analysis (Supplementary Fig. 4A) revealed that, at 48 hours, co-treatment of ATRA and amantadine induced a 15% increase in G1 phase cells and a 18% decrease in S phase cells, compared to untreated cells. These differences were even more evident at 72 hours, and were confirmed by 5′-Bromodeoxyuridine (BrdU) labeling (Fig. S4C). Of interest, amantadine alone induced a significant increase in the number of G1 phase cells and reduced the number of S phase cells during the first 3 d of treatment; at these time points treatment with ATRA alone was much less effective.
Finally, apoptotic, subG1 cells were also detected at day 6, but only in the co-treated samples; this finding was confirmed by Annexin V staining (Fig. S4B).
Treatment with amantadine induces an increase in the expression of Vitamin D receptor (VDR), a master regulator of monocytic differentiation
To investigate mechanisms potentially responsible for the amantadine-dependent induction of monocytic differentiation, we analyzed the expression of PU.1 and VDR, 2 transcription factors with essential roles in monocytic differentiation.
First, we assessed levels of PU.1 mRNA at 24, 48 and 72 hours post-treatment (Fig. 6A).The ATRA-amantadine co-treatment significantly enhanced PU.1 mRNA expression, both at 48 and 72h; however, the levels of the protein did not change at day 3 or even at day 6 post-treatment (Fig. 6C). These findings were confirmed by densitometric analysis which shows no statistically significant differences between the various treatments, at any time point (Fig. 6E).
Figure 6.

Effect of amantadine, ATRA, or the amantadine-ATRA combination on PU.1 and VDR expression in HL60 cells. Levels of PU.1 and VDR mRNA (A, B) or protein (C, D) detected by real time PCR and western blotting, respectively, in untreated or drug-treated HL-60 cells; (E, F) Densitometric analysis from 2 combined experiments. Expression of Grb2 was detected as loading control. Statistical significance was calculated using unpaired, 2-tailed Student's t test and considered significant with p < 00.05. “NS” indicates not statistically significant differences.
By contrast, treatment with amantadine, alone or with ATRA, induced an increase in VDR levels. In particular, expression of VDR mRNA is significantly increased at 72 hours in cells co-treated with ATRA and amantadine (Fig. 6B). Instead, increased expression of VDR protein is not only detected in cells treated with both compounds but also in cells treated with amantadine only for 3 or 6 d (Fig. 6D and F).
To determine whether expression of a functional VDR is required for the monocyte-macrophage-like differentiation induced by amantadine, we generated 2 derivative HL60 cell lines: one expressing a truncated version of the VDR lacking the AF2 transactivation domain (dominant negative VDR) and one carrying only the empty vector (LXIΔN) (Fig. 7A). The truncated VDR acts as a dominant negative of the endogenous VDR blocking its activity, as previously shown in the U937 cell line by Gemelli and colleagues.38
Figure 7.
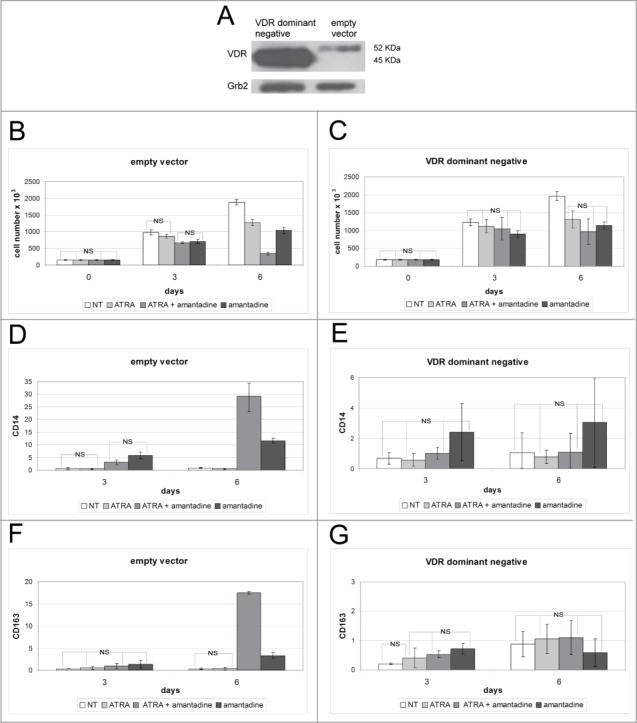
Effect of amantadine, ATRA, or the amantadine-ATRA combination on the proliferation and differentiation of empty vector-transduced or dominant negative VDR-expressing HL60 cells. Western blot (A) of VDR expression (endogenous or dominant-negative VDR) in HL60 cells transduced with the empty vector or with dominant-negative VDR. Levels of Grb2 were measured as loading control. Proliferation (B, C) and differentiation marker expression (CD14 and CD163) by flow cytometry analysis (D–G), of empty vector-transduced (B, D, E) or dominant -negative VDR-expressing (C, E, F) HL-60 cells treated with amantadine, ATRA or the amantadine-ATRA combination. Data are reported as mean ± SD of three independent experiments. Statistical significance was calculated by unpaired, 2-tailed Student's t test and considered significant with p < 0 ,05. “NS” indicates not statistically significant differences.
Both derivative HL60 cells lines were left untreated or cultured for 6 d in presence of amantadine (200µM), ATRA (10nM), or the combination ATRA-amantadine (10nM and 200μM, respectively). Upon treatment for 3 or 6 days, empty vector-transduced cells exhibited the expected decrease in cell number (Fig. 7B). By contrast, cells over-expressing the dominant-negative VDR showed a slight, but not statistically significant, decrease in cell proliferation only at day 6 (Fig. 7C).
Flow cytometry analysis of HL60 derivative cell lines revealed that levels of the monocyte/macrophage surface antigens CD14 and CD163 increased, especially at day 6, upon co-treatment with ATRA and amantadine or treatment with amantadine only of empty vector-transduced cells (Fig. 7D and D; Fig. S5A and C). Such an increase was blocked in HL60 cells expressing dominant-negative VDR (Fig. 7F and G, Fig. S5B and D).
These results demonstrate that blocking the activity of VDR strongly inhibits the differentiation-promoting effect of amantadine.
Treatment with amantadine enhances vitamin D3-dependent monocyte/macrophage differentiation of U937 and Kasumi-1 cells
The effect of amantadine as promoter of monocytic differentiation was not limited to the model of ATRA-treated HL60 cells; in the model of vitamin D3-induced monocytic differentiation of U937 cells, co-treatment with vitamin D3 and amantadine enhanced the expression of CD11b, CD14, and CD163, compared to treatment with vitamin D3 or amantadine only (Fig. 8A–D; Fig. 6A–C). Such an effect correlated with an increase in VDR expression which was more evident in U937 cells co-treated with vitamin D3 and amantadine for 6 d (Fig. 8E).
Figure 8.
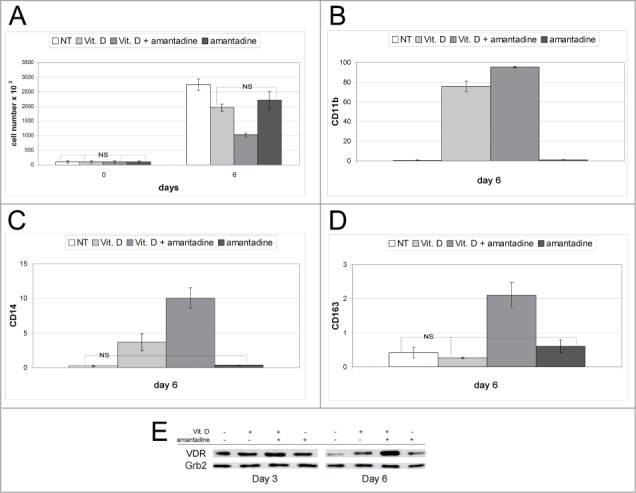
Effect of amantadine, Vitamin D3, or the amantadine-Vitamin D3 combination on proliferation, differentiation, and VDR expression of U937 cells. Proliferation (A), flow cytometry analysis of differentiation marker expression (CD11b, CD14, and CD163) (B–D), and VDR levels (E) of U937 treated with amantadine, Vitamin D3 or the amantadine-Vitamin D3 combination. Data are reported as mean ± SD of three experiments. Statistical significance was calculated using unpaired, 2-tailed Student's t test and considered significant with p < 0 ,05. “NS” indicates not statistically significant differences. In (E), expression of Grb2 was monitored as loading control.
We also evaluated the effects of amantadine in the Kasumi-1 cell line which is another widely used model of acute myeloblastic leukemia. Although treatment with amantadine did not induce an increase in the expression of CD163 (Fig. S7D and H), levels of CD11b and especially CD14 were strongly upregulated by the vitamin D3 and amantadine co-treatment (Fig. S7B, C, F, G). Finally, the co-treatment also induced inhibition of proliferation and enhanced expression of VDR (Fig. S7A and E). Collectively, these data indicate that amantadine cooperates with vitamin D3 in promoting the monocytic differentiation of Kasumi-1 cells.
Discussion
In this study, we interrogated the Connectivity Map database with a gene signature of genes up-regulated and downregulated upon activation of C/EBPα in K562 cells to identify bioactive molecules potentially mimicking the biological effects of C/EBPα. The rationale behind this approach rests on the assumption that compounds that mimic the effects of C/EBPα might have therapeutic effects in AML, since C/EBPα inhibits cell proliferation and is a potent inducer of differentiation upon ectopic expression in myeloid blast crisis CML cells.39,40
Moreover, C/EBPα is structurally inactivated or non-functional in most AML subtypes,6,9-11 further reinforcing the notion that “C/EBPα mimetics” may have anti-leukemia effects.
Interrogation of the Connectivity Map database has been utilized to identify small molecules that modulate drug-induced apoptosis or enzyme inhibitors26-28 as potential anti-cancer agents, but has not been used to identify compounds that mimic the activity of a transcription factor and, doing so, exert anti-leukemia effects.
In support of the validity of our approach, we identified ATRA and tranylcypromine (PCPA) as potential “C/EBPα mimetics;” ATRA is a well known inducer of promyelocytic leukemia differentiation34 and PCPA is a histone H3K4 and K9 demethylase inhibitor that collaborates with ATRA in promoting differentiation of AML cells.41 Thus, it is not surprising that these agents may activate a gene expression program similar to that induced by C/EBPα.
In addition to ATRA and PCPA, we identified other compounds which we did not expect that may function as “C/EBPα mimetics” based on their known mechanism(s) of action.
We selected for further studies diperodon, a local anesthetic, and amantadine, an antiviral and anti-Parkinson drug. Both drugs failed to induce C/EBPα expression (not shown), indicating that any “C/EBPα-mimetic” effect would not be due to increased C/EBPα levels.
However, set-wise comparisons and GSEA revealed statistically significant similarities in the genes regulated by C/EBPα and amantadine treatment. In particular, the similarity was more evident in the upregulated genes; in this geneset, approximately 10% (including established C/EBPα targets such as neutrophilic elastase and IL4-R) showed at least a 1.fold5- increase (Fig. S8).
Treatment with diperodon inhibited HL60 cell proliferation but had only a modest and transient effect on the expression of the monocyte/macrophage differentiation markers CD14 and CD163 (Figs. 1 and 2; Fig. S2); not surprisingly, these changes correlated only with subtle morphological alterations such as an enlarged cytoplasm and a segmented or peripheral nucleus in a minority of cells, especially after treatment with the diperodon/ATRA combination (Fig. 3A).
By contrast, the effects induced by treatment with amantadine were much more pronounced, especially upon co-treatment with ATRA. In particular, HL60 cells treated with the ATRA/amantadine combination proliferated less than untreated cells or those treated with amantadine or ATRA only (Fig. 4, Fig. S3). Moreover, expression of monocyte/macrophage differentiation antigens was markedly increased in amantadine/ATRA co-treated cells (Figs. 5 and 6) and such an increase correlated with the appearance of clear morphological features of monocyte/macrophage differentiation (Fig. 3B).
Of greater interest, treatment with amantadine led to an increase in the expression of VDR and such an increase appears to be biologically relevant since monocyte/macrophage differentiation induced by co-treatment with ATRA and amantadine was completely blocked by expression of a dominant-negative VDR lacking the transactivation domain (Fig. 7; Fig. S5).
Amantadine is an FDA-approved anti-viral and anti-Parkinson drug; one of its mechanisms of activity is to function as weak inhibitor of the NMDA-type glutamate receptor.42 However, this mechanism of action is unlikely to explain the differentiation-promoting effects described here.
A recent study has shown that treatment with amantadine enhanced the cytotoxic effects of the BCR-ABL tyrosine kinase inhibitor imatinib via increased release of calcium from the endoplasmic reticulum (ER) by inhibition of the influx transporter hOCT1.43 However, ER stress appears more likely to impair than to promote macrophage differentiation.44
Our findings suggest that the differentiation-promoting effects of amantandine may depend on its ability to induce an increase in the expression of VDR.
The existence of ligand independent activation has been clearly demonstrated for a number of nuclear receptors, including VDR,45 suggesting that this type of regulation could probably play a role in the monocyte/macrophage differentiation induced by amantadine. In support to this hypothesis, vitamin D3-independent activation of VDR has been sometimes observed in association with an increase of its expression,46 exactly as in our studies.
There is evidence that, as shown for other nuclear receptors, chemical compounds unrelated to vitamin D3 can also bind the VDR, although at considerably higher concentrations, mimicking its biological effect.47 Therefore, a molecular docking analysis, carried out by a computational approach and validated through a competitive binding assay, could determine if there is a direct interaction between amantadine and VDR.
In summary, we have identified 2 compounds with known mechanisms of action unpredicted to affect myeloid differentiation that cooperate with ATRA and appear to re-direct its transcription-regulatory effect toward the induction of monocyte/macrophage differentiation. Although we did not identify yet compounds that mimic exactly the biological effects of C/EBPα, further interrogation of the Connectivity Map database seems a promising approach to identify such agents.
Materials and Methods
Connectivity Map analysis
The Connectivity Map was queried with a “C/EBPα signature” obtained by transcription profiling of C/EBPα-ER-expressing K562 cells.33 As described by Lamb and colleagues,20 a nonparametric, rank-based pattern matching strategy, based on Kolmogorov-Smirnov statistics, was used in the calculation of the Connectivity Score for each drug/small-molecule in the database.
Data were evaluated according to the following criteria: i) we considered only data generated by treatment of the HL60 cell line, which is a widely used model of all trans retinoic acid (ATRA)-induced differentiation of acute promyelocytic leukemia cells; ii) we selected only compounds with connectivity scores between +0,8 and +1; as, to date, there is no statistical method that can correlate the connectivity score with biological relevance, we arbitrarily set the threshold at +0,8 in order to investigate a reasonable number of compounds; iii) we focused on the up-score of the compounds selected so far. A high positive up-score (a component of the connectivity score) indicates that the genes up-regulated by the corresponding molecule strongly correlate with those upregulated in the query signature (up-tag list). Then, we set an arbitrary threshold of +0.29 ad re-ordered the select compounds based on their up-score. Finally, we analyzed the list of up-regulated genes modulated by each compound that passed these selection criteria. For each gene, we considered the parameters “score” and “amplitude” which, approximately, indicate how much a gene is upregulated and excluded perturbagenes for which the up-regulated genes have low or negative values of “score” and “amplitude.”
Set-wise and GSEA comparisons
The HL60 amantadine and diperodon cMap microarray profiles were compared with C/EBPα-induced genes in 2 ways, first using a set wise comparison to test for similarity among the topmost upregulated genes, and second using gene set enrichment analysis (GSEA), which is sensitive to subtle but concerted changes in gene expression. For compatibility between the cmap profiles, generated using the Affymetrix GeneChip HG-U133A microarrays, and the C/EBPα data, generated on the Affymetrix GeneChip HG-U133plus2 platform, analysis was performed on the 22283 probesets common between the 2 platforms. C/EBPα-induced genes were defined with minimum 1.fold5- change and differential expression P-value cutoff of 0.05. While these limits define a set of 663 unique genes when limited to the 22283 HG-133A probesets, the cmap data is represented as ranked lists so equivalent fold changes and P-values cannot be applied. Instead, gene subsets of roughly equivalent size were defined for set-wise comparisons, using the top 500 ranked genes in both the amantadine and diperodon profiles. Overlap between C/EBPα-induced genes and the 500 most upregulated genes in the amantadine and diperodon profiles was visualized using Venn diagrams and tested for significance using the hypergeometric P-value. GSEA was then used to evaluate the similarity between the C/EBPα-induced gene signature and the amantadine and diperodon profiles in a different manner, using the entire ranked list of HGU133A probesets from the cmap data to evaluate the positive enrichment of C/EBPα-induced genes along those ranked lists. GSEA was performed using the “classic” enrichment statistic, which is most suitable for the cmap ranked data, consisting of integers from 1 to 22283. Normalized enrichment scores and P-values were generated by GSEA as previously described.48
Cell culture and drugs
U93 and Kasumi-1 cell lines and parental and derivative HL60 cell lines were cultured in RPMI 1640 supplemented with 100 U/ml penicillin and 0,1 mg/ml streptomycin (Euroclone S.p.A, Milan, Italy), 10% FBS (Sigma-Aldrich, Oakville, ON, Canada). Derivative HL60 cell lines (carrying the VDR dominant-negative LVDRΔAF2IΔN plasmid and defined “dominant negative VDR;” or the empty vector plasmid LXIΔN and defined as “empty vector”) were established as described.38
Diperodon, rolipram, griseofulvin, pilocarpine, amantadine, ATRA and 1,25(OH)2D3 (Vitamin D3) were purchased from Sigma-Aldrich (Saint Louis, MO, USA) and stored as indicated by the manufacturer. Kawain was purchased from Santa Cruz Biotechnology (Santa Cruz, CA). Due to lack of information regarding compound stability, freshly made stock solutions were prepared for each experiment, except for ATRA.
Cell proliferation and differentiation assays
For preliminary screening of the 6 compounds identified by cMap analysis, HL60 cells were seeded at 1.5×10⁵ cells/ml and treated with each compound, firstly, at the concentration reported in the cMap database. Subsequently, other concentrations were tested, based on the results obtained. To evaluate the effects of the small molecules on proliferation, cells were treated for 24, 48, 72 hours and 6 d and counted by trypan blue exclusion (Gibco, Life Technologies, Carlsbad, CA, USA).
For further analysis of selected compounds, parental and derivative HL60 cells were seeded at 1.5×10⁵ cells/ml and left untreated or treated with ATRA (10nM), ATRA + diperodon (10 nM and 40μM, respectively) or amantadine (200μM), or diperodon (40μM) or amantadine (200μM) only. Three and 6 d post treatment, cells were counted by trypan blue exclusion and differentiation was evaluated by May-Grünwald-Giemsa staining (Sigma-Aldrich) of cytospins and by flow cytometry analysis of differentiation markers.
U937 and Kasumi-1 cells were seeded at 1×10⁵ cells/ml and left untreated or treated with Vitamin D3 (10−8M), Vitamin D3 + amantadine (10−8M and 200μM, respectively) or amantadine (200μM) only. Three days post treatment, U937 cells were diluted 1:5 and drugs were added at the appropriate concentrations. Three and/or 6 d after the beginning of the treatment, cells were counted by trypan blue exclusion and differentiation was evaluated by flow cytometry analysis of differentiation marker expression.
Flow cytometry
For cell cycle analysis, the hypotonic propidium iodide method49 was used. To determine the number of cells in S phase, a 5′- Bromodeoxyuridine (BrdU) incorporation assay was carried out, as preiously reported,50 in cells treated for 48 hours.
Differentiation of treated cells were assessed by evaluating the levels of surface markers specific for granulocytic and monocytic differentiation, by use of: anti-CD11b (PE rat anti-mouse CD11b, clone M1/70, cat: 557397, BD-PharMingen, San Diego, CA, USA), anti-CD15 (PE-Cy mouse anti-human CD15, clone Hl98, cat: 560827, BD Pharminogen), anti-CD14 (PE mouse anti-human CD14, cat:555398, BD Pharminogen) and anti-CD163 (PE mouse anti-human CD163, cat: 556018, BD Pharminogen) antibodies.
Three×105 HL60, U937 and Kasumi-1 cells were harvested for each condition, washed in PBS + 2% FBS, resuspended in 500μl of PBS + 2% FBS and incubated with the respective antibody for 1 hour at 4°C avoiding light exposure. Then, cells were washed twice in PBS + 2% FBS, resuspended in 500μl of PBS and analyzed by Coulter Epics XL-MCL (Coulter Corporation, Miami, FL, USA).
Data are reported as the mean of the value obtained subtracting the “blank” value (auto-fluorescence baseline) to the gate measurements ± SD of two or 3 independent experiments.
Real-Time quantitative PCR
Treated cells were collected at 24, 48 and 72h and total RNA was isolated using RNeasy Mini kit (Qiagen, Valencia, CA, USA) and reverse transcribed by the High Capacity cDNA Reverse Transcription kit (ABI, Life Technologies), both performed following manufacturer's instructions. The resulting cDNA was used as PCR template. All reactions were carried out in triplicate and total RNA was extracted from 2 or 3 independent experiments. RT-qPCR was performed using the Go Taq PCR Mater Mix (Promega, Madison, WI, USA) on a MyIQ5 thermocycler (BioRad, Hercules, CA, USA) and quantified using MyIQ5 software (Bio-Rad). Levels of HPRT were monitored as internal control to normalize input cDNA. Data were analyzed with ΔCt method.
Primers used are as follows: CD11b: Fw 5′-CGCCATCATCTTACGGAACC-3′, Rv 5′-CTGCCTGAACATCGCTACC-3′; CD14: Fw 5′-AAGCACTTCCAGAGCCTGTC-3′, Rv 5′-TCGTCCAGCTCACAAGGTTC-3′;CD163: Fw 5′-ATAACTGTGACCATGCTGAGG-3′, Rv 5′-ACATTCAGTGACTCCATCTACC-3′; PU.1: Fw 5′-GCGTGCAAAATGGAAGGGTT-3′, Rv 5′-GGCTATGGCTCTCCCCATCAC-3′;VDR: Fw 5′- CCAGTTCGTGTGAATGATGG −3′, Rv 5′- AGATTGGAGAAGCTGGACGA −3′;HPRT: Fw 5′-AGACTTGCTTTCCTTGGTCAGG-3′; Rv 5′-GTCTGGCTTATATCCAACACTTCG-3′.
Western blot analysis
For Western blotting, cells were lysed (2 × 10⁵ cells/20μL in Laemmli buffer) and proteins of interest were detected with anti-PU.1 rabbit polyclonal antibody (SC-352; Santa Cruz Biotechnology, Santa Cruz, CA), anti-Vitamin D receptor rabbit monoclonal antibody (EPR4552; AbCam, Cambridge, UK) or anti-GRB2 monoclonal antibody (610112; BD Transduction Laboratories, Lexington, KY). For densitometric analysis of expression levels, bands corresponding to PU.1, VDR and Grb2 as loading control, were scanned and analyzed with ImageJ Software (National Institutes of Health).
Statistical analyses
Data (presented as the mean ± SD of two or 3 independent experiments) were analyzed for statistical significance by the unpaired, 2-tailed Student's t test. P values less than 0.05 were considered statistically significant.
Disclosure of Potential Conflicts of Interest
No potential conflicts of interest were disclosed.
Funding
This work was supported by grants from Fondazione Cassa di Risparmio di Vignola (FCRV) and National Cancer Institute (NCI) RO1 CA 167169 to BC. GM is supported by a post-doctoral fellowship of the Associazione Italiana Ricerca sul Cancro (AIRC). SC is supported by a fellowship from the “Fondazione Umberto Veronesi.”
Supplemental Material
Supplemental data for this article can be accessed on the publisher's website.
References
- 1.Löwenberg B, Downing JR, Burnett A. Acute myeloid leukemia. N Engl J Med 1999; 341:1051-62; PMID:10502596; http://dx.doi.org/ 10.1056/NEJM199909303411407 [DOI] [PubMed] [Google Scholar]
- 2.Dash A, Gilliland DG. Molecular genetics of acute myeloid leukaemia. Best Pract Res Clin Haematol 2001; 14:49-64; PMID:11355923; http://dx.doi.org/ 10.1053/beha.2000.0115 [DOI] [PubMed] [Google Scholar]
- 3.Gilliland DG. Hematologic malignancies. Curr Opin Hematol 2001; 8:189-91; PMID:11561153; http://dx.doi.org/ 10.1097/00062752-200107000-00001 [DOI] [PubMed] [Google Scholar]
- 4.Tenen DG. Disruption of differentiation in human cancer: AML shows the way. Nat Rev Cancer 2003; 3:89-101; PMID:12563308; http://dx.doi.org/ 10.1038/nrc989 [DOI] [PubMed] [Google Scholar]
- 5.Koschmieder S, Rosenbauer F, Steidl U, Owens BM, Tenen DG. Role of transcription factors C/EBPalpha and PU.1 in normal hematopoiesis and in leukemia. Int J Hematol 2005; 81:368-71; PMID:16158816; http://dx.doi.org/ 10.1532/IJH97.05051 [DOI] [PubMed] [Google Scholar]
- 6.Nerlov C. C1487;EBPalpha mutations in acute myeloid leukaemias. Nat Rev Cancer 2004; 4:394-400; PMID:15122210; http://dx.doi.org/ 10.1038/nrc1363 [DOI] [PubMed] [Google Scholar]
- 7.Kirstetter P, Schuster MB, Bereshchenko O, Moore S, Dvinge H, Kurz E, Theilgaard-Monch K, Mansson R, Pedersen TA, Pabst T. Modeling of C/EBPalpha mutant acute myeloid leukemia reveals a common expression signature of committed myeloid leukemia-initiating cells. Cancer Cell 2008; 13:299-310; PMID:18394553; http://dx.doi.org/ 10.1016/j.ccr.2008.02.008 [DOI] [PubMed] [Google Scholar]
- 8.Grignani F, De Matteis S, Nervi C, Tomassoni L, Gelmetti V, Cioce M, Fanelli M, Ruthardt M, Ferrara FF, Zamir I. Fusion proteins of the retinoic acid receptor-alpha recruit histone deacetylase in promyelocytic leukaemia. Nature 1998; 391:815-8; PMID:9486655; http://dx.doi.org/ 10.1038/35901 [DOI] [PubMed] [Google Scholar]
- 9.Pabst T, Mueller BU, Harakawa N, Schoch C, Haferlach T, Behre G, Hiddeman W, Zhang DE, Tenen DG. AML1-ETO downregulates the granulocytic differentiation factor C/EBPalpha in t(8;21) myeloid leukemia. Nat Med 2001; 7:444-51; PMID:11283671; http://dx.doi.org/ 10.1038/86515 [DOI] [PubMed] [Google Scholar]
- 10.Helbling D, Mueller BU, Timchenko NA, Hagemeijer A, Jotterand M, Meyer-Monard S, Lister A, Rowley JD, Huegli B, Fey MF, et al.. The leukemic fusion gene AML1-MDS1-EVI1 suppresses CEBPA in acute myeloid leukemia by activation of Calreticulin. Proc Natl Acad Sci U S A 2004; 101:13312-7; PMID:15326310; http://dx.doi.org/ 10.1073/pnas.0404731101 [DOI] [PMC free article] [PubMed] [Google Scholar]
- 11.Zhou Y, Du W, Koretsky T, Bagby GC, Pang Q. TAT-mediated intracellular delivery of NPM-derived peptide induces apoptosis in leukemic cells and suppresses leukemogenesis in mice. Blood 2008; 112:2474-83; PMID:18574026; http://dx.doi.org/ 10.1182/blood-2007-12-130211 [DOI] [PMC free article] [PubMed] [Google Scholar]
- 12.Liu X, Wang Y, Nakamura K, Kubo A, Hnatowich DJ. Cell studies of a three-component antisense MORF/tat/Herceptin nanoparticle designed for improved tumor delivery. Cancer Gene Ther 2008; 15:126-32; PMID:18084241; http://dx.doi.org/ 10.1038/sj.cgt.7701111 [DOI] [PubMed] [Google Scholar]
- 13.Fujiki A, Imamura T, Sakamoto K, Kawashima S, Yoshida H, Hirashima Y, Miyachi M, Yagyu S, Nakatani T, Sugiota K, et al.. All-trans retinoic acid combined with 5-aza-2′-deoxycitidine induces C/EBPα expression and growth inhibition in MLL-AF9-positive leukemic cells. Biochem Biophys Res Commun 2012; 428:216-23; PMID:23063977; http://dx.doi.org/ 10.1016/j.bbrc.2012.09.131 [DOI] [PubMed] [Google Scholar]
- 14.Iijima K, Honma Y, Niitsu N. Granulocytic differentiation of leukemic cells with t(9;11)(p22;q23) induced by all-trans-retinoic acid. Leuk Lymphoma 2004; 45:1017-24; PMID:15291362; http://dx.doi.org/ 10.1080/1042819031000163887 [DOI] [PubMed] [Google Scholar]
- 15.Gu ZM, Wu YL, Zhou MY, Liu CX, Xu HZ, Yan H, Zhao Y, Huang Y, Sun HD, Chen GQ. Pharicin B stabilizes retinoic acid receptor-α and presents synergistic differentiation induction with ATRA in myeloid leukemic cells. Blood 2010; 116:5289-97; PMID:20739655; http://dx.doi.org/ 10.1182/blood-2010-02-267963 [DOI] [PubMed] [Google Scholar]
- 16.Fang Y, Zhou X, Lin M, Ying M, Luo P, Zhu D, Lou J, Yang B, He Q. Inhibition of all-trans-retinoic acid-induced proteasome activation potentiates the differentiating effect of retinoid in acute myeloid leukemia cells. Mol Carcinog 2011; 50:24-35; PMID:20945414; http://dx.doi.org/ 10.1002/mc.20687 [DOI] [PubMed] [Google Scholar]
- 17.Cassinat B, Zassadowski F, Ferry C, Llopis L, Bruck N, Lainey E, Duong V, Cras A, Despouy G, Chourbagi D. New role for granulocyte colony-stimulating factor-induced extracellular signal-regulated kinase 1/2 in histone modification and retinoic acid receptor α recruitment to gene promoters: relevance to acute promyelocytic leukemia cell differentiation. Mol Cell Biol 2011; 31:1409-18; PMID:21262770; http://dx.doi.org/ 10.1128/MCB.00756-10 [DOI] [PMC free article] [PubMed] [Google Scholar]
- 18.Glasow A, Barrett A, Petrie K, Gupta R, Boix-Chornet M, Zhou DC, Grimwade D, Gallagher R, von Lindern M, Waxman S. DNA methylation-independent loss of RARA gene expression in acute myeloid leukemia. Blood 2008; 111:2374-7; PMID:17993618; http://dx.doi.org/ 10.1182/blood-2007-05-088344 [DOI] [PubMed] [Google Scholar]
- 19.Glasow A, Prodromou N, Xu K, von Lindern M, Zelent A. Retinoids and myelomonocytic growth factors cooperatively activate RARA and induce human myeloid leukemia cell differentiation via MAP kinase pathways. Blood 2005; 105:341-9; PMID:15339853; http://dx.doi.org/ 10.1182/blood-2004-03-1074 [DOI] [PubMed] [Google Scholar]
- 20.Lamb J, Crawford ED, Peck D, Modell JW, Blat IC, Wrobel MJ, Brunet JP, Subramanian A, Ross KN, Reich M. The Connectivity Map: using gene-expression signatures to connect small molecules, genes, and disease. Science 2006; 313:1929-35; PMID:17008526; http://dx.doi.org/ 10.1126/science.1132939 [DOI] [PubMed] [Google Scholar]
- 21.Iorio F, Tagliaferri R, di Bernardo D. Identifying network of drug mode of action by gene expression profiling. J Comput Biol 2009; 16(2):241-51; PMID:19183001; http://dx.doi.org/ 10.1089/cmb.2008.10TT [DOI] [PubMed] [Google Scholar]
- 22.Iorio F, Bosotti R, Scacheri E, Belcastro V, Mithbaokar P, Ferriero R, Murino L,Tagliaferri R, Brunetti-Pierri N, Isacchi A, et al.. Discovery of drug mode of action and drug repositioning from transcriptional responses. Proc Natl Acad Sci U S A 2010; 107:14621-6; PMID:20679242; http://dx.doi.org/ 10.1073/pnas.1000138107 [DOI] [PMC free article] [PubMed] [Google Scholar]
- 23.Zhang SD, Gant TW. sscMap: an extensible Java application for connecting small-molecule drugs using gene-expression signatures. BMC Bioinformatics 2009; 10:236; PMID:19646231; http://dx.doi.org/ 10.1186/1471-2105-10-236 [DOI] [PMC free article] [PubMed] [Google Scholar]
- 24.McArt DG, Bankhead P, Dunne PD, Salto-Tellez M, Hamilton P, Zhang SD. cudaMap: a GPU accelerated program for gene expression connectivity mapping. BMC Bioinform 2013; 14:305; PMID:24112435; http://dx.doi.org/ 10.1186/1471-2105-14-305 [DOI] [PMC free article] [PubMed] [Google Scholar]
- 25.Glaser KB, Staver MJ, Waring JF, Stender J, Ulrich RG, Davidsen SK. Gene expression profiling of multiple histone deacetylase (HDAC) inhibitors: defining a common gene set produced by HDAC inhibition in T24 and MDA carcinoma cell lines. Mol Cancer Ther 2003; 2:151-63; PMID:12589032 [PubMed] [Google Scholar]
- 26.Wei G, Twomey D, Lamb J, Schlis K, Agarwal J, Stam RW, Opferman JT, Sallan SE, den Boer ML, Pieters R. Gene expression-based chemical genomics identifies rapamycin as a modulator of MCL1 and glucocorticoid resistance. Cancer Cell 2006; 10:331-42; PMID:17010674; http://dx.doi.org/ 10.1016/j.ccr.2006.09.006 [DOI] [PubMed] [Google Scholar]
- 27.Gheeya J, Johansson P, Chen QR, Dexheimer T, Metaferia B, Song YK, Wei JS, He J, Pommier Y, Khan J. Expression profiling identifies epoxy anthraquinone derivative as a DNA topoisomerase inhibitor. Cancer Lett 2010; 293:124-31; PMID:20133050; http://dx.doi.org/ 10.1016/j.canlet.2010.01.004 [DOI] [PMC free article] [PubMed] [Google Scholar]
- 28.D'Arcy P, Brnjic S, Olofsson MH, Fryknäs M, Lindsten K, De Cesare M, Perego P, Sadeghi B, Hassan M, Larsson R, Linder S. Inhibition of proteasome deubiquitinating activity as a new cancer therapy. Nat Med 2011; 17:1636-40; PMID:22057347; http://dx.doi.org/ 10.1038/nm.2536 [DOI] [PubMed] [Google Scholar]
- 29.Kunkel SD, Suneja M, Ebert SM, Bongers KS, Fox DK, Malmberg SE, Alipour F, Shields RK, Adams CM. mRNA expression signatures of human skeletal muscle atrophy identify a natural compound that increases muscle mass. Cell Metab 2011; 13:627-38; PMID:21641545; http://dx.doi.org/ 10.1016/j.cmet.2011.03.020 [DOI] [PMC free article] [PubMed] [Google Scholar]
- 30.Dudley JT, Sirota M, Shenoy M, Pai RK, Roedder S, Chiang A, Morgan AA, Sarwal MM, Pasrucha PJ, Butte AJ. Computational repositioning of the anticonvulsant topiramate for inflammatory bowel disease. Sci Transl Med 2011; 3:96ra76; PMID:21849664; http://dx.doi.org/ 10.1126/scitranslmed.3002648 [DOI] [PMC free article] [PubMed] [Google Scholar]
- 31.Huang L, Zhao S, Frasor JM, Dai Y. An integrated bioinformatics approach identifies elevated cyclin E2 expression and E2F activity as distinct features of tamoxifen resistant breast tumors. PloS One 2011; 6:e22274; PMID:21789246; http://dx.doi.org/ 10.1371/journal.pone.0022274 [DOI] [PMC free article] [PubMed] [Google Scholar]
- 32.Chen MH, Yang WL, Lin KT, Liu CH, Liu YW, Huang KW, Chang PM, Lai JM, Hsu CN, Chao KM, et al.. Gene expression-based chemical genomics identifies potential therapeutic drugs in hepatocellular carcinoma. PloS One 2011; 6:e27186; PMID:22087264; http://dx.doi.org/ 10.1371/journal.pone.0027186 [DOI] [PMC free article] [PubMed] [Google Scholar]
- 33.Ferrari-Amorotti G, Mariani SA, Novi C, Cattelani S, Pecorari L, Corradini F, Soliera AR, Manzotti G, Fragliasso V, Zhang Y, et al.. The biological effects of C/EBPalpha in K562 cells depend on the potency of the N-terminal regulatory region, not on specificity of the DNA binding domain. J Biol Chem 2010; 285:30837-50; PMID:20659895; http://dx.doi.org/ 10.1074/jbc.M110.128272 [DOI] [PMC free article] [PubMed] [Google Scholar]
- 34.Huang ME, Ye YC, Chen SR, Chai JR, Lu JX, Zhoa L, Gu LS, Whang ZY. Use of all-trans retinoic acid in the treatment of acute promyelocytic leukemia. Blood 1988; 72:567-72; PMID:3165295 [PubMed] [Google Scholar]
- 35.Castaigne S, Chomienne C, Daniel MT, Ballerini P, Degos L. All-trans retinoic acid as a differentiation therapy for acute promyelocytic leukemia. I. Clinical results. Blood 1990; 76:1704-9; PMID:2224119 [PubMed] [Google Scholar]
- 36.Lee MG, Wynder C, Schmidt DM, McCafferty DG, Shiekhattar R. Histone H3 lysine 4 demethylation is a target of nonselective antidepressive medications. Chem Biol 2006; 13:563-7; PMID:16793513; http://dx.doi.org/ 10.1016/j.chembiol.2006.05.004 [DOI] [PubMed] [Google Scholar]
- 37.Ferrari-Amorotti G, Fragliasso V, Esteki R, Prudente Z, Soliera AR, Cattelani S, Manzotti G, Grisendi G, Dominici M, Pieraccioli M, et al.. Inhibiting interactions of lysine demethylase LSD1 with snail/slug blocks cancer cell invasion. Cancer Res 2013; 73:235-45; PMID:23054398; http://dx.doi.org/ 10.1158/0008-5472.CAN-12-1739 [DOI] [PMC free article] [PubMed] [Google Scholar]
- 38.Gemelli C, Martello A, Montanari M, Zanocco-Marani T, Salsi V, Zappavigna V, Parenti S, Vignudelli T, Selmi T, Ferrari S, Grande A. The Orosomucoid 1 protein is involved in the vitamin D – mediated macrophage de-activation process. Exp Cell Res 2013; 319:3201-13; PMID:23973664; http://dx.doi.org/ 10.1016/j.yexcr.2013.08.017 [DOI] [PubMed] [Google Scholar]
- 39.Tavor S, Park DJ, Gery S, Vuong PT, Gombart AF, Koeffler HP. Restoration of C/EBPalpha expression in a BCR-ABL+ cell line induces terminal granulocytic differentiation. J Biol Chem 2003; 278:52651-9; PMID:14517214; http://dx.doi.org/ 10.1074/jbc.M307077200 [DOI] [PubMed] [Google Scholar]
- 40.Ferrari-Amorotti G, Keeshan K, Zattoni M, Guerzoni C, Iotti G, Cattelani S, Donato NJ, Calabretta B. Leukemogenesis induced by wild-type and STI571-resistant BCR/ABL is potently suppressed by C/EBPalpha. Blood 2006; 108:1353-62; PMID:16670262; http://dx.doi.org/ 10.1182/blood-2006-01-011833 [DOI] [PMC free article] [PubMed] [Google Scholar]
- 41.Schenk T, Chen WC, Göllner S, Howell L, Jin L, Hebestreit K, Klein HU, Popescu AC, Burnett A, Mills K, et al.. Inhibition of the LSD1 (KDM1A) demethylase reactivates the all-trans-retinoic acid differentiation pathway in acute myeloid leukemia. Nat Med 2012; 18:605-11; PMID:22406747; http://dx.doi.org/ 10.1038/nm.2661 [DOI] [PMC free article] [PubMed] [Google Scholar]
- 42.Blanpied TA, Clarke RJ, Johnson JW. Amantadine inhibits NMDA receptors by accelerating channel closure during channel block. J Neurosci 2005; 25:3317-22; http://dx.doi.org/ 10.1523/JNEUROSCI.4262-04.2005 [DOI] [PMC free article] [PubMed] [Google Scholar]
- 43.Forchap SL, Pirmohamed M, Clark RE. Release of intracellular calcium primes chronic myeloid leukaemia for tyrosine kinase inhibitor-induced apoptosis. Leukemia 2012; 26:490-8; PMID:21886172; http://dx.doi.org/ 10.1038/leu.2011.231 [DOI] [PubMed] [Google Scholar]
- 44.Komura T, Sakai Y, Honda M, Takamura T, Wada T, Kaneko S. ER stress-induced impaired TLR signalling and macrophage differentiation of human monocytes. Cell Immunol 2013; 282:44-52; PMID:23665674; http://dx.doi.org/ 10.1016/j.cellimm.2013.04.006 [DOI] [PubMed] [Google Scholar]
- 45.Issa LL, Leong GM, Eisman JA. Molecular mechanism of vitamin D receptor action. Inflamm Res 1998; 47:451-75; PMID:9892040; http://dx.doi.org/ 10.1007/s000110050360 [DOI] [PubMed] [Google Scholar]
- 46.Manfredini R, Trevisan F, Grande A, Tagliafico E, Montanari M, Lemoli R, Visani G, Tura S, Ferrari S, Ferrari S. Induction of a functional vitamin d receptor in all-trans-retinoic acid-induced monocytic differentiation of M2-type leukemic blast cells. Cancer Res 1999; 59:3803-11; PMID:10446999 [PubMed] [Google Scholar]
- 47.Jurutka PW, Bartik L, Whitfield GK, Mathern DR, Barthel TK, Gurerich M, Hsieh J-C, Kaczmarska M, Haussler CA, Haussler MR. Vitamin D receptor: key roles in bone mineral pathophysiology, molecular mechanism of action, and novel nutritional ligands. J Bone Miner Res 2007; 22(supplement 2):V1-V10 [DOI] [PubMed] [Google Scholar]
- 48.Subramanian A, Tamayo P, Mootha VK, Mukherjee S, Ebert BL, Gillette MA, Paulovich A, Pomeroy SL, Golub TR, Lander ES, et al.. Gene set enrichment analysis: a knowledge-based approach for interpreting genome-wide expression profiles. Proc Natl Acad Sci 2005;102:15545-50; PMID:16199517; http://dx.doi.org/ 10.1073/pnas.0506580102 [DOI] [PMC free article] [PubMed] [Google Scholar]
- 49.Nicoletti I, Migliorati G, Pagliacci MC, Grignani F, Riccardi C. A rapid and simple method for measuring thymocyte apoptosis by propidium iodide staining and flow cytometry. J Immunol Meth 1991; 139:271-9http://dx.doi.org/ 10.1016/0022-1759(91)90198-O [DOI] [PubMed] [Google Scholar]
- 50.Parenti S, Ferrarini F, Zini R, Montanari M, Losi L, Canovi B, Ferrari S, Grande A. Mesalazine inhibits the beta-catenin signalling pathway acting through the upregulation of mu-protocadherin gene in colo-rectal cancer cells. Aliment Pharmacol Ther 2010; 1:108-19; http://dx.doi.org/ 10.1111/j.1365-2036.2009.04149.x [DOI] [PubMed] [Google Scholar]
Associated Data
This section collects any data citations, data availability statements, or supplementary materials included in this article.