

Abstract
In the mammalian genome, each histone family contains multiple replication-dependent paralogs, which are found in clusters where their transcription is thought to be coupled to the cell cycle. Here, we wanted to interrogate the transcriptional regulation of these paralogs during retinal development and aging. We employed deep sequencing, quantitative PCR, in situ hybridization (ISH), and microarray analysis, which revealed that replication-dependent histone genes were not only transcribed in progenitor cells but also in differentiating neurons. Specifically, by ISH analysis we found that different histone genes were actively transcribed in a subset of neurons between postnatal day 7 and 14. Interestingly, within a histone family, not all paralogs were transcribed at the same level during retinal development. For example, expression of Hist1h1b was higher embryonically, while that of Hist1h1c was higher postnatally. Finally, expression of replication-dependent histone genes was also observed in the aging retina. Moreover, transcription of replication-dependent histones was independent of rapamycin-mediated mTOR pathway inactivation. Overall, our data suggest the existence of variant nucleosomes produced by the differential expression of the replication-dependent histone genes across retinal development. Also, the expression of a subset of replication-dependent histone isotypes in senescent neurons warrants re-examining these genes as “replication-dependent.” Thus, our findings underscore the importance of understanding the transcriptional regulation of replication-dependent histone genes in the maintenance and functioning of neurons.
Keywords: replication-dependent, histones, retina, development, isotypes, expression, variant nucleosome, transcription
Abbreviations
- ISH
in situ hybridization
- PCR
polymerase chain reaction
- qPCR
quantitative PCR
- Chr
chromosome
- GCL
ganglion cell layer
- INL
inner nuclear layer
- ONL
outer nuclear layer
- CE
cytoplasmic extract
- NE
nuclear extract
- AA
amino acid
- ONBL
outer neuroblastic layer
- RPE
retinal pigment epithelium
Introduction
Paralogous genes are functionally related with a high degree of amino acid (AA) conservation, and are derived via gene duplication. The value of paralogous genes was conceptualized by Ohno, who proposed the idea of evolution through gene duplication.1 The central idea was that when a gene duplicated, the new paralog was relieved from the pre-existing functional constraints and was now free to evolve novel functions. Recently, a more nuanced interpretation of this original idea has emerged, and it suggests that the most likely outcome of gene duplication is an accelerated evolution of both paralogs, which in turn leads to subcompartmentalization of the function of the ancestral genes. This subcompartmentalization can be achieved by transcription regulation of these paralogs in a tissue specific manner and across development. A good example of paralogs is that of the histone and the snRNA genes of the major spliceosome. Here the genes have duplicated as clusters of many gene copies, or isotypes, within a locus. The large number of paralogs in this case is thought to have evolved to meet the heavy demands of the cell for these proteins and snRNAs. However, a recent publication from the Ackerman laboratory showed that the loss of function of one of the U2 snRNA genes, Rnu2–8, results in ataxia and neurodegeneration.2 This observation showed that, like protein-coding gene paralogs, a snRNA gene whose expression was thought to be ubiquitous was in fact spatiotemporally regulated. Thus, the question we sought to study was whether histone genes follow similar spatiotemporal transcription regulation.
There are 5 classes of histone proteins in the eukaryotic chromatin, including H2a, H2b, H3, H4, and H1. The core nucleosome octamer consists of 2 molcules of histone H2a, H2b, H3, and H4, around which 146 bp of left-handed superhelical DNA is wrapped in ∼1.6 turns. Higher order structure is achieved by linking these DNA-wrapped octamers via linker histone called H1. In mammals each histone protein is encoded by multiple genes that are categorized into 2 major groups: replication-dependent (canonical) and replication-independent (replacement) histone genes.3,4 Here we focused on transcription regulation of replication-dependent histone genes that are found in 3 clusters: Hist1 (Chr-13), Hist2 (Chr-3) and Hist3 (Chr-11) in the mouse genome. An exception to this is the single replication-dependent histone Hist4h4, which is located on chromosome 6. In mice there are 6 paralogs for histone H1, 20 for H2a, 18 for H2b, 12 for H3, and 13 for H4 (Table S1).3
Replication dependent histone genes have been shown to be actively transcribed during the S-phase of the cell cycle. They also generally lack introns and are not poly-adenylated.5–7 Instead, their 3′ untranslated region (3’UTR) has a stem loop to which 2 trans-acting factors, stem-loop binding protein (SLBP) and6 U7 snRNP, bind to facilitate rapid export. This in turn allows for rapid histone protein production necessary for a cell undergoing cell division. This suggests that in a developing tissue that is composed of mitotic and post-mitotic cells, replication-dependent histone genes are not transcribed in the post-mitotic cells. However, a recent publication showed that histone proteins are translated in adult neurons, which suggests that in the central nervous system, transcription of replication-dependent histones might not be coupled to cell cycle.8 To further understand the transcriptional regulation of histones in senescent neurons, we employed the mouse retina as our model system. The retina is derived from the developing central nervous system and is composed of 6 neurons, including rod photoreceptors, cone photoreceptors, amacrine cells, bipolar cells, horizontal cells, and retinal ganglion cells. The retina also contains one glial cell type, called Müller glia. The retina has a stereotypic architecture where different cells are tiled together to form 3 layers, including the ganglion cell layer (GCL), which contains retinal ganglion cells and displaced amacrine cells; the inner nuclear layer (INL), which contains amacrine cells, bipolar cells, horizontal cells, Müller glia, and displaced ganglion cells; and the outer nuclear layer (ONL), which contains rod photoreceptors and cone photoreceptors. The retinal cell types are produced from the multipotent retinal progenitors in a stereotypic temporal sequence.9,10 In mice, the production of retinal neurons spans from embryonic day (E) 12.5 to approximately postnatal day (P) 10 followed by terminal differentiation, synaptogenesis, and pruning until P21.9,11
Here, we discovered that replication-dependent histone genes were not only transcribed during development, but also in adult and aging retinal neurons. Similarly, the replication-dependent histone genes of a gene family, irrespective of coding for identical or different protein variants, were differentially expressed during embryonic and postnatal development. Similar variation was observed in the single cell microarray analysis on individual retinal neurons. This suggests that there is differential contribution of the various histone isotypes to the total histone pool that will ultimately constitute the nucleosome. This suggests the existence of a variant nucleosome across retinal development and among the various retinal neurons. Thus, mutations that lead to loss of function of one isotype might not be compensated by other histone genes. Indeed, this possibility was recently confirmed by a report that showed that mutations in specific histone genes can lead to pediatric glioblastoma.12,13
Results
Deep sequencing shows differential transcription of replication-dependent histone genes
Transcription of replication-dependent histone genes in yeast and HeLa cells has been shown to be synchronized to the S-phase of the cell cycle.14 We wanted to interrogate whether this holds true in a developing tissue such as the retina. To this end, we mined our deep sequencing data from cytoplasmic extract (CE) of E16 and P0 retinae (submitted for publication elsewhere). First, we interrogated the expression patterns of housekeeping genes, such as Actb and Gapdh, along with Pax6, which showed equivalent expression in both E16 CE and P0 CE (Fig. 1A).16–18 Next, we interrogated genes that are known to shift in their expression patterns, such as Fgf15, Fgf13, Nr2e3, Nrl, and Rho.19–23 We also used Xist to determine cross-contamination from the nuclear extract to the cytoplasmic extract. As expected, Fgf15 and Fgf13 showed higher expression at E16 than P0, while Nr2e3 and Nrl showed expression only at P0 (Fig. 1A), which is in agreement with previous reports.15-17 Finally, Rho did not show expression at either of these time points, and the nuclear-specific Xist transcripts were not observed in the cytoplasmic extracts at either time point (Fig. 1A). Here we found that all histone genes were not transcribed at the same level within and between the 2 time points (Figs. 1B–F). Specifically, for H1 genes Hist1h (1a and 1b) were highly expressed followed by Hist1h (1e and 1c) (Fig. 1B). Hist1h1d was the lowest expressed H1 histone. As predicted, Hist1h1t was not detected (Fig. 1B) in the retina as it is exclusively expressed in spermatozoa.18 Overall, the trend for H1 genes was higher expression in P0 CE than in E16 CE. For the H2a genes, Hist1h (2aa2, 2a1, 2an, 2ao, and 2ag) were highly expressed (Fig. 1C). This was followed by Hist2h2ac, Hist3h2a, Hist1h (2ab and 2ak), Hist2h (2aa1 and 2ab), Hist1h (2ap, 2ah, 2af, 2ai, 2ae, 2ad, and 2ac) (Fig. 1C). In contrast, Hist1h (2aj and 2aa) were not expressed (Fig. 1C). Again, like H1 genes, higher transcript levels were observed for the H2a genes in P0 CE compared to E16 CE (Figs. 1B and C). For H2b genes, the highly expressed genes were Hist2h2bb, Hist1h (2bk, 2bb, and 2bf) followed by Hist1h (2bp and 2bc), Hist3h2ba, and Hist1h (2bj, 2bg, 2bh and 2br) (Fig. 1D). The 3 genes Hist1h2bn, Hist2h2be, and Hist1h2bm were expressed at lower levels, and all 3 had higher expression levels in P0 CE compared to E16 CE. Finally, the H2b genes that were not expressed were Hist1h (2be, 2ba, 2bl, and 2bq) (Fig. 1D). Overall, the expression pattern for H2b was similar to that of H2a (Figs. 1C and D). For H3 genes, the highly expressed genes were Hist1h3b, Hist2h3b, and Hist1h (3i and 3h), followed by Hist1h (3g), Hist2h3c2, and Hist1h (h3e, h3d, 3c, 3a, and 3f), while Hist2h3c1 was not expressed (Fig. 1E). Overall, most of the H3 genes had relatively higher expression levels at P0 than at E16, except for Hist1h3g and Hist2h3c2, which had the same expression levels at both time points (Fig. 1E). For H4 genes, Hist1h (4f, 4k, and 4m) were relatively highly expressed compared to Hist1h (4h, 4c, 4d, 4a, 4j, and 4b), Hist2h4, Hist4h4, and Hist1h (4n and 4i) (Fig. 1F). Again, the overall expression for H4 was higher at P0 than E16.
Figure 1.

Expression of replication-dependent histone genes by deep sequence analysis. Shown here are the heat maps representing the FPKM values converted to log2. (A) Expression of genes with known expression kinetics in E16 and P0 CE. Expression of H1 isotypes (B), H2a isotypes (C), H2b isotypes (D), H3 isotypes (E), and H4 isotypes (F) in E16 and P0 CE. Shown in the box in the top right corner is the key representing the expression levels ranging from 12 (blue) to 0 (yellow).
Replication-dependent histone gene isotypes encode variant proteins
Given that most of the histone genes were differentially expressed at E16 and P0, we wanted to investigate whether there are functional consequences to these dynamic expression patterns. To study this, we interrogated whether all of the histone paralogs encode identical proteins. First, we sought to arrange the amino acid (AA) sequences of each histone protein. Previously, primary sequence variants have been reported,3 but there have been continuous updates in the databases, so we revisited this analysis. Based on NCBI, Ensembl, UCSC genome browser, MGI, and published literature, we organized the histone genes by name and cluster (Table S1). Second, we performed multiple sequence alignments based on neighbor-joining by percent identity of polypeptides (Supplementary Fig, S1A). All H1 polypeptide sequences diverged significantly at the N-terminus (1–60 AA) and C-terminus (119–223 AA), but were highly conserved from AA 60–118 (Supplementary Fig. S1A). These sequence variations have previously been described for human H1 proteins.19 The most divergent protein was Hist1h1t followed by Hist1h1a, and the most similar were Hist1h1d and Hist1h1e (Supplementary Fig. S1A). In the case of H2a, 9 proteins had 100% identical (canonical protein) AA sequence, while 10 had AA variations compared to the canonical protein (Supplementary Fig. S1B). Among the latter 9 histone variants, Hist1h2ak and Hist1h2af differed from the canonical protein at S123T and A127P, respectively (Supplementary Fig. S1B). Two proteins, Hist1h2am and Hist1h2ah, lacked 2 AA residues the at end of the C-terminus compared to the canonical form. Four proteins, Hist1h2al, Hist2h2aa1, Hist3h2a, and Hist2h2ac, showed AA changes at T17S, S41A, L52M, and R100K (Supplementary Fig. S1B). Hist2h2ac also showed amino acid changes at H125K and G129S, and it lacked an amino acid at position K126 (Supplementary Fig. S1B). The most divergent polypeptides were Hist2h2ab and Hist1h2aa (Supplementary Fig. S1B). Hist2h2ab differed at T17S, S41A, L52M, I88V, R100G, H125K, K126P, A127G, and G129N (Supplementary Fig. S1B). Hist1h2aa differed from the canonical polypeptide at R4P, G5T, Q7R, A15V, T17S, K37Q, S41A, E42Q, V44I, I63V, I80T, H125K, K126S, A127Q, K128T, G129K, and it also lacked a ‘K’ at position K130 (Supplementary Fig. S1B). For H2b, 6 proteins had 100% identical (canonical protein) AA sequence, while 12 proteins had variations (Supplementary Fig. S1C). For example, Hist1h2bk differed from the canonical polypeptide at position S126A (Supplementary Fig. S1C). Three H2b proteins, Hist1h2b (c, e, and g), were the same, but differed from the canonical polypeptide at position S77G (Supplementary Fig. S1C). Similar proteins were encoded by Hist1h2bm and Hist1h2bh, but they also differed from the canonical peptide at positions A5T and V20L, respectively. The rest of the H2b proteins varied from the canonical polypeptide at several positions, such as Hist1h2bb (A5S, V20I, and T21S), Hist2h2bb (E3D, A23V, and S77G), Hist3h2ba (A5S, K7R, A9T, V20I, S34G, V41I, and I96V) and Hist2h2be (P4L, V41I, S77N, A99S, and S126A) (Supplementary Fig. S1C). The 2 most distant polypeptides were Hist1h2bp and Hist1h2ba (Supplementary Fig. S1C), which differed from the canonical polypeptide at many positions. The former differed at A5V and A9V, and the latter at P4V, S8G, P10T, A11I, P12S, S16F, A23T, D27E, K29R, S34C, V41I, V43I, G62S, and N69T (Supplementary Fig. S1C). Additionally, the Hist1h2bp protein had 12 extra AA residues (ILWNKFYYLPSF) at its C-terminal, and Hist1h2ba had an extra AA ‘V’ at position 6 (Fig. 4C). For H3, there were 12 proteins, of which 8 were 100% identical and 4 were the same, except for a single AA change at S97C (Supplementary Fig. S1D). For H4, all 13 proteins were 100% identical (Supplementary Fig. S1E).
Figure 2.

Validation of fractionation/quality of cDNA. Shown here are graphs representing expression values determined by qPCR analysis, with the x-axis showing different time points at which the retinae were harvested. The y-axis is in log scale showing gene expression levels normalized to Gapdh values. Here the error bars represent the standard error of the mean. Dashed lines indicate expression levels of the genes tested in the nuclear fraction, while the solid lines represent expression in the cytoplasmic fraction. (A) Normalized expression of Xist (red) and Malat1 (black) across all time points and fractions. (B) Normalized expression of Rho (red) and Fgf15 (black) across all time points and fractions.
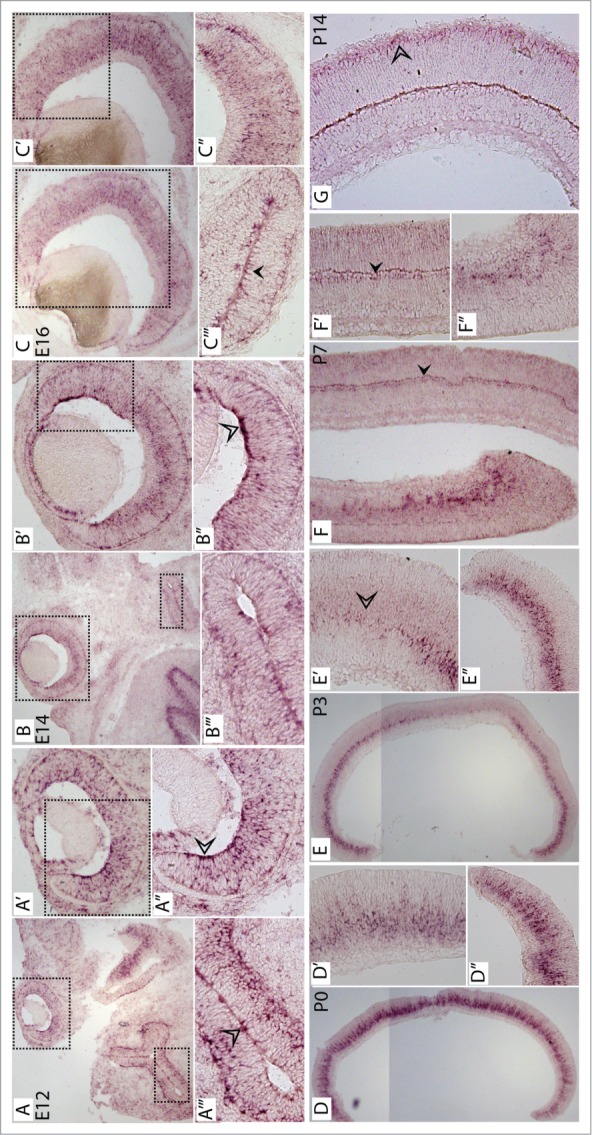
Figure 4.

Spatiotemporal expression analysis by in situ hybridization for all H3 histone mRNA across retinal development. In situ hybridization with DIG-labeled anti-sense RNA probe detecting all H3 histone mRNA across retinal development from E14 to P14. (A) All H3 histone mRNA in situ signal in E14 section including the brain and retina. (A′) and (A″) are magnified images of the boxes around the retina in (A) and (A′), respectively, and (A″′) is a magnified image of the box around the brain in (A). (B) All H3 histone mRNA in situ signal in E16 section including the brain and retina. (B′) and (B″) are magnified images of the boxes around the retina and brain (B), respectively. (C) All H3 histone mRNA in situ signal in E18 retinal section. (C′), (C″), and (C′″) are magnified images of the boxes in the central retina in (C), the peripheral retina in (C), and the peripheral retina in (C″), respectively. (D) All H3 histone mRNA in situ signal for E18 brain section. (D′) is a magnified image of the box in (D). (E) All H3 histone mRNA in situ signal in P0 retinal section. (E′) and (E″) are magnified images of the boxes in the peripheral and central retina in (E), respectively. (F) All H3 histone mRNA in situ signal in P3 retinal section. (F′) and (F″) are magnified images of the boxes around the peripheral and central retina in (F), respectively. (G) All H3 histone mRNA in situ signal in P7 retinal section. (G′) and (G″) are magnified images of the boxes around the peripheral and central retina in (G), respectively. (H) All H3 histone mRNA in situ signal in P14 retinal section.
Histone genes are dynamically expressed across embryonic and postnatal retinal development
The various histone genes were differentially expressed at E16 and P0. Moreover, the proteins encoded by these genes have variations in their AA sequences. Taken together it suggested that expression of the different paralogs might be regulated during retinal development. To address this issue, we employed qPCR analysis to interrogate the transcription of specific histone isotypes across retinal development starting with E14, E16, E18, P0, P2, P4, P10, and P25. For this, we fractionated the retinae from each time point into cytoplasmic and nuclear RNA followed by cDNA synthesis. However, first we wanted to check the level of cross-contamination between the 2 retinal fractions. For this, we determined the expression profiles of 2 genes, Xist and Malat1, both of which are known to reside predominantly in the nucleus.20-22 Here the qPCR results showed that across all time points, RNA for Xist and Malat1 was predominantly observed in the nuclear fraction (Fig. 2A). The expression levels shown in Fig. 2A were normalized to that of Gapdh and the values were plotted on a log scale where values below 0.001 were considered not expressed. For Xist, expression was observed only in the nuclear fraction while the values for the cytoplasmic fraction were below the threshold (Fig. 2A). Moreover, the primers employed for Xist were designed such that they would only detect successfully spliced RNAs, thereby eliminating any genomic DNA contribution. For Malat1, expression was enriched in the nuclear fraction, but it was also observed in the cytoplasmic fraction (Fig. 2A). This is consistent with previous reports that show that Malat1 does shuttle between the 2 fractions, but is predominantly localized in the nucleus.22 In the case of P25, levels of Xist were below the threshold in the nuclear fraction, which was not surprising, since the retinae used in this case were obtained from male mice and Xist is exclusively expressed in females. Regardless, the enriched levels of Malat1 in the nuclear fraction confirmed minimal contamination between the 2 fractions from P25 (Fig. 2A). The validation of the integrity of fractions across time also revealed the expression kinetics of these 2 genes. In this case, the expression kinetics for Xist and Malat1 were such that mRNA levels remained relatively steady across retinal development. While the differences in the levels of expression of Xist can vary based on the number of female retinae in the pool, the expression of Malat1 is not sex-linked. Thus, the trends observed for Malat1 reflected its transcription. For example, there was a ∼2.5 fold higher expression of Malat1 in the nuclear fraction than in the cytoplasmic fraction from E14 to P0 (Fig. 2A). However, this difference in expression between the nuclear and cytoplasmic fraction was reduced at P4 and P10 followed by an increase at P25 in the NE fraction (Fig. 2A).
The expression profile of Malat1 raised another issue regarding the quality of the cDNA as it relates to development, i.e. whether these changes are developmental or due to variation in cDNA quality. To address this issue, we interrogated the expression of fibroblast growth facto 15 (Fgf15) and rhodopsin (Rho) in all the fractions across development. Fgf15 expression is known to be high in embryonic development and fall during postnatal development23 while Rho expression begins around P0 and increases postnatally.24 Again, the qPCR results for Fgf15 and Rho were as predicted. Expression of Fgf15 and Rho intersected at P2 where Fgf15 levels were declining while levels of Rho were increasing (Fig. 2B). For both genes, relatively higher levels were observed in the nuclear fraction compared to the cytoplasmic fraction, which was also the case for Gapdh (data not shown). Interestingly, for Rho, the expression in the nuclear fraction approached the threshold around E18, and Rho levels in the cytoplasmic fraction mirrored this at P0 (Fig. 2B). In all, the retinal cDNA prepared had minimal cross-fractionation contamination, and it reflected expression profiles of known retinal genes. Therefore, these cDNA libraries were suitable for assessing the expression of histone genes.
Having confirmed the integrity our retinal cDNA libraries, we next sought to interrogate the expression kinetics of the histone genes. In order to profile histone gene expression, we selected several candidate genes for qPCR analysis from each histone gene family that met the following criteria. First, the availability of sequences to which qPCR-quality primers with the right Tm, GC contribution, no palindromic sequences, no self-annealing, and no hairpins could be designed. Second, the interrogated paralogs of a specific histone family should encode a specific protein variant. Third, the primers for qPCR should amplify only that paralog and not cross-hybridize to other members. Based on these criteria we found a limited number of genes from each of the 5 histone families to interrogate across retina development. For histone H1, we interrogated Hist1h1a, Hist1h1b, Hist1h1c, and Hist1h1e across retinal development (Fig. 3A). Overall, expression of Hist1h1a, Hist1h1b, and Hist1h1e was higher during embryonic development compared to Hist1h1c expression, which was ∼3 fold lower at E14 (Fig. 3A). In contrast, the expression of Hist1h1a, Hist1h1b, and Hist1h1e declined postnatally, while that of Hist1h1c was higher, with peak expression observed at P4 followed by a steady decline at P10 and P25 (Fig. 3A). Specifically, expression of Hist1h1a was highest at E14 followed by a steady decline, and its transcript levels were consistently higher in the cytoplasmic extract compared to the nuclear extract (Fig. 3A). In the case of Hist1h1b, expression remained steady from E14 to P2, followed by a precipitous fall at P4, where transcript levels in the nuclear fraction exceeded levels in the cytoplasmic fraction. This was followed by a steady decline at P10 and P25 (Fig. 3A). Similarly, Hist1h1e expression pattern followed the trends observed for Hist1h1b during embryonic development, except that it was expressed at a lower level than levels of cytoplasmic Hist1hb1 (Fig. 3A). However, during postnatal development the expression of Hist1h1e peaked at P4, to coincide with the peak of Hist1h1c, followed by a steady decline at P10 and P25 (Fig. 3A). Again the difference in transcript levels of Hist1h1e between the nuclear and cytoplasmic fractions was the largest at P4 (Fig. 3A).
Figure 3.

Histone mRNA expression across retinal development and fractions as determined by qPCR analysis. Shown here are graphs representing expression values determined by qPCR analysis, with the x-axis showing different time points at which the retinae were harvested. The y-axis is in log scale showing gene expression levels normalized to Gapdh values. Here the error bars represent the standard error of the mean. Dashed lines indicate expression levels of the genes tested in the nuclear fraction, while the solid lines represent expression in the cytoplasmic fraction. (A) Normalized expression of 4 H1 histone genes, including Hist1h1a (blue), Hist1h1b (black), Hist1h1e (green), and Hist1h1c (red). (B) Normalized expression of 3 H2a histone genes, including Hist3h2a (red), Hist1h2ac (blue), and Hist1h2ab (black). (C) Normalized expression of 3 H2b histone genes, including Hist2h2bb (red), Hist3h2ba (blue), and Hist2h2be (black). (D) Normalized expression of H3 histone genes, including all H3 histone genes (red), Hist1h3e and Hist1h3f (black), and Hist2h3c2 (blue). (E) Normalized expression of H4 histone genes, including Hist1h4d (red), Hist4h4 (black), and Hist1h4a (blue). (F) Additional validation of cDNA preparation across retinal development interrogated by the expression of Nr2e3 (red), Nrl (black), and Pax6 (green).
For histone H2a, we interrogated Hist3h2a, Hist1h2ac, and Hist1h2ab across retinal development. Overall, the expression of Hist3h2a and Hist1h2ab was 4-fold higher than Hist1h2ac, except at P0, when Hist3h2a and Hist1h2ab levels were 2-fold higher (Fig. 3B). Expression of both Hist3h2a and Hist1h2ab was similar in that the expression levels remained steady across postnatal development. Specifically, Hist3h2a expression dipped at E18, followed by a spike at P0, and then it remained steady during postnatal development. In contrast, expression of Hist1h2ab showed a steady increase in expression with a peak at P0, followed by a steady decline, but one that was not as drastic as the decline observed for the histone H1 genes examined (Fig. 3B). Finally, transcript levels of Hist1h2ac were not observed over the threshold at any time (Fig. 3B).
For histone H2b, we interrogated Hist2h2bb, Hist2h2be, and Hist3h2ba during retinal development. Overall, the expression of Hist3h2ba was 1-fold higher than the expression of Hist2h2bb or Hist2h2be (Fig. 3C). Specifically, Hist3h2ba expression dipped at E18 followed by a spike at P0 and then steady decline through P4. This was followed by an increase from P10 to P25 (Fig. 3C). Also, the transcript levels of Hist3h2ba were consistently higher in the cytoplasmic extract compared to the nuclear extract, which was not observed for Hist2h2bb or Hist2h2be at E16, P4, P10, and P25 (Fig. 3C).
For histone H3 genes, we were able to design only a single primer pair that could meet the aforementioned criteria, and it was for Hist2h3c2. Regardless, we designed 2 additional primer pairs, of which the first could hybridize to Hist1h3e and Hist1h3f and the second set could bind to all of the H3 genes. Overall, the expression of all H3s was such that it was high embryonically and peaked at P0, with a steady decline postnatally. Specifically, expression of Hist2h3c2 was high embryonically with a dip at E18, followed by a spike at P0 and a steady increase postnatally (Fig. 3D). A similar expression pattern was observed for Hist1h3e&f, albeit at a lower level (Fig. 3D). Interestingly, RNA for Hist1h3e&f and Hist2h3c2 were highly enriched in the nuclear fraction compared to the cytoplasmic fraction, except for Hist1h3e&f at E18 (Fig. 3D). Finally, for Hist2h3c2, expression was only above threshold in both nuclear and cytoplasmic fractions after P10 followed by increased expression at P25 (Fig. 3D).
For histone H4 genes, we interrogated Hist1h4a, Hist1h4d, and Hist4h4 across retinal development (Fig. 3E). Overall, the expression Hist1h4a, Hist1h4d, and Hist4h4 genes showed the same pattern across retinal development (Fig. 3E). Moreover, their transcript levels were consistently higher in the cytoplasmic extract compared to the nuclear extract, except for Hist4h4 at P25 when it was reversed (Fig. 3E). Specifically, expression of all 3 H4 genes, like that of Hist3h2a and Hist3h2ba, dipped at E18 followed by a spike at P0 and then a steady decline during postnatal development.
For most histone genes tested by qPCR, we observed that their transcript levels were comparatively very low at E18 and very high at P0. In order to ensure that it was not an artifact of RNA preparation, we further tested our fractionated RNA samples (n = 3) by examining expression of known genes. We analyzed 3 genes, Nr2e3 and Nrl, which are known to be expressed at late embryonic and postnatal time points,15-17 and Pax6, which is known to be expressed across retinal development25-27 (Fig. 3F). As predicted, we found that Nr2e3 and Nrl transcript levels were very low at E14 and E16 but were considerably high from E18 onward, with a steady increase through all postnatal time points examined. Nuclear transcript levels were higher than cytoplasmic levels at E14 and E16. The Pax6 expression levels were high at E18 and low at P0, which further confirmed that histone expression levels were not due to artifacts of RNA preparation (Fig. 3F).
Our qPCR analysis reported the levels of histone transcripts in nuclear and cytoplasmic extracts across retinal development. To understand the export kinetics of histone mRNA during development, we further analyzed the qPCR data for representative genes from each family, except for H3, where our primer pairs hybridized with all H3 transcripts. Here, we found that Hist1h1b transcripts were predominantly in the cytoplasmic extract relative to the nuclear extract, and the pattern continued until postnatal day 2, which is in agreement with previous reports of efficient histone transport (Supplementary Fig. S2A). Hist1h1b levels were also higher in the cytoplasm than the nucleus at P10. However, at P4 and P25, there were higher levels of transcript observed in the NE compared to the CE (Supplementary Fig. S2A). A similar pattern was observed for Hist3h2a, where the CE had higher transcript levels compared with the NE from E14 until P2 (Supplementary Fig. S2B). Like Hist1h1b, at P4 the ratio of Hist3h2a transcripts in the cytoplasm and nuclear extracts began to shift, although not enough for the majority of transcripts to be nuclear. At P10 and P 25, higher levels of Hist3h2a were detected in the NE compared to the CE (Supplementary Fig. S2B). This, however, was not the case for Hist2h2bb, where higher transcript levels in the NE were observed as early as E16, followed by a shift toward higher levels in the CE from E18 to P2 (Supplementary Fig. S2C). Interestingly, the levels in the NE were consistent with the previously mentioned histone genes in the postnatal retina, except that the NE levels were significantly higher than the CE levels (Supplementary Fig. S2C). The transcript levels for Hist1h4d were consistently higher in the CE compared to the NE from E14 to P25, which differed from the pattern observed for the 3 aforementioned histone genes (Supplementary Fig. S2D). Finally, we also mined our deep sequence data for the P0 CE and P0 NE data (reported elsewhere) for these 4 histone genes and found that the transcript levels in the P0 CE vs. P0 NE were in agreement with our qPCR data at P0 (Supplementary Figs. S2A–D).
Figure 5.
Spatiotemporal expression analysis by in situ hybridization for Hist1h1c across retinal development. In situ hybridization with DIG-labeled anti-sense RNA probe detecting Hist1h1c across retinal development from E14 to P14. (A) Hist1h1c in situ signal in E14 section including the brain and retina. (A′), (A″), and (A’″) are magnified images of the boxes around the retina in (A), the retina in (A′), and the brain in (A), respectively. (B) Hist1h1c in situ signal in E16 section including brain and retina. (B′), (B″), and (B′″) are magnified images of the boxes around the retina in (B), the peripheral retina in (B′), and the brain in (B), respectively. (C) Hist1h1c in situ signal in E18 section including brain and retina*. (C′) and (C″) are magnified images of the boxes around the retina in (C) and the peripheral retina in (C′), respectively. (C″′) Hist1h1c in situ signal in the brain at E18. (D) Hist1h1c in situ signal in P0 retinal section. (D′) and (D″) are magnified images of the central and peripheral retina from (D), respectively. (E) Hist1h1c in situ signal in P3 retinal section. (E′) and (E″) are magnified images of the central and peripheral retina from (E), respectively. (F) Hist1h1c in situ signal in P7 retinal section. (F′) and (F″) are magnified images of the central and peripheral retina from (F), respectively. (G) Hist1h1c in situ signal in P14 retinal section.
Replication-dependent histone mRNAs are expressed in progenitor cells and retinal neurons during development
The qPCR analysis revealed a dynamic transcription pattern of the different histone genes during retinal development. However, it only revealed the presence/absence of a transcript, not the specific cell types of the retina that express these genes. Additionally, expression of specific histone genes was gradually increasing after P10 (Fig. 3), when there are no cycling cells.28 Together, it suggested that replication-dependent histone genes might not be restricted to dividing cells and that they might be transcribed in differentiating retinal neurons. To address this issue, we employed section in situ hybridization (ISH) across retinal development starting with E14, E16, E18, P0, P3, P7, and P14 using probes specifically designed for Hist1h1c, Hist1h2ab, Hist3h2ba, Hist1h3a, and Hist4h4. However, given the similarity of the nucleotide sequences among the paralogs of a given histone family, 3 of the probes tested here, Hist1h2ab, Hist3h2ba, and Hist1h3a, would cross-hybridize to the transcripts of other members of that family (Table S5).
H3 ISH
At E14, ISH analysis showed expression of H3 in progenitor cells toward the peripheral retina and asymmetric enrichment toward the vitreal side of the developing retina (Figs. 4A′ and A″). At E16, expression of H3 in progenitor cells continued in the outer neuroblastic layer (ONBL). Again, expression of H3 in the peripheral retina was enriched asymmetrically toward the vitreal side of the retina (Figs. 4B and B′). In addition, H3 expression was observed elsewhere in the brain (Fig. 4B″). At E18, expression of H3 in progenitor cells continued in the ONBL across the whole retina (Fig. 4C). Moreover, the ISH signal for H3 was enriched in cells asymmetrically toward the apical end of the retina (Figs. 4C′ and C″), where the retinal progenitor cells undergo the M-phase of their cell cycle.11,29 A similar expression pattern was observed elsewhere in the brain, where the signal was enriched asymmetrically in a sub-population of cell (Figs. 4D and D′), possibly either in M-phase or exiting the cell cycle. During postnatal development, H3 mRNA was again observed in proliferating progenitor cells, and the ISH signal was enriched toward the lower part of the ONBL at P0 and P3 (Figs. 4E and F). Specifically, at P0, H3 mRNA was highly enriched in the central retina compared to the peripheral retina (Figs. 4E′ and E″). At P3, the signal was highly enriched in the periphery compared to the central retina. The latter was in agreement with the decrease in progenitor population in the center compared to the periphery (Figs. 4F′ and F″). At P7, H3 ISH signal was enriched in progenitor cells in the peripheral retina; however, in the central retina, its expression was asymmetrically enriched in the GCL and amacrine cells of the INL (Figs. 4G–G″). Finally, at P14, H3 expression was enriched in the INL across the whole retinal section with very little signal observed in the photoreceptor layer (Fig. 4H).
Figure 6.

Cell type-specific expression of histone genes by single-cell microarray analysis. Shown here is a heat map (blue = high, yellow = low) reflecting expression of different histone genes within specific cells at different time points (embryonic and postnatal). GC = ganglion cell, AC = amacrine cell, BP = bipolar cell, MG = Müller glia.
Hist1h1c ISH
At E14, Hist1h1c mRNA was enriched in progenitor cells toward the peripheral retina and there the mRNA was enriched asymmetrically toward the vitreal side of the developing retina (Fig. 5A–A″). A similar expression pattern was observed elsewhere in the brain, where it was asymmetrically enriched in a small population of cells (Fig. 5A″′). At E16, expression of Hist1h1c in progenitor cells continued as it was observed in the ONBL where progenitor cells reside, but not in the newly formed GCL (Fig. 5B). Again, expression of Hist1h1c in the peripheral retina was enriched asymmetrically toward the vitreal side of the retina (Fig. 5B′ and B″). Moreover, Hist1h1c was also observed toward the apical end in cells evenly distributed across the whole retinal section. Like E14, expression of Hist1h1c at E16 was also observed elsewhere in the brain and was highly expressed in a subpopulation of cells (Fig. 5B″′). At E18, Hist1h1c expression was observed in progenitor cells and was also enriched in the peripheral retina, but it was toward the apical end of the retina (Fig. 5C–C″). During postnatal development, Hist1h1c expression was enriched in proliferating progenitor cells, and the ISH signal was enriched toward the lower part of the ONBL at P0 (Fig. 5D). Specifically, expression level was higher in the periphery compared to the central retina, which was in agreement with the decrease in progenitor population in the center compared to the periphery (Fig. 5D′ and D″). This trend continued at P3 and P7 (Fig. 5E and F), except that at P7, expression was also observed in cells that were most likely bipolar cells, based on their localization (Fig. 5F′ and F″). Finally, at P14, expression of Hist1h1c was observed in the outer plexiform layer and in photoreceptor cells, which were most likely rods and cone photoreceptors (Fig. 5G).
Hist4h4 ISH
At E14, ISH analysis showed expression of Hist4h4 in progenitor cells with enrichment of signal in puncta toward the apical end in the peripheral retina (Supplementary Figs. S3A–A′). Similar expression was observed at E16, except the puncta observed at E14 in the periphery were now observed across the entire retina (Supplementary Figs. S3B and B′). Again, like H3, expression of Hist4h4 was observed in specific brain regions, where cells appeared to be migrating away from the dividing progenitor pool (Supplementary Figs. S3B″ and B″). At E18, expression was again observed in progenitor cells in the ONBL, except the puncta observed at E16 were not observed (Supplementary Figs. S3C and C). Elsewhere in the brain, cells expressing Hist4h4 all appeared to be migrating (Supplementary Figs. S3C′ and C′″). At P0, expression was highly enriched in progenitor cells (Supplementary Fig. S3D), and the pattern continued at P3 with a central to peripheral gradient (Supplementary Figs. S3E–E″). At P7, Hist4h4 ISH signal was enriched in few cells of the INL, which, by their location, were most likely amacrine cells and also toward the apical part of the ONL (Supplementary Fig. S3F). The cells in the apical end of the ONL, by their position, were most likely differentiating photoreceptors (Supplementary Fig. S3F). Finally, at P14, robust Hist4h4 expression was observed in all of the retinal neurons (Supplementary Figs. S3G–G″).
Figure 7.

Expression of replication-dependent histone genes in the aging retina. Shown here is the heat map reflecting expression values (blue = high, yellow = low) of histone transcripts as observed by microarray analysis. Genes with known expression kinetics in the retina were used to contextualize the expression of the histone genes and are shown in red.
H2a ISH
Section ISH showed that H2a mRNA was not restricted to progenitor cells during embryonic development at E14, E16, and E18 (Supplementary Fig. S4A–C). Expression at E18 appeared to be highly enriched in differentiating neurons and in cells at the apical end, which might be RPE cells and/or cells at the M-phase of the cell cycle (Supplementary Figs. S4C′ and C″). Expression in ganglion cells continued at P0 (Supplementary Figs. S4D and D′), but was not observed at P3, where only the progenitor cells showed H2a expression (Supplementary Fig. S4E). Specifically, at P3, H2a mRNA was highly enriched in the peripheral retina compared to the central retina (Supplementary Figs. S4E′ and E″). This is in agreement with the decrease in progenitor population in the center compared to the periphery. At P7 and P14, H2a ISH signal was observed in all 3 layers of retina but was enriched in the GCL and some cells in the INL, which were possibly horizontal cells based on their location (Supplementary Fig. S4F and G).
Figure 8.

Cyclin and histone transcription in rapamycin-treated retinae. (A) Validation of rapamycin treatment shown by immunoblot analysis, using rabbit α-pS6240/244 (1:1000; Cell Signaling) antibody. Total S6 detected by rabbit α-S6 (1:1000; Cell Signaling) antibody used as the loading control. (B) Shown are normalized fold expression changes as detected by qPCR analysis in untreated (ctrl) and rapamycin-treated (rap) for Ccnd1, Ccne1, Ccne2, and Npat. Normalized fold expression of the various histone genes in ctrl and rap detected by qPCR for Hist1h1a, Hist1h1c (C); Hist1h2ab, Hist3h2a (D); Hist2h2be, Hist3h2ba (E); Hist2h3c2, all H3s (F); and Hist1h4a and Hist4h4 (G). All qPCR values for ctrl (n = 3) and rap (n = 4) were first normalized to the geometric mean of Gapdh values, followed by averaging and 2-tailed t-test, which showed no statistical significance for all values shown. (H) Gapdh, Ccnd1, Ccne1, and Ccne2 expression levels detected in the microarray analysis of the aging retina.
H2b ISH
Section ISH of H2b gene showed a similar trend to that of H2a (Supplementary Fig. S5). At E14, H2b gene expression was enriched in progenitor cells, but the mRNA was again asymmetrically enriched toward the vitreal side and the apical side of the developing retina (Supplementary Fig. S5A–A″). The apical enrichment is likely in the RPE cells. A similar pattern was observed at E16, where expression of H2b in progenitor cells was observed in the ONBL and was enriched in the newly formed GCL (Supplementary Fig. S5B–B″). At E18, ISH signal for H2b was enriched in the ONBL compared to the GCL (Supplementary Fig. S5C–C′). During postnatal development, H2b mRNA was again observed in proliferating progenitor cells that reside in the ONBL at P0 and P3 (Supplementary Figs. S5D and E). Specifically, at P0, H2b mRNA was highly enriched in the periphery compared to the central retina (Supplementary Figs. S5D′ and D″), while at P3, few cells showed expression in a central to peripheral gradient (Supplementary Fig. S5E–E″). At P7, H2b ISH signal was enriched in few cells of the INL, which, by their location, are most likely horizontal cells (Supplementary Fig. S5F). Like H2a, H2b ISH signal was observed in all 3 layers of retina but was enriched in the GCL and some cells in the INL at P14 (Supplementary Fig. S5G).
Figure 9.

Variant nucleosome model. Shown here is the schematic of DNA wrapped around the core octamer and connected to the linker histone. Shown here are pie charts reflecting the total mRNA contributions (qPCR data) of the different histone isotypes to the total RNA of that histone family across retinal development. (A) Relative contributions of Hist1h1a (blue), Hist1h1b (red), Hist1h1e (green), and Hist1h1c (purple) to the production of the linker histone H1 across retinal development. (B) Relative contributions of Hist1h2ab (green), Hist3h2a (blue), and Hist1h2ac (red) to the production of the core histone H2a across retinal development. (C) Relative contributions of Hist3h2ba (red), Hist2h2bb (blue), and Hist2h2be (green) to the production of the core histone H2b across retinal development.
Replication-dependent histone genes are differentially expressed among the different cell types of the retina
ISH analysis revealed expression of the different histone genes in subtypes of differentiating retinal neurons. Therefore, we sought to investigate whether the histone isotypes are differentially expressed among the different neurons at the same developmental time point. For this, we mined the published single-cell microarray data from the Cepko laboratory.30-33 This analysis showed differential expression of the histone isotypes in single neurons profiled at different developmental stages starting at E12 through adult (Fig. 6). First, ganglion cells from E12, E13, E14, E15, E16, and P0 showed large variation in the subtype of histone genes that were expressed. For example, Hist2h2ab was expressed in most of the embryonic ganglion cells and P0, but not in the ganglion cell from E16. In contrast, expression of Hist1h2be was observed in the E16 ganglion cell, but not in the E14 or E15 ganglion cells. Similar variation was observed in amacrine and bipolar cells (Fig. 6). The most dramatic expression pattern was observed in the adult cone photoreceptor, in which expression of isotypes for all histone families except H4 was observed. In this cone photoreceptor, expression of specific histone isotypes, such as Hist2h2bb, was observed, but this was not the case for Hist1h2bp (Fig. 6). Expression of histone genes was significantly different in the adult rod photoreceptor compared to the adult cone photoreceptor in that very few histone isotypes were expressed in both, including Hist1h1c and Hist1h3a. Interestingly, the same histone isotypes were not observed in a developing rod photoreceptor cell from P5, which showed expression of Hist2h2ab, Hist1h2bp, and Hist1h2be, which were absent in the adult rod photoreceptor cell (Fig. 6). Finally, expression of H1, H2a, and H2b was observed in the P13 Müller glial cell, while expression of H3 and H4 isotypes was not observed. The microarray utilized for single-cell profiling does not have probe sets for every histone isotype. The data obtained for the subset of histone genes showed dynamic patterns of expression of histone genes among retinal neurons across time.
Replication-dependent histone genes are transcribed in the aging retina
Our qPCR analysis showed that replication-dependent histone genes are differentially transcribed in the retina long after cell proliferation has stopped (Fig. 3). Specifically, genes such as Hist2h3c2, Hist1h2ab, and Hist1h1c showed upward trends in expression at P25 (Figs. 3B–D). This observation was further confirmed by our in situ analysis, which showed expression of histone genes in differentiating neurons (Figs. 4 and 5; Supplementary Figs. S3–S5). Together, this suggested that the transcription of replication-dependent histone genes might continue throughout aging. To study this, we mined our microarray data obtained from retinae starting with P12, 5 weeks (w), 8 w, 9 w, 25 w, 40 w, and 75 w. First, we organized the microarray values for the histone genes within the context of the values obtained for genes with known expression patterns, such as Rho, Nrl, Nr2e3, Pax6, Gapdh, and Fgf15 (Fig. 7). The values for these genes were used as boundaries to define categories of histone genes that were expressed at high, intermediate, and low levels. The histone genes that were highly expressed included Hist1h2bc, Hist3h2a, and Hist1h1c, in that order, and were flanked by the expression values for Rho and Pax6 (Fig. 7). The histone genes that were expressed at intermediate levels included Hist3h2ba, Hist2h2aa1, Hist2h3c1, and Hist2h2be, in that order, and were flanked by the expression values for Pax6 and Gapdh. Hist1h4h, Hist1h2be, Hist1h3d, Hist2h2bb, Hist1h2bp, Hist1h1t, Hist1h4i, and Hist1h3i were expressed at low levels and were flanked by the expression values for Gapdh and Fgf15, which has been reported to be turned off in the adult retina.23 Thus, the genes with values below that of Fgf15, such as Hist1h4i, Hist1h1e, and Hist1h4f, were considered not expressed (Fig. 7). Most histone genes showed steady expression across time, except for Hist1h3d and Hist2h2bb, which showed an increase in expression at 75 w. Surprisingly, Hist1h1t, which has been reported to be a spermatozoa-specific histone, was expressed at 75 w18 (Fig. 7).
mTOR-mediated regulation of cyclins D1 and E is decoupled in retinal neurons
Our data thus far suggest that the transcription of replication-dependent histones is decoupled from cell cycle, which implies that neurons might lose histones due to chromatin remodeling and, as a result, there is active histone transcription in aging neurons. However, there is a second possibility: that replication-dependent histone transcription is being driven by the accumulation of cyclins in these aging neurons. Elevated expression of cyclins E, D, A, and B has been observed in differentiated neocortex neurons, and recent cell culture experiments have also shown that cyclins D1 and E accumulate in senescent cells.34,35 Previous studies have described a relationship between cyclin E and replication-dependent histone transcription, mediated by Cdk2 and Npat. In this pathway, cyclin E, when bound to Cdk2, activates the protein Npat, which then initiates the transcription of replication-dependent histones.36 Thus, senescence-driven cyclin E accumulation could drive replication-dependent histone expression in post-mitotic cells. Before testing this possibility, it is necessary to define “senescence.” In a senescent cell, its cell cycle is arrested and growth-promoting pathways, such as mTOR, remain active. As a result, the cell loses its ability to proliferate entirely. In a quiescent cell, the cell cycle is arrested, but growth-promoting pathways are inactive.37 Based on these definitions, neurons are senescent, as they have not been shown to have the potential to enter cell cycle and also possess an active mTOR pathway.38,39 In cell culture, Leontieva et al. were able to show that treatment with rapamycin, an inhibitor of the mTOR pathway, resulted in a reduction in cyclins D1 and E.34 Given that cyclin E interacts with Cdk2 to activate Npat, a transcription factor that regulates histone transcription, we reasoned that mTOR inhibition in neurons might decrease transcription of replication-dependent histones. To test this idea, we treated adult mice with rapamycin or carrier for 5 days by IP injections. The retinae were harvested, and both protein and RNA were generated from these samples. To confirm the effectiveness of rapamycin in the inhibition of mTOR, we interrogated the phosphorylation of S6K, a key target of mTOR activity. We saw loss of S6K phosphorylation in rapamycin-treated to untreated samples, suggesting the effective downregulation of mTOR activity (Fig. 8A). This was followed by qPCR analysis on cDNA prepared from rapamycin-treated and untreated samples for cyclin D1 (Ccnd1), cyclin E1 (Ccne1), cyclin E2 (Ccne2), and Npat (Table S2). Here, we found no significant change in transcript levels for all 4 tested genes in the treated and untreated samples (Fig. 8B). This suggested that in the adult retina, inhibition of mTOR by rapamycin did not significantly alter transcription of targets observed in cell culture experiments. This result, in turn, predicted that we would not observe changes in replication-dependent histone transcription between the treated and untreated samples. To test this idea, we only selected histones that showed active transcription in the postnatal retina and performed qPCR on cDNA from treated and untreated samples. We tested 2 histone genes from each histone type. Hist1h1a and Hist1h1c were selected from the H1 histones, Hist1h2ab and Hist3h2a were selected from the H2a histones, Hist2h2be and Hist3h2ba were selected from the H2b histones, and Hist1h4a and Hist4h4 were selected from the H4 histones. For the H3 histones, we used the all H3s primer pair and the primer pair for Hist2h3c2. For all 10 histones tested, none showed a significant difference in normalized fold expression between the treated and untreated samples (Figs. 8C–G). To determine whether there is a change in cyclins during aging, we also interrogated our microarray data and found that Ccnd1, Ccne1, and Ccne2 remain relatively steady in expression, except for a slight inversion in Ccnd1 and Ccne1 where, at 75 weeks, Ccnd1 is upregulated while Ccne1 is further downregulated (Fig. 8H).
Discussion
The clustered organization of the different replication-dependent histone genes for the 5 different histone families has been thought to play a vital role in synchronized transcription of these genes to the S-phase of the cell cycle.3,14 However, our deep sequence data showed that not all histone genes are transcribed simultaneously at the same levels in either E16 or P0 retinae. This is in agreement with a recent report by Singh et al., which showed that H2A genes are differentially transcribed in cancer cells.40 This suggests that histone genes within clusters are also differentially transcribed and regulated during retinal development. For example, we did not observe expression of specific histone genes, such as Hist1h2aa (H2a), Hist1h2bq (H2b), and Hist2h3c1 (H3) (Figs. 1C–E). We also did not observe the expression of the spermatozoa-specific histone Hist1h1t (Fig. 1B).18,41 Thus, it is possible that these histone genes are expressed in other tissues and/or in the retina at a different time point. The utilization of a subset of histone genes within a family that encode a specific histone can have developmental consequences, since these subsets of genes encode different protein variants (Supplementary Fig. S1). For example, Hist2h2bb was expressed at a much higher level than Hist1h2bn (Fig. 1D), which suggests that, of the 2, Hist2h2bb is the predominant H2b protein in the nucleosome octamer. Amino acid sequence alignment of these 2 proteins shows that Hist2h2bb differs from Hist1h2bn at E3D, A23V, and S77G (Supplementary Fig. S1C). Thus, the constituent H2b proteins of the nucleosome at these developmental time points are a mix of different H2b variants. Similarly, differential expression of H2a and H3 family members was also observed, along with amino acid sequence variations for the different protein variants (Figs. 1C and E). For H4 histone genes, the expression kinetics of the different isotypes were not different, which was expected, since all of the H4 family members encode for proteins that are 100% identical (Fig. 1F). Interestingly, all of the H1 histone genes that are expressed in the retina show a great degree of variation in their amino acid sequences (Supplementary Fig. S1A). Thus, the H1 variant that is used as the linker for the nucleosome octamers could impact higher-order chromatin organization, which in turn could influence gene expression. In all, our data suggest that the nucleosome at a specific developmental time can be composed of an assortment of histone variants for H1, H2a, H2b, and H3.
The differential contribution of the different histone isotypes to the production of the nucleosome during development was further confirmed by our qPCR analysis across retinal development. This observation was underscored by the expression kinetics of Hist1h1c compared to that of Hist1h1b (Fig. 3A). Specifically, Hist1h1b was expressed ∼3-fold higher than Hist1h1c from E14 to P2, at which point Hist1h1b expression began to decline while Hist1h1c expression spiked (Fig. 3A). This suggests that 2 genes within the same cluster must be controlled by a higher-order regulatory mechanism. Since these 2 genes encode for different H1 histone variants, our qPCR data suggest a dynamic switch in the expression of the gene contributing to the linker protein between P2 and P4. This observation is coincident with the initiation of terminal differentiation and the decline of the progenitor cell population, which was further reflected in our ISH results (Fig. 5).28 Here we observed expression of Hist1h1c at P14 in differentiating photoreceptor cells (Fig. 5G). The expression of Hist1h1c in photoreceptor cells is in accord with a recent publication that showed that Hist1h1c regulates the condensation of chromatin in rod photoreceptor cells.42
Similarly, for H2a, we observed dynamic expression of Hist3h2a and Hist1h2ab, which encode different H2a variants. For example, at E18, the expression of Hist1h2ab was elevated, while that of Hist3h2a expression was significantly lower (Fig. 3B). This difference in expression suggests differential contribution of these 2 genes toward the production of the H2a proteins incorporated into the nucleosome. This phenomenon is also observed at later time points, suggesting the existence of variant nucleosomes throughout retinal development. For H2b, H3, and H4, the expression of all genes examined showed similar patterns in that they all showed a dip in expression at E18, followed by a spike at P0 (Figs. 3C–E). This suggests the possibility of the existence of a regulatory mechanism that represses transcription of histone genes at a very critical time in development, i.e., birth. The drop in transcription prior to birth was specific to these histone genes, as genes with known expression profiles, including Nr2e3, Nrl, and Pax6,15–17,25,26 and other histone genes, such as Hist1h1b and Hist1h2ab, did not show a drop in expression at E18 (Figs. 3A, B, and F). Moreover, for all 5 histone protein families, specific genes showed an upward trend in expression levels between P10 and P25 (Fig. 3). For example, all examined H2a genes and Hist2h3c2 showed an increase in expression between P10 and P25 (Fig. 3B). Given that there are no progenitor cells dividing at this stage, expression of these replication-dependent histone genes must occur in differentiating neurons. Indeed, like Hist1h1c (Fig. 5), our ISH results showed expression of H3 and H2b in bipolar, amacrine, and ganglion cells in the P14 retina (Fig. 4; Supplementary Fig. S5). Similarly, expression of Hist4h4 was observed in newly differentiating photoreceptors at P7, and then it was panretinal, i.e., in all retinal layers, at P14 (Supplementary Fig. S3). The expression of all the histone genes tested by qPCR and ISH strongly suggests the continued expression of replication-dependent histone genes in differentiating neurons.
Another important feature of replication-dependent histone genes is that their mRNA is efficiently transported to the cytoplasm. Histone transcripts do not have a poly-A tail; instead, their 3′ UTR has a hairpin loop structure to which transacting factors, such as SLBP and U7 snRNA, bind and mediate export.14 This efficient export mechanism affords dividing cells the ability to produce large amounts of histone proteins.14 Indeed, our observation of higher transcript levels in the CE compared to the NE during early retinal development for the histone genes examined is in agreement with this idea. However, during postnatal development starting with P4, there were higher transcript levels in the NE compared to the CE for most of the histone genes examined (Supplementary Fig. S2). This is coincident with a decrease in progenitor cell population and the initiation of retinal differentiation.28 Thus, it is possible that the histone transcript export might be regulated like that of other protein-coding transcripts in differentiating neurons, as the demand for histones might be lower than for a progenitor cell. Another possibility is that the turnover of the histone transcripts in the CE increases in differentiating neurons compared to turnover in progenitor cells. In either case, our results show a dynamic shift in histone mRNA transport and turnover between progenitor cells and neurons.
In all, we observed differential spatiotemporal expression of histone isotypes encoding different histone variants in the developing retina. Based on this, here we propose a model of a variant nucleosome that consists of histone variants of H1, H2a, and H2b. This model does not include H3, even though H3 has 2 different replication-dependent protein variants, because our primer pairs do not distinguish transcripts from genes that encode these 2 variants. In this model, for the 4 tested genes in the H1 family, we propose that the mRNA contribution shifts from predominantly Hist1h1b and Hist1h1a during embryonic development to Hist1h1c and Hist1h1e after P4 (Figs. 3A and 9A). Interestingly, for H2a, of the 3 genes we examined, the predominant contribution across development was observed for Hist1h2ab (Figs. 3B and 9B). However, the overall percentage of Hist1h2ab and Hist3h2a changed over time. Similarly, for H2b, the predominant contribution across development was observed for Hist3h2ba, and the overall percentage of Hist3h2ba, Hist2h2bb, and Hist2h2be changed over time (Figs. 3C and 9C). It must be noted that the model we designed is only based on the genes we were able to interrogate via qPCR. However, one could imagine that the complexity of this model would increase significantly if the expression of all the isotypes were considered across development.
Our model predicts variant nucleosomes across time, but our ISH results also suggested that variant nucleosomes might exist among the different retinal cell types at a given time point. Indeed, interrogation of the single-cell microarray data supports this possibility, as cell type-specific expression of histone isotypes is observed. For example, Hist1h1c, which was expressed in photoreceptor cells according to ISH (Fig. 5), showed high expression in the 2 adult rod and cone photoreceptor cells, while expression was not observed in ganglion and amacrine cells from E12, E13, E14, E15, E16, and P0 (Fig. 6). In contrast, Hist3h2a was observed in all of the single cells tested, except for the ganglion cell at P0 and the adult rod photoreceptor (Fig. 6). This data set further confirms the possibility of variant nucleosomes within the different neurons of the retina, which in turn could inform the specific transcriptome profiles necessary for the differentiation/function of these neurons.
The persistent expression of the replication-dependent histone isotypes post-development was an intriguing observation, which was further confirmed by our microarray analysis of the aging retina. Here, we found a subset of histone genes that were expressed at levels above Gapdh and Pax6, suggesting high demand for these histone protein variants (Fig. 7). The decoupling of the transcription of a subset of replication-dependent histones and cell cycle warrants a change in the nomenclature for these specific histone isotypes. While these isotypes are linked to cell cycle early in development, their transcriptional regulation in neurons suggests independent mechanisms of regulation, one in progenitor cells and the other in neurons. Another possibility is that the transcription of this subset of genes is regulated similarly to the other histones in progenitor cells, except that they are not turned off in neurons. The specific pathway that ensures the transcription of this subset of histones in neurons is also not directly linked to the mTOR pathway that, in neurons, is shown to operate other biological processes, such as neuromodulation.39,43 One possibility is that the age-related changes in the chromatin require exchange of these histones, as has been described for replacement histones,44,45 except that here we show a similar phenomenon for replication-dependent histones. Indeed, recent reports show that while some histone proteins are long-lived, such as H3.3, others, including H2a and H2b, are actively translated.8
The significance of our findings is that replication-dependent histone genes are actively transcribed in non-dividing cells, i.e., neurons. Moreover, we show that there is dynamic expression of the different isotypes, which might contribute to the production of a variant nucleosome within cell types across time. This suggests that the histone function is subcompartmentalized by the differential transcription regulation of the various paralogs. This in turn might inform chromatin organization and transcriptional profiles of the different retinal cell types. Indeed, recent publications show that single point mutations at the amino acids that are specific to histone variants cause cancers, such as carcinoma of the endometrium, large intestine, lung, and breast tissue and lymphoid neoplasm of heamatopoietic and lymphoid tissue (Table S6).46,47 Recent publications further underscore the importance of investigating specific replication-dependent histone genes.12,13 Here, they found that a point mutation in either H3F3A, a replacement histone gene, o HIST1H3B, a replication-dependent histone gene, was observed in nearly 80% of pediatric diffuse intrinsic pontine gliomas (DIPGs) and 22% of non–brain stem gliomas. In addition, a recent study showed that siRNA knockdown of replication-dependent HIST1H2AC gene leads to the increased rates of cell proliferation and tumorigenicity.40 These findings, along with our observation of the continued expression of replication-dependent histone genes in retinal neurons across development and aging, show the need to further investigate the regulation of the different replication-dependent histone isotypes.
Materials and Methods
Animal procedures
All experiments used CD1 mice from Charles River Laboratory, MA. All mice procedures were compliant with the protocols approved by the University of Connecticut's Institutional Animal Care and Use Committee (IACUC).
Fractionation and cDNA preparation
CD1 mice retinae were collected at different developmental time points. Retinal RNA isolation was performed using the Thermo Scientific NE-PER Nuclear and Cytoplasmic Extraction Kit (Thermo Fisher Scientific, 78833*) with the following modifications. Approximately 20 retinae at E14, E16, E18, and P0; 8–15 retinae at P2 and P4; 6–8 retinae at P10 and P14; and 2–4 retinae at P25 were used for fractionation. The retinae were harvested in PBS pH 7.4 and washed once in a microfuge tube followed by centrifugation at 4°C for 30 seconds. After aspirating the PBS out of the tube, the retinae were resuspended in 500 μL of CER-I reagent from the NE-PER kit followed by the addition of 5 μL 1M DTT and 10 μL of RNase Inhibitor (Roche, 03335402001). The retinae were then vortexed for 15 seconds at room temperature followed by incubation on ice for 10 minutes. Subsequently, 27.5 μL of Cer-II (NE-PER Kit) was added followed by vortexing for 5 seconds and incubation on ice for 1 minute. The lysed retinae with intact nuclei were then centrifuged at 14,000 rpm for 10 minutes at 4°C. The supernatant, which was the cytoplasmic extract, was then mixed with 500 μL of TRIzol followed by RNA preparation as per the manufacturer's instructions. The nuclei were obtained as a pellet, which was resuspended in 500 μL of TRIzol followed by sonication to lyse the nuclei. This step was followed by RNA preparation as per the manufacturer's instructions. 1 μg of retinal RNA was used for cDNA synthesis.48
Deep sequencing
Fractionated cytoplasmic RNA of E16 and P0 retinal time points was used for RNAseq on the Illumina HighSeq 2000 platform.
qPCR
qPCR was performed in 20 μL reactions containing 30 p.mol. of each primer, 1 μL of diluted (1:100) cDNA template, and 10 μL of SsoFastTM EvaGreen® Supermix (Bio-Rad, 172–5203) using the CFX96 Touch™ Real-Time PCR Detection System (Bio-Rad, 185–5195). All reactions were formed in triplicate by using qPCR protocol as seen in Table S2. Xist and Malat1 primers were used to validate cDNA fractionation. Primers for Fgf15, Rho, Nr2e3, Nrl, and Pax6 were used to verify cDNA quality. Primers for 16 histone genes across all 5 histone groups were designed to examine histone expression trends throughout development (Table S3). Gapdh was used for normalization, as suggested by a recent publication for retina.49 The analysis was performed by the 2(-delta delta Cq) method.50
In situ hybridization
Sixteen μm cryosections of CD1 mouse heads (for embryonic time points) and retinae (for postnatal time points) were used for in situ hybridization as previously described.30 Five DIG-labeled antisense probes against Hist1h1c, Hist1h2ab, Hist3h2ba, Hist1h3a, and Hist4h4 mRNA were created from PCR amplified product. Each probe was created by adding T7 and SP6 sites onto their respective qPCR primer sequences (Table S4). To determine probe specificity, we performed BLAST analysis. We found that except for the H1 and H4 probes, H3, H2a, and H2b probes can hybridize with various histone isotypes within their families (Table S5).
Microarray
Three to 4 retinae from each time point were used for RNA extraction with Trizol, as per the manufacturer's instructions (Invitrogen, 15596-026). A minimum of 3 arrays were analyzed per time point, including P12, 5 weeks (w), 8w, 9w, 25w, 40w, and 75w. The microarray platform utilized and the bioinformatics analysis performed were the same as described previously.51 The microarray platform did not include probes for all histone isotypes.
Rapamycin treatment
Rapamycin (LC Laboratories) stock was diluted at 10 mg/mL in 50% ethanol. For intra-peritoneal injections, the stock was further diluted to 2.5 mg/mL in 50% ethanol. Adult (9 week) CD1 mice (n = 4) were injected daily with rapamycin at a concentration of 3 μg/g body weight for 5 days. Control mice (n = 3) were injected with equivalent volumes of 50% ethanol. Retinae were harvested 5 hours after the fifth injection.
Protein and RNA extraction
Retinae were dissected in ice-cold 1x PBS. From each mouse, one retina was placed in 250 μL of TRIzol (Life Technologies), and the other was sonicated in 100 μL RIPA buffer containing protein and phosphatase inhibitors (Roche; cOmplete: protease inhibitor cocktail; and PhosStop: phosphatase inhibitor cocktail). RNA extraction was performed according to the manufacturer's instructions. The sonicated sample was centrifuged at 10,000 RPM for 10 minutes at 4°C, and the supernatant was collected into a fresh tube.
Western blot analysis
Protein extracts (10 μg) were resolved on a 4–20% Tris-Glycin gradient gel (BioRad), followed by immunoblot analysis, as described previously.52 The following primary antibodies were used: rabbit α-pS6240/244 (1:1000; Cell Signaling) and rabbit α-S6 (1:1000; Cell Signaling).
Funding Statement
The funding of this research was provided by P30 from National Institute of Neurological Disorders and Stroke 5P30NS069266 and K99-R00 from the National Eye Institute 4R00EY019547.
Disclosure of Potential Conflicts of Interest
No potential conflicts of interest were disclosed.
Acknowledgments
We would like to thank Dr. Constance Cepko, in whose laboratory at the Harvard Medical School (Boston, MA) the aging microarray analysis was performed.
Supplemental Materials
Supplemental data for this article can be accessed on the publisher's website.
References
- 1. Ohno S. Evolution by Gene Duplication. Berlin, New York: Springer-Verlag; 1970 [Google Scholar]
- 2. Jia Y, Mu JC, Ackerman SL. Mutation of a U2 snRNA gene causes global disruption of alternative splicing and neurodegeneration. Cell 2012; 148:296–308; PMID: 22265417; http://dx.doi.org/ 10.1016/j.cell.2011.11.057 [DOI] [PMC free article] [PubMed] [Google Scholar]
- 3. Marzluff WF, Gongidi P, Woods KR, Jin J, Maltais LJ. The human and mouse replication-dependent histone genes. Genomics 2002; 80:487–98; PMID: 12408966; http://dx.doi.org/ 10.1006/geno.2002.6850 [DOI] [PubMed] [Google Scholar]
- 4. Chen M, Licon K, Otsuka R, Pillus L, Ideker T. Decoupling epigenetic and genetic effects through systematic analysis of gene position. Cell Rep 2013; 3:128–37. PMID: 23291096; http://dx.doi.org/ 10.1016/j.celrep.2012.12.003 [DOI] [PMC free article] [PubMed] [Google Scholar]
- 5. Wu RS, Kohn KW, Bonner WM. Metabolism of ubiquitinated histones. J Biol Chem 1981; 256:5916–20; PMID: 6263895 [PubMed] [Google Scholar]
- 6. Harris ME, Bohni R, Schneiderman MH, Ramamurthy L, Schumperli D, Marzluff WF. Regulation of histone mRNA in the unperturbed cell cycle: evidence suggesting control at two posttranscriptional steps. Mol Cell Biol 1991; 11:2416–24; PMID: 2017161 [DOI] [PMC free article] [PubMed] [Google Scholar]
- 7. Manske M, Miotto O, Campino S, Auburn S, Almagro-Garcia J, Maslen G, O'Brien J, Djimde A, Doumbo O, Zongo I, et al. Analysis of Plasmodium falciparum diversity in natural infections by deep sequencing. Nature 2012; 487:375–9; PMID: 22722859; http://dx.doi.org/ 10.1038/nature11174 [DOI] [PMC free article] [PubMed] [Google Scholar]
- 8. Toyama BH, Savas JN, Park SK, Harris MS, Ingolia NT, Yates JR, 3rd, Hetzer MW. Identification of long-lived proteins reveals exceptional stability of essential cellular structures. Cell 2013; 154:971–82; PMID: 23993091; http://dx.doi.org/ 10.1016/j.cell.2013.07.037 [DOI] [PMC free article] [PubMed] [Google Scholar]
- 9. Alexiades MR, Cepko CL. Subsets of retinal progenitors display temporally regulated and distinct biases in the fates of their progeny. Development 1997; 124:1119–31; PMID: 9102299 [DOI] [PubMed] [Google Scholar]
- 10. Rapaport DH, Wong LL, Wood ED, Yasumura D, LaVail MM. Timing and topography of cell genesis in the rat retina. J Comp Neurol 2004; 474:304–24; PMID: 15164429; http://dx.doi.org/ 10.1002/cne.20134 [DOI] [PubMed] [Google Scholar]
- 11. Young RW. Cell differentiation in the retina of the mouse. Anat Rec 1985; 212:199–205; PMID: 3842042; http://dx.doi.org/ 10.1002/ar.1092120215 [DOI] [PubMed] [Google Scholar]
- 12. Wu G, Broniscer A, McEachron TA, Lu C, Paugh BS, Becksfort J, Qu C, Ding L, Huether R, Parker M, et al. Somatic histone H3 alterations in pediatric diffuse intrinsic pontine gliomas and non-brainstem glioblastomas. Nat Genet 2012; 44:251–3; PMID: 22286216; http://dx.doi.org/ 10.1038/ng.1102 [DOI] [PMC free article] [PubMed] [Google Scholar]
- 13. Lewis PW, Muller MM, Koletsky MS, Cordero F, Lin S, Banaszynski LA, Garcia BA, Muir TW, Becher OJ, Allis CD. Inhibition of PRC2 activity by a gain-of-function H3 mutation found in pediatric glioblastoma. Science 2013; 340:857–61; PMID: 23539183; http://dx.doi.org/ 10.1126/science.1232245 [DOI] [PMC free article] [PubMed] [Google Scholar]
- 14. Jaeger S, Barends S, Giege R, Eriani G, Martin F. Expression of metazoan replication-dependent histone genes. Biochimie 2005; 87:827–34; PMID: 16164992; http://dx.doi.org/ 10.1016/j.biochi.2005.03.012 [DOI] [PubMed] [Google Scholar]
- 15. Liu Q, Ji X, Breitman ML, Hitchcock PF, Swaroop A. Expression of the bZIP transcription factor gene Nrl in the developing nervous system. Oncogene 1996; 12:207–11; PMID: 8552394 [PubMed] [Google Scholar]
- 16. Cheng H, Khanna H, Oh EC, Hicks D, Mitton KP, Swaroop A. Photoreceptor-specific nuclear receptor NR2E3 functions as a transcriptional activator in rod photoreceptors. Hum Mol Genet 2004; 13:1563–75; PMID: 15190009; http://dx.doi.org/ 10.1093/hmg/ddh173 [DOI] [PubMed] [Google Scholar]
- 17. Chen J, Rattner A, Nathans J. The rod photoreceptor-specific nuclear receptor Nr2e3 represses transcription of multiple cone-specific genes. J Neurosci: Off J Soc Neurosci 2005; 25:118–29; PMID: 15634773; http://dx.doi.org/ 10.1523/JNEUROSCI.3571-04.2005 [DOI] [PMC free article] [PubMed] [Google Scholar]
- 18. Doenecke D, Albig W, Bode C, Drabent B, Franke K, Gavenis K, Witt O. Histones: genetic diversity and tissue-specific gene expression. Histochem Cell Biol 1997; 107:1–10; PMID: 9049636; http://dx.doi.org/ 10.1007/s004180050083 [DOI] [PubMed] [Google Scholar]
- 19. Harshman SW, Young NL, Parthun MR, Freitas MA. H1 histones: current perspectives and challenges. Nucleic Acids Res 2013. [DOI] [PMC free article] [PubMed] [Google Scholar]
- 20. Ng K, Pullirsch D, Leeb M, Wutz A. Xist and the order of silencing. EMBO Reports 2007; 8:34–9; PMID: 17203100; http://dx.doi.org/ 10.1038/sj.embor.7400871 [DOI] [PMC free article] [PubMed] [Google Scholar]
- 21. Ji P, Diederichs S, Wang W, Boing S, Metzger R, Schneider PM, Tidow N, Brandt B, Buerger H, Bulk E, et al. MALAT-1, a novel noncoding RNA, and thymosin beta4 predict metastasis and survival in early-stage non-small cell lung cancer. Oncogene 2003; 22:8031–41; PMID: 12970751; http://dx.doi.org/ 10.1038/sj.embor.7400871 [DOI] [PubMed] [Google Scholar]
- 22. Hutchinson JN, Ensminger AW, Clemson CM, Lynch CR, Lawrence JB, Chess A. A screen for nuclear transcripts identifies two linked noncoding RNAs associated with SC35 splicing domains. BMC Genomics 2007; 8:39; PMID: 17270048; http://dx.doi.org/ 10.1186/1471-2164-8-39 [DOI] [PMC free article] [PubMed] [Google Scholar]
- 23. Kurose H, Bito T, Adachi T, Shimizu M, Noji S, Ohuchi H. Expression of Fibroblast growth factor 19 (Fgf19) during chicken embryogenesis and eye development, compared with Fgf15 expression in the mouse. Gene Expr Patt: GEP 2004; 4:687–93; PMID: 15465490; http://dx.doi.org/ 10.1016/j.modgep.2004.04.005 [DOI] [PubMed] [Google Scholar]
- 24. Cepko CL. The patterning and onset of opsin expression in vertebrate retinae. Curr Opin Neurobiol 1996; 6:542–6; PMID: 8794108; http://dx.doi.org/ 10.1016/S0959-4388(96)80062-6 [DOI] [PubMed] [Google Scholar]
- 25. Collinson JM, Quinn JC, Hill RE, West JD. The roles of Pax6 in the cornea, retina, and olfactory epithelium of the developing mouse embryo. Dev Biol 2003; 255:303–12; PMID: 12648492; http://dx.doi.org/ 10.1016/S0012-1606(02)00095-7 [DOI] [PubMed] [Google Scholar]
- 26. Ashery-Padan R, Gruss P. Pax6 lights-up the way for eye development. Curr Opin Cell Biol 2001; 13:706–14; PMID: 11698186; http://dx.doi.org/ 10.1016/S0955-0674(00)00274-X [DOI] [PubMed] [Google Scholar]
- 27. Li S, Goldowitz D, Swanson DJ. The requirement of pax6 for postnatal eye development: evidence from experimental mouse chimeras. Invest Ophth Vis Sci 2007; 48:3292–300; http://dx.doi.org/ 10.1167/iovs.06-1482 [DOI] [PubMed] [Google Scholar]
- 28. Alexiades MR, Cepko C. Quantitative analysis of proliferation and cell cycle length during development of the rat retina. Dev Dyn: Off Publ Am Assoc Anat 1996; 205:293–307; PMID: 8850565; http://dx.doi.org/ 10.1002/(SICI)1097-0177(199603)205:3%3c293::AID-AJA9%3e3.0.CO;2-D [DOI] [PubMed] [Google Scholar]
- 29. Young RW. Cell proliferation during postnatal development of the retina in the mouse. Brain Res 1985; 353:229–39; PMID: 4041905; http://dx.doi.org/ 10.1016/0165-3806(85)90211-1 [DOI] [PubMed] [Google Scholar]
- 30. Trimarchi JM, Stadler MB, Roska B, Billings N, Sun B, Bartch B, Cepko CL. Molecular heterogeneity of developing retinal ganglion and amacrine cells revealed through single cell gene expression profiling. J Comp Neurol 2007; 502:1047–65; PMID: 17444492; http://dx.doi.org/ 10.1002/cne.21368 [DOI] [PubMed] [Google Scholar]
- 31. Trimarchi JM, Stadler MB, Cepko CL. Individual retinal progenitor cells display extensive heterogeneity of gene expression. PloS One 2008; 3:e1588; PMID: 18270576; http://dx.doi.org/ 10.1371/journal.pone.0001588 [DOI] [PMC free article] [PubMed] [Google Scholar]
- 32. Cherry TJ, Trimarchi JM, Stadler MB, Cepko CL. Development and diversification of retinal amacrine interneurons at single cell resolution. Proc Nat Acad Sci USA 2009; 106:9495–500; http://dx.doi.org/ 10.1073/pnas.0903264106 [DOI] [PMC free article] [PubMed] [Google Scholar]
- 33. Roesch K, Jadhav AP, Trimarchi JM, Stadler MB, Roska B, Sun BB, Cepko CL. The transcriptome of retinal Muller glial cells. J Comp Neurol 2008; 509:225–38; PMID: 18465787; http://dx.doi.org/ 10.1002/cne.21730 [DOI] [PMC free article] [PubMed] [Google Scholar]
- 34. Schmetsdorf S, Gartner U, Arendt T. Constitutive expression of functionally active cyclin-dependent kinases and their binding partners suggests noncanonical functions of cell cycle regulators in differentiated neurons. Cerebral Cortex 2007; 17:1821–9; PMID: 17050646; http://dx.doi.org/ 10.1093/cercor/bhl091 [DOI] [PubMed] [Google Scholar]
- 35. Leontieva OV, Lenzo F, Demidenko ZN, Blagosklonny MV. Hyper-mitogenic drive coexists with mitotic incompetence in senescent cells. Cell Cycle 2012; 11:4642–9; PMID: 23187803; http://dx.doi.org/ 10.4161/cc.22937 [DOI] [PMC free article] [PubMed] [Google Scholar]
- 36. Zhao J, Kennedy BK, Lawrence BD, Barbie DA, Matera AG, Fletcher JA, Harlow E. NPAT links cyclin E-Cdk2 to the regulation of replication-dependent histone gene transcription. Genes Dev 2000; 14:2283–97; http://dx.doi.org/ 10.1101/gad.827700 [DOI] [PMC free article] [PubMed] [Google Scholar]
- 37. Blagosklonny MV. Cell cycle arrest is not yet senescence, which is not just cell cycle arrest: terminology for TOR-driven aging. Aging 2012; 4:159–65. [DOI] [PMC free article] [PubMed] [Google Scholar]
- 38. Wu X, Reiter CE, Antonetti DA, Kimball SR, Jefferson LS, Gardner TW. Insulin promotes rat retinal neuronal cell survival in a p70S6K-dependent manner. J Biol Chem 2004; 279:9167–75; PMID: 14660591; http://dx.doi.org/ 10.1074/jbc.M312397200 [DOI] [PubMed] [Google Scholar]
- 39. Garelick MG, Kennedy BK. TOR on the brain. Exp Gerontol 2011; 46:155–63; PMID: 20849946; http://dx.doi.org/ 10.1016/j.exger.2010.08.030 [DOI] [PMC free article] [PubMed] [Google Scholar]
- 40. Singh R, Mortazavi A, Telu KH, Nagarajan P, Lucas DM, Thomas-Ahner JM, Clinton SK, Byrd JC, Freitas MA, Parthun MR. Increasing the complexity of chromatin: functionally distinct roles for replication-dependent histone H2A isoforms in cell proliferation and carcinogenesis. Nucleic Acids Res 2013. [DOI] [PMC free article] [PubMed] [Google Scholar]
- 41. Nayernia K, Drabent B, Adham IM, Moschner M, Wolf S, Meinhardt A, Engel W. Male mice lacking three germ cell expressed genes are fertile. Biol Reprod 2003; 69:1973–8; PMID: 12930723; http://dx.doi.org/ 10.1095/biolreprod.103.018564 [DOI] [PubMed] [Google Scholar]
- 42. Popova EY, Grigoryev SA, Fan Y, Skoultchi AI, Zhang SS, Barnstable CJ. Developmentally regulated linker histone H1c promotes heterochromatin condensation and mediates structural integrity of rod photoreceptors in mouse retina. J Biol Chem 2013; 288:17895–907; PMID: 23645681; http://dx.doi.org/ 10.1074/jbc.M113.452144 [DOI] [PMC free article] [PubMed] [Google Scholar]
- 43. Magnuson B, Ekim B, Fingar DC. Regulation and function of ribosomal protein S6 kinase (S6K) within mTOR signalling networks. Biochem J 2012; 441:1–21; PMID: 22168436; http://dx.doi.org/ 10.1042/BJ20110892 [DOI] [PubMed] [Google Scholar]
- 44. Ahmad K, Henikoff S. The histone variant H3.3 marks active chromatin by replication-independent nucleosome assembly. Mol Cell 2002; 9:1191–200; PMID: 12086617; http://dx.doi.org/ 10.1016/S1097-2765(02)00542-7 [DOI] [PubMed] [Google Scholar]
- 45. Ahmad K, Henikoff S. Histone H3 variants specify modes of chromatin assembly. Proc Nat Acad Sci USA 2002; 99 Suppl 4:16477–84; http://dx.doi.org/ 10.1073/pnas.172403699 [DOI] [PMC free article] [PubMed] [Google Scholar]
- 46. Quesada V, Conde L, Villamor N, Ordonez GR, Jares P, Bassaganyas L, Ramsay AJ, Bea S, Pinyol M, Martinez-Trillos A, et al. Exome sequencing identifies recurrent mutations of the splicing factor SF3B1 gene in chronic lymphocytic leukemia. Nat Genet 2012; 44:47–52; http://dx.doi.org/ 10.1038/ng.1032 [DOI] [PubMed] [Google Scholar]
- 47. Nik-Zainal S, Alexandrov LB, Wedge DC, Van Loo P, Greenman CD, Raine K, Jones D, Hinton J, Marshall J, Stebbings LA, et al. Mutational processes molding the genomes of 21 breast cancers. Cell 2012; 149:979–93; PMID: 22608084; http://dx.doi.org/ 10.1016/j.cell.2012.04.024 [DOI] [PMC free article] [PubMed] [Google Scholar]
- 48. Kanadia RN, Shin J, Yuan Y, Beattie SG, Wheeler TM, Thornton CA, Swanson MS. Reversal of RNA missplicing and myotonia after muscleblind overexpression in a mouse poly(CUG) model for myotonic dystrophy. Proc Nat Acad Sci USA 2006; 103:11748–53; http://dx.doi.org/ 10.1073/pnas.0604970103 [DOI] [PMC free article] [PubMed] [Google Scholar]
- 49. Rocha-Martins M, Njaine B, Silveira MS. Avoiding pitfalls of internal controls: validation of reference genes for analysis by qRT-PCR and Western blot throughout rat retinal development. PloS One 2012; 7:e43028; PMID: 22916200; http://dx.doi.org/ 10.1371/journal.pone.0043028 [DOI] [PMC free article] [PubMed] [Google Scholar]
- 50. Livak KJ, Schmittgen TD. Analysis of relative gene expression data using real-time quantitative PCR and the 2(-Delta Delta C(T)) Method. Methods 2001; 25:402–8; PMID: 11846609; http://dx.doi.org/ 10.1006/meth.2001.1262 [DOI] [PubMed] [Google Scholar]
- 51. Punzo C, Kornacker K, Cepko CL. Stimulation of the insulin/mTOR pathway delays cone death in a mouse model of retinitis pigmentosa. Nat Neurosci 2009; 12:44–52; PMID: 19060896; http://dx.doi.org/ 10.1038/nn.2234 [DOI] [PMC free article] [PubMed] [Google Scholar]
- 52. Kanadia RN, Clark VE, Punzo C, Trimarchi JM, Cepko CL. Temporal requirement of the alternative-splicing factor Sfrs1 for the survival of retinal neurons. Development 2008; 135:3923–33; PMID: 18987029; http://dx.doi.org/ 10.1242/dev.024620 [DOI] [PMC free article] [PubMed] [Google Scholar]
Associated Data
This section collects any data citations, data availability statements, or supplementary materials included in this article.