

Abstract
The cyclic adenosine monophosphate dependent kinase protein (PKA) controls a variety of cellular processes including cell cycle regulation. Here, we took advantages of genetically encoded FRET-based biosensors, using an AKAR-derived biosensor to characterize PKA activity during mitosis in living HeLa cells using a single-cell approach. We measured PKA activity changes during mitosis. HeLa cells exhibit a substantial increase during mitosis, which ends with telophase. An AKAREV T>A inactive form of the biosensor and H89 inhibitor were used to ascertain for the specificity of the PKA activity measured. On a spatial point of view, high levels of activity near to chromosomal plate during metaphase and anaphase were detected. By using the PKA inhibitor H89, we assessed the role of PKA in the maintenance of a proper division phenotype. While this treatment in our hands did not impaired cell cycle progression in a drastic manner, inhibition of PKA leads to a dramatic increase in chromososme misalignement on the spindle during metaphase that could result in aneuploidies. Our study emphasizes the insights that can be gained with genetically encoded FRET-based biosensors, which enable to overcome the shortcomings of classical methologies and unveil in vivo PKA spatiotemporal profiles in HeLa cells.
Keywords: Cell cycle, chromosome segregation, FRET based biosensor, Mitosis, PKA
Abbreviations
Introduction
The cyclic adenosine monophosphate dependent kinase protein (PKA) controls a variety of cellular processes including cell cycle regulation. PKA, in its inactive state, is composed of 4 sub-units: a dimer of regulatory sub-units and a dimer of catalytic sub-units. The binding of a specific ligand to G-protein coupled receptor, leads to the production of cyclic adenosine monophosphate (cAMP) by the adenylyl cyclase. The binding of 4 molcules of cAMP to the regulatory sub-units, induces a conformational change that releases the dimer of catalytic sub-units, corresponding to the active form of PKA, then able to phosphorylate its substrates within the cell.1
PKA is dynamically regulated in space and time. Indeed, the phosphodiesterases, enzymes responsible for the degradation of cAMP, are targeted to different sub-cellular compartments. Those enzymes thus create limits of cAMP pools, due to their degradation activities.2 The cAMP/PKA signaling is also controlled at a subcellular level by the presence of the A-Kinase Anchor proteins (AKAPs) that differentially target PKA to specific subcellular compartments. Those AKAPs serve as a control mechanisms for signal transduction because PKA is anchored in the vicinity of its targets and can phosphorylate only selected proteins.3
The cAMP/PKA pathway is specifically implicated in the control of mitosis as it phosphorylates several substrate involved in its progression.4 Several lines of evidences have suggested a role for PKA in mitosis. In fact PKA is implicated in the process of chromosomes condensation. Indeed the type IIα regulatory sub-units are associated to AKAP95 that is localized to the chromatin during the mitosis of HeLa cells. It has been show that this interaction as well as PKA activity are required to maintain the chromosomes condensation.5 In HeLa cells PKA activity seems also required during mitosis because it phosphorylates the histone H1.4 at the Ser35 position resulting in a dissociation of this protein from the chromatin during mitosis. Indeed, PKA inhibition leads to an increased compaction of the chromatin, highlighting its involvement in the regulation of the condensation of the chromosomes during mitosis.6 Moreover, in yeast, PKA must be inhibited during mitosis in order to promote the activation of the anaphase promoting complex (APC) responsible for the cyclins destruction and involved the sister chromatid segregation.7 In fact, the purified catalytic subunit of PKA is able to phosphorylate 2 sub-units of the APC: cdc27 and Tsg24, resulting in a suppression of the APC activation in NIH3T3 cells.8 That suggests that PKA activity is required at the onset of mitosis to prevent an early activation of this complex. Finally, the Aurora A kinase, key protein for mitosis progression as it is involved in centrosomes maturation, spindle formation, and as it participate to the cdk1/cyclinB activation, is also a target of PKA. Phosphorylation of Aurora A by PKA induces an increase of its activity suggesting that PKA regulation could be essential during mitosis.
Nevertheless, despite its implication in the control of mitosis, the precise profile of PKA activity during this crucial step of division remains quite elusive. On one hand, early studies have shown that the cAMP level is low during G2 phase and mitosis in HeLa cells and that an artificial increase of the cAMP level at metaphase accelerate the exit of mitosis.9 Similarly, in Xenopus cycling extracts a low cAMP level is detected at the onset of M-phase.10 A drop in AMPc level and PKA activity is also known to be requested for M-phase entry and meiotic resumption in Xenopus oocytes.11 Noticeably, cell separation in Saccharomyces cerevisiae was also observed to be accompanied by AMPc levels changes.12 In the same way a decrease of PKA activity, correlated to a high PDE4D9 activity, during mitosis was observed in Rat-1 cells.13 On the other hand, if one focus on at PKA activity instead of the level of its activator, an increase of the kinase activity has been revealed during the mitosis of Chinese hamster ovary cell.14 More recently, in NIH3T3, an increase of PKA activity from the beginning of mitosis until metaphase has been highlighted.8
The influence of the cAMP/PKA on cell proliferation also exhibits a cell-type specifity. Depending on the cell line, the cAMP pathway can for example modulate the mitogen-activated protein kinase (MAPK) cascade at different levels.15 As a result, cAMP can inhibit the growth of NIH3T3 cells 16 while it stimulates the proliferation of the prostate cancer cell line LNCaP.17 Nevertheless, the numerous types of cAMP/ PKA deregulations found in cancer cells encourage scientists to explore the role of PKA as a therapeutic target for several cancers types (reviewed in 18). It is thus crucial to understand the PKA activity behavior during the cell cycle and especially during mitosis.
Although the behavior of the cAMP level and PKA activity during mitosis differs depending on the cell lines, as the types of anchored phosphodiesterases and anchor proteins for PKA differ between cell types, one shall also consider that PKA kinase activity could be highly dynamic and tightly regulated in space and time. Kinases studies are often hindered because their activity profiles to experimental conditions may be averaged in a population of cells, making some activity variations undetectable using traditional methods.19 This is notably the case during the cell cycle, when, even with a good cell synchrony, short events could be undetectable. Moreover as the cell integrity is often lost, spatial information can also be diluted.
To overcome those shortcomings, genetically encoded FRET-based biosensors have been developed in order to visualize protein activity in vivo and in single cells. Those Kinase Activity Reporters are composed of 2 fluorescent proteins suitable for FRET experiment that are flanking a specific substrate of the kinase of interest and a phospho-amino-acid binding domain (PAABD). This PAABD is able to recognize and bind the phosphorylated substrate, allowing a conformational modification that eventually brings the fluorophores close to each other and leads to a measurable FRET signal.20-23 Those signals are reversible as the biosensor they can be dephosphorylated by protein phosphatase. In fact, every increase FRET signal increase reflects modification of the kinase/phosphatase activity balance.
Here we took advantages of those tools, using the AKAREV biosensor,23 that directly derives from the well characterized AKAR4,24 to assess PKA activity during mitosis in living HeLa cells using a single-cell approach. We have measured the PKA activity during mitosis, revealing high activity near to the chromosomal plate during metaphase independently of any specific localization of the catalytic sub-units. We also demonstrate that this activity is required to maintain a proper division phenotype.
Results
PKA activity increases during mitosis
The use of the PKA biosensor AKAREV,23 allowed us to precisely define the timing of PKA activity changes during mitosis in HeLa cells. Cells were synchronized and images were acquired every 5 minutes to calculate FRET ratios and thus activity variations over time. We showed the activity curve and the FRET ratio images for one representative cell (Fig. 1A and B). Those measurements reveal that PKA activity increased starting from the moment where the cell became round and less adherent, which is a characteristic of the entry in metaphase (t = 3h15 on Fig. 1A and B). This activity stayed high during the mitosis process and finally decreased at the cytokinesis (4h40). In some of the cells we detected a short peak of PKA activity just after cytokinesis (exemplified in Fig. 1A and B), before the return to a basal activity level while the cells reenter in G1 phase.
Figure 1.

PKA activity increases during mitosis. YFP/CFP ratio (normalized on the average of the 5 first time point values), corresponding to PKA activity during the mitosis of one representative HeLa cell (black). At t = 4h45, when the division has occurred, the 2 curves correspond to each daughter cell (dark gray and light gray) (A). Pseudo color images representing YFP/CFP ratio around mitosis of the same cell from t = 2h35 to t = 5h10 (scale bar = 10μM) (B). For the functionality control of the AKAREV biosensor and of the inactive mutant AKAREV T>A, YFP/CFP ratio has been measured before (t = 0 to 8 min) and after (t = 10 to 22 min) the addition of forksolin (12.5 μM) to the imaging medium, (n = 20 for AKAREV; n = 11 for AKAREV T>A). An arrow indicates the time point where forskolin was added (C). Representative images for each condition in pseudo color scale (D). Histogram represents the average YFP/CFP ratio of AKAREV (n = 8) normalized on the values obtained with its inactive mutant AKAREV T>A (n = 8). This time, all the single curves has been normalized on the late G2/prophase step. Different cell cycle steps were isolated according to morphological criterions: late G2/prophase corresponds to the 5 time points before the cell become round, mitosis corresponds to the moment where the cell is effectively round, cytokinesis corresponds to the moment where the cell stretches out and start the constriction in 2 daughter cells, and early G1 corresponds to the 5 next points (E).
To further confirm those results we constructed an AKAREV T>A inactive form of the biosensor. It consists in a point mutant version of the biosensor AKAREV: the phosphorylable threonine in the substrate was replaced by an alanine. In this case there is no phosphorylation of the biosensor, and thus no conformational changes that generate FRET signal. We confirmed the loss functionality of AKAREV T>A using 12.5 μM of forskolin, an activator of the adenylate cyclase, that induces an increase of the production of cAMP and thus of PKA activity. Using forskolin, the original biosensor AKAREV exhibited a strong FRET ratio increase that reached 65%. Contrarily, upon addition of this activator, we observed that cells expressing AKAREV T>A did not show any increase of the YFP/CFP ratio (Fig. 1D and E).
We thus analyzed the PKA activity variations during mitosis, in comparison with the signals of this negative control biosensor. To get a statistical view of this process, we averaged the YFP/CFP values on several cells at different representative moments based on morphological criteria: prior to mitosis, during mitosis, while cytokinesis occurred and finally when cells returned in G1 phase. This analysis confirmed the increase of PKA activity during metaphase characterized by 24% of FRET ratio increase. This activity decreased at cytokinesis, as showed by FRET ratio decrease to only 11% (Fig. 1C). As mentioned previously, we detected in early G1 2 different behaviors: in some cases a short peak of PKA activity and in other cases, after cytokinesis PKA activity stays low. We hypothesize that this very brief increase is sometimes not detected because of the temporal resolution, and could explain the intermediate value of 6% obtained for cells in early G1 (Fig. 1C).
PKA catalytic sub-unit is highly concentrated to the centrosome during prophase and prometaphase
PKA is able to phosphorylate many substrates in the cell. To understand the role of the activity variations during mitosis and their potential effects, we wanted to define if the catalytic sub-units of PKA, responsible for phosphorylation, were specifically sub-localized during the cell division, in which case this localization could bring insights on the processes or molecules targeted by PKA during mitosis.
Mitotic stages are easily defined using the combination of DNA and spindle staining, by observing both the formation of the division apparatus and the condensation of the DNA. We thus combined DNA, α-tubulin and PKA catalytic sub-unit staining on synchronized HeLa cells (Fig. 2). We observed that the catalytic subunit of PKA showed a granular localization in the whole cell (except where the condensed chromosomes sat and where PKA concentration was lower) all along mitosis. Additionally, in the early phases of mitosis, 2 dots where PKA was highly concentrated can be distinguished. Those dots were localized where the microtubules converged at both sides of the nucleus in prophase, and right in the middle of the asters in prometaphase (Fig. 2). Using a centrosomal staining (γ-tubulin) we confirmed that this specific PKA localization corresponds to the centrosomes, and is independent of PKA activity inhibition (data not shown).
Figure 2.
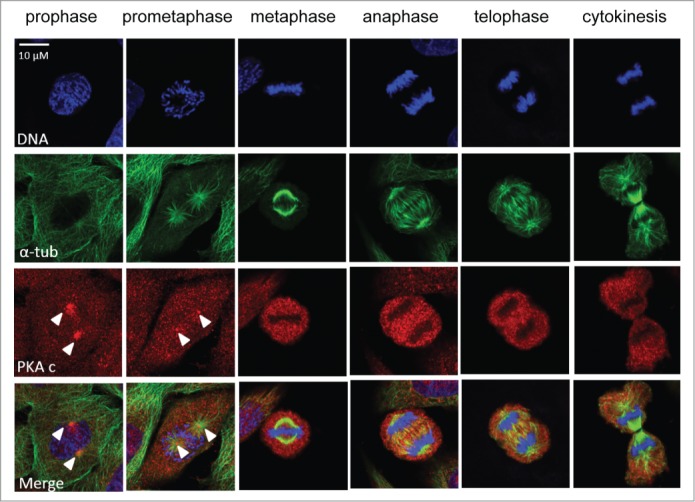
PKA localization during mitosis. HeLa cells at different mitotic stages from prophase to cytokinesis exhibiting a DNA staining (Hoechst, in blue, upper panel), a spindle staining (α-tubulin, in green, second panel) and a PKA catalytic sub-unit staining (in red, third panel). The lower panel represents the merge of the different channels. White arrows highlight the centrosomal regions where PKA catalytic sub-unit is more concentrated.
So prior to the increase of PKA activity highlighted from metaphase to cytokinesis, PKA is highly concentrated in the centrosomal regions.
PKA activity is high near the chromosomes during metaphase and anaphase
In order to observe PKA activity sub-localization, we performed FRET experiments increasing the spatial resolution as well as adding optical sectioning using confocal microscopy. HeLa cells expressing the biosensor were synchronized using thymidine block and were fixed 9h after their release in fresh medium. In Figure 3 are represented intensity images in order to define the different structures inside the mitotic cells (Fig. 3, left panel) and we applied a pseudo color scale on FRET images that reveals in red the highest activity regions within the cell (Fig. 3, center and right panel). We also chose to merge the intensity and ratio channels in order to keep to sub-cellular structure information associated with PKA activity (Fig. 3, right panel). On the zoomed region (Fig. 3B and 3C) we applied an inverted gray scale, so that on the merge the structure of the condensed DNA was highlighted.
Figure 3.
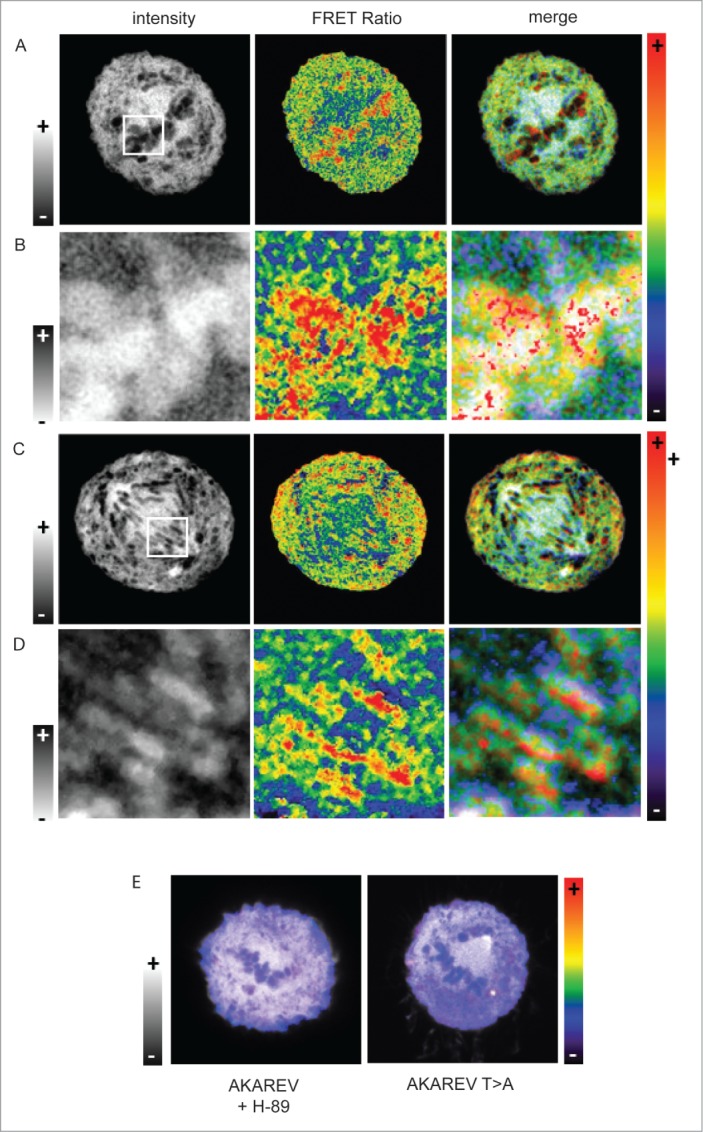
Sub-localization of PKA activity during metaphase and anaphase. Confocal FRET experiment of cells expressing the AKAREV biosensor during metaphase (A) and anaphase (C). White squares define the zoom in regions of the cell in metaphase (B) and in anaphase (D).The left panel is composed of intensity images, the center panel correspond to the FRET ratio images represented in a rainbow pseudo color scale and the right panel is the merge of the 2 images. To highlight the chromosome regions where PKA is highly active, we applied an inverted gray lookuptable on the zoom in images (B and D, left panel). Merge of intensity and FRET images in a metaphasic cell expressing AKAREV and treated with H-89 (10 μM), and another expressing the mutant AKAREV T>A (E).
Those experiments show that during metaphase PKA activity is particularly high in the close vicinity of the condensed chromosomes (Fig. 3A and 3B) in both metaphase and anaphase. In the same way a strong PKA activity is detected near the chromatin during anaphase, while this activity is lower between the 2 bundles of chromosomes (Fig. 3C and 3D). Moreover cells expressing the mutant biosensor, or treated with a PKA inhibitor result in the abolition of any sub localization of PKA activity confirming the previous results (Fig. 3E).
Inhibition of PKA activity induces mitotic defects that do not delay the progression of mitosis
Consistent with our data, according to which PKA plays a role at the centrosome and at the level of the condensed chromosomes during mitosis, several clues in literature also converge in the idea that PKA activity during mitosis is involved in chromosomes positioning.
It was also previously reported that an artificial increase of PKA activity using a cAMP analog during metaphase accelerate the exit of mitosis.9 Now that we define that, at least in our cell line, mitosis was characterized by an increase of PKA activity from metaphase to cytokinesis, we wanted to observe if preventing experimentally this increase using the PKA activity inhibitor H-89 dihydrochloride, could lead to opposite effects. We thus synchronize the cells in late G2 using a thymidine block followed by a nocodazole block. Cells were then release in presence or absence of 10 μM of H-89 and fixed 1h and 2 h later.
Using a combination of DNA and spindle staining in confocal microscopy we image hundreds of cells in each conditions and classified them in the different step of mitosis. The repartition of cells through the different steps did not reveal any delay or acceleration in the progression of mitosis compared to the control experiment. As an example, 2h after nocodazole release, in control conditions 64.6 ± 10.8% of cells exhibited the phenotype of a G1 cell, characterized by the presence of a cytoplasmic bridge between 2 daughter cells. Upon treatment with the inhibitor, G1 cells represented 57.7 ± 5.3% of the population, revealing an absence of delay of mitosis when PKA is inhibited (Fig. 4B). Nevertheless it appeared that cells that have been treated with the PKA inhibitor exhibited improper phenotype in metaphase, such as a chromosome that have already migrated to one of the spindle pole, or anarchic alignment of chromosomes whereas the spindle was already perfectly formed (Fig. 4A). We quantified the proportion of cells with those kinds of mitotic defects and the results showed that up to 63% of metaphases exhibited strong defects (Fig. 4C). As the respect of the proper alignment of the DNA on the mitotic spindle preserves cells from aneuploidy, those results suggest that the increase of PKA activity during mitosis could be involved in chromosomal stability.
Figure 4.

Effects of PKA inhibition using H-89 during mitosis. Immunostaining of metaphasic HeLa cells synchronized using thymidine-nocodazole blocks. DNA was stained using Hoechst (upper panel, in red), spindle was stained using an α-tubulin antibody (second panel, in green). The lower panel represent the merge of the 2 channels. First column shows a metaphase in control conditions, the next columns show different kind of mitotic phenotypes observed upon inhibition of PKA activity using H-89 (10 μM). White arrows highlight chromosomes or pieces of DNA that have migrated precociously (A). Percentage of cells in each phase of mitosis defined according to phenotype, at 1 hour and 2 hour after release from a thymidine-nocdazole synchrony, in control and h-89 treated conditions (total number of cell measured on 4 independent experiments: n = 663, n = 632, n = 754 and n = 1195 for respectively control condition after 1h and 2h, H-89 condition after 1h and after 2h) (B). Percentage of mitotic defects observed in control and H-89 treated cells. Stars represent p-values obtained on a student t-test performed on the results of the 4 experiments with * < 0.05 and ** < 0.01 (C).
Discussion
In this study we highlighted the in vivo dynamics of PKA activity during mitosis using FRET-based biosensors. We have shown that at the onset of mitosis, that in prophase and prometaphase, the catalytic sub-unit of PKA is highly localized at the centrosomes, but this specific localization is lost in the next steps of mitosis. The entry in metaphase is associated with a rapid increase of PKA activity that stays elevated until the cell effectively divides in 2 daughter cells during cytokinesis. Moreover we have been able to detect that during metaphase and anaphase, PKA activity is the highest in the vicinity of the duplicated chromosomes. If the FRET-based biosensor was able to reveal PKA activity during mitosis, one shall not neglect the impact of phosphatase during this process. Indeed, intensities measured reflect the changes of a kinase/phosphatase activity balance. Finally we demonstrate that the inhibition of PKA activity prior to mitosis leads to abnormal mitotic phenotypes thus suggesting that the upkeep of PKA activity during mitosis is involved in the maintenance of the chromosomal stability.
Previous works already pointed out a link between PKA activity and chromosomal stability.25 For example in mouse hepatoma cells BW1J, the type I regulatory sub-units (RI) as well as the catalytic subunits of PKA colocalize with the tubulin at the mitotic spindle. Moreover overexpression of the α sub-type (RIα) as well as expression of a RIα mutant that acts as a dominant negative of PKA activity lead to an increase of the proportion of cells possessing a spindle that exhibits more than 2 poles.26 Furthermore, PKA is able to phosphorylate oncoprotein 18 (also called stathmin), a microtubules destabilizing protein whose activity is negatively regulated by phosphorylation at the onset of mitosis in order to allow the formation of the mitotic spindle.27,28
Centrosomes are essential to ensure the fidelity of chromosomes segregation as they guide microtubules within the organization of a bipolar spindle. Consistently with our data exhibiting a high concentration of PKA at the centrosomes (Fig. 2), it has been shown that several AKAPs are able to target PKA to those organelles such as AKAP350, AKAP450, CG-NAP and also pericentrin.29 As a necessary component of the centrosomal matrix, pericentrin is involved in the organization of the mitotic spindle by interacting with dynein and γ-tubulin. Very interestingly, this protein, that co-immuno precipitate with both PKA catalytic and type II regulatory sub-units (RII), is highly phosphorylated upon an elevation of PKA activity.30,31 Moreover, removal of PKA anchoring in the cells leads to spindles defects.29 It has also been shown that the cAMP level at the centrosome increases during mitosis and come with an increase of PKA activity in this zone.32 PDE4D3 is a phosphodiesterase that degrades cAMP specifically localized at the centrosome. Using an inactive mutant of PDE4D3, it was shown that disrupting the centrosomal microdomain of the low cAMP level reported in interphase drives a local increases of the level of cAMP and accumulation of the cells in prophase.32 As previously mentionned, several different AKAPs target PKA to this compartment, which reinforces the idea of multiple roles and/or targets of PKA at the centrosome and thus its requirement.
In this study we observed that PKA activity is increased near the condensed DNA, and that inhibition of the global activity of PKA inside the cell also leads to mitotic defects (Fig. 3 and Fig. 4). Nevertheless we did not observe spindle defects such as multi-polar spindles. Our data mostly included misalignment of chromosomes on the metaphase plates when PKA activity is switched off. We then speculated that PKA could affect the attachment of the DNA on the spindle and thus the kinetochores functions or the segregation of the sister chromatids. Indeed, in yeast, dosage suppression experiments have revealed a genetic link between PKA signaling and kinetochores. In this model overexpression of PKA negative regulators is able to rescue the viability of kinetochore genes mutants.33 Moreover the deletion of BCY1, a negative regulator of PKA, leads to a strong increase of the chromosome loss rate, involving the attenuation of PKA signaling as a contribution to kinetochore functions.34 While our experiments also demonstrate that the inhibition of PKA leads to mitotic defects (Fig. 4), we hypothesized that PKA activity should be comprised in a permissive interval (not too high but not too low) in order to favor a proper cell division.
Moreover PKA is also involved in the regulation of the Anaphase Promoting Complex that plays an important role in sister chromatids segregation. PKA must be inhibited during mitosis in order to promote the activation of this complex.35 We can hypothesize that PKA inhibition allows the cells to by-pass the metaphase/anaphase checkpoint. Further experiment about the how PKA activity could also affect this checkpoint activation in such context could bring essential information to understand the involvement of this kinase in chromosomal stability.
In conclusion, as a member of the family of signaling molecules, PKA is able to phosphorylate multiples targets including several crucial proteins required for mitosis and maintenance of genetic integrity by preserving or acting on centrosomes and kinetochores functions as well as sister chromatids segregation or DNA condensation. All the elements, previously mentioned are converging to the idea of a precise spatial but also temporal regulation of PKA activity within the cell during mitosis. We provide here a precise overview of PKA spatio-temporal dynamics, in HeLa cells, during mitosis, that appears essential to understand the way the different specific effects of PKA are associated in the regulation of cell division.
Materials and Methods
Chemical reagents and antibodies
Thymidine (http://www.sigmaaldrich.com/catalog/product/sigma/t1895), Nocodazole (http://www.sigmaaldrich.com/catalog/product/sigma/m1404) and the PKA inhibitor H-89 dihydrochloride (http://www.sigmaaldrich.com/catalog/product/sigma/b1427) were from Sigma and used respectively at 2.5 mM, 100 nM and 10 μM. Forskolin was purchased from Tocris Bioscience and used at 12.5 μM (http://www.tocris.com/dispprod.php?ItemId = 2337). Anti-α-Tubulin antibody produced in mouse was purchased from Sigma (http://www.sigmaaldrich.com/catalog/product/sigma/t6199), Anti-cAMP Protein Kinase Catalytic subunit antibody was from Abcam (http://www.abcam.com/camp-protein-kinase-catalytic-subunit-antibody-ab26322.html). Alexa conjugated secondary antibodies produced in donkey were purchased from Invitrogen and we used specifically an anti-mouse IgG-alexa488 (https://www.lifetechnologies.com/order/catalog/product/A21202?CID = search-a21202) and an anti-rabbit IgG-alexa594 (http://www.lifetechnologies.com/order/catalog/product/A21207?ICID = search-a21207). Hoechst 33242 was purchased from Molecular Probes, Life Technologies.
Plasmids
The plasmid containing the AKAREV biosensor sequence has been provided by Dr Jun-ichi Miyzaki.23 The mutated biosensor AKAREV T>A was constructed by site directed mutagenesis according to the procedure described by Sawano and Miyawaki 36 using the reverse primer 5′ GCCGTCAACCAGCGCCGCGCGCCTCAATC 3′.
Cell culture, transfection and synchrony
HeLa cells were grown in Dulbecco's modified Eagle's medium supplemented with 10% foetal calf serum and antibiotics (100 units/mL of penicillin and 100 μg/mL of streptomycin) at 37°C with 5% CO2. Cells were seeded on 10 mm or 32 mm coverslips in 6-well plates and grown to reach 30–50% of confluency. For FRET experiment, cells were then transfected with 1.5 μg of DNA per well using FuGENE HD (Roche) transfection reagent. Cells were synchronized using 2.5mM of thymidine during 20h, and were then released into fresh media to progress from S phase to mitosis (9h). Depending on the experiment, an additional step of synchrony, prior to the mitosis, have been performed using a 100 nM nocodazole incubation during 4h.
Immuno-fluorescence staining
Cells on coverslips were fixed with paraformaldehyde 4% for 30 min, then washed and permeabilised using a 0.5% Triton-100X for 5 min. Then cells were incubated 1h in a blocking solution containing 2% Foetal calf serum, 5% donkey serum, and 2% Bovine serum albumin (PKAc and α-tubulin antibodies) or 2% Bovine serum albumin (γ-Tubulin antibody). Cells were then incubated for 2h with primary antibodies diluted respectively at 1/500, 1/700 and 1/2000 for PKAc (rabbit), α-tubulin (mouse) and γ-Tubulin (rabbit). After washing, cells were incubated with the appropriate secondary antibodies: IgG anti-mouse conjugated to alexa 488 and IgG anti-rabbit conjugated to alexa 594. Cells were then washed and incubated with Hoechst (2uM, 10min). Finally coverslips were mounted on slides using Mowiol 488 mounting medium and sealed with clear nail polish.
Time lapse FRET imaging
Time lapse experiment were performed on cells in supplemented DMEM without red phenol for long term experiments or in Leibowitz medium (L-15) for short term experiments, on a thermostatted (37°C) inverted Leica AF6000 videomicroscope (Leica Microsystem) with 63 × 1.3 NA glycerin-immersion objective. Fluorescence excitation was performed with a 427 ± 10nm bandpass filter through a double band dichroic mirror (440/520 nm). To avoid displacements between donor and acceptor's fluorescence measurements, we used fast detection filter wheel (respectively with 472 ± 30 nm and 542 ± 27 nm bandpass filters)
Confocal microscopy
Images were acquired on a Nikon A1R confocal microscope using a 60 × 1.4 NA oil-immersion objective. For immuno-staining experiments, fluorescence excitation was performed sequentially at 404, 488 and 561 nm and signal were respectively detected at 450 ± 50, 525 ± 50 and 595 ± 50. For FRET experiment, excitation was performed at 404 nm and signals were detected simultaneously at 450 ± 50 and 525 ± 50 nm.
FRET analysis
FRET ratios from widefield microscopy experiment were calculated with an ImageJ and a Matlab routine developed according to the procedure described previously by Kardash and coworkers.37 For more details about the system implementation and application, see.22 The same strategy has been used for confocal FRET images except concerning the background subtraction that was realized manually.
Disclosure of Potential Conflicts of Interest
No potential conflicts of interest were disclosed.
Acknowledgments
We thank the personal of the BICeL-Lille1-HB Facility for access to the microscopy systems and technical advices. We thank Jun-ichi Miyazaki as source for the material. We are also grateful to Alain Martoriati for discussion and comments, and we thank Arlette Lescuyer and Franck Riquet for their technical assistance.
Funding
Pauline Vandame is granted by the University of Lille 1 and the Region Nord-Pas-de-Calais. The research was performed in the context of SIRIC ONCOLille (grant INCa-DGOS-Inserm 6041).
References
- 1. Pearce LR, Komander D, Alessi DR. The nuts and bolts of AGC protein kinases. Nat Rev Mol Cell Biol 2010; 11:9-22; PMID:20027184; http://dx.doi.org/ 10.1038/nrm2822 [DOI] [PubMed] [Google Scholar]
- 2. Lefkimmiatis K, Zaccolo M. cAMP signaling in subcellular compartments. Pharmacol Ther 2014; 143:295-304; PMID:24704321; http://dx.doi.org/ 10.1016/j.pharmthera.2014.03.008 [DOI] [PMC free article] [PubMed] [Google Scholar]
- 3. McConnachie G, Langeberg LK, Scott JD. AKAP signaling complexes: getting to the heart of the matter. Trends Mol Med 2006; 12:317-23; PMID:16809066; http://dx.doi.org/ 10.1016/j.molmed.2006.05.008 [DOI] [PubMed] [Google Scholar]
- 4. Ferrari S. Protein kinases controlling the onset of mitosis. Cell Mol Life Sc 2006; 63:781-95; PMID:16465440; http://dx.doi.org/ 10.1007/s00018-005-5515-3 [DOI] [PMC free article] [PubMed] [Google Scholar]
- 5. Collas P, Le Guellec K, Tasken K. The A-kinase-anchoring protein AKAP95 is a multivalent protein with a key role in chromatin condensation at mitosis. J Cell Biol 1999; 147:1167-80; PMID:10601332; http://dx.doi.org/ 10.1083/jcb.147.6.1167 [DOI] [PMC free article] [PubMed] [Google Scholar]
- 6. Chu CS, Hsu PH, Lo PW, Scheer E, Tora L, Tsai HJ, Tsai MD, Juan LJ. Protein kinase A-mediated serine 35 phosphorylation dissociates histone H1.4 from mitotic chromosome. J Biol Chem 2011; 286:35843-51; PMID:21852232; http://dx.doi.org/ 10.1074/jbc.M111.228064 [DOI] [PMC free article] [PubMed] [Google Scholar]
- 7. Yamashita YM, Nakaseko Y, Samejima I, Kumada K, Yamada H, Michaelson D, Yanagida M. 20S cyclosome complex formation and proteolytic activity inhibited by the cAMP/PKA pathway. Nature 1996; 384:276-9; PMID:8918880; http://dx.doi.org/ 10.1038/384276a0 [DOI] [PubMed] [Google Scholar]
- 8. Kotani S, Tugendreich S, Fujii M, Jorgensen PM, Watanabe N, Hoog C, Hieter P, Todokoro K. PKA and MPF-activated polo-like kinase regulate anaphase-promoting complex activity and mitosis progression. Mol Cell 1998; 1:371-80; PMID:9660921; http://dx.doi.org/ 10.1016/S1097-2765(00)80037-4 [DOI] [PubMed] [Google Scholar]
- 9. Zeilig CE, Johnson RA, Sutherland EW, Friedman DL. Adenosine 3':5'-monophosphate content and actions in the division cycle of synchronized HeLa cells. J Cell Biol 1976; 71:515-34; PMID:186461; http://dx.doi.org/ 10.1083/jcb.71.2.515 [DOI] [PMC free article] [PubMed] [Google Scholar]
- 10. Grieco D, Avvedimento EV, Gottesman ME. A role for cAMP-dependent protein kinase in early embryonic divisions. Proc Natl Acad Sci U S A 1994; 91:9896-900; PMID:7937913; http://dx.doi.org/ 10.1073/pnas.91.21.9896 [DOI] [PMC free article] [PubMed] [Google Scholar]
- 11. Wang J, Cao WL, Liu XJ. Protein kinase A(PKA)-restrictive and PKA-permissive phases of oocyte maturation. Cell Cycle 2006; 5:213-7; PMID:16397412; http://dx.doi.org/ 10.4161/cc.5.2.2365 [DOI] [PubMed] [Google Scholar]
- 12. Smith ME, Dickinson JR, Wheals AE. Intracellular and extracellular levels of cyclic AMP during the cell cycle of Saccharomyces cerevisiae. Yeast 1990; 6:53-60; PMID:2156391; http://dx.doi.org/ 10.1002/yea.320060106 [DOI] [PubMed] [Google Scholar]
- 13. Sheppard CL, Lee LC, Hill EV, Henderson DJ, Anthony DF, Houslay DM, Yalla KC, Cairns LS, Dunlop AJ, Baillie GS, et al. Mitotic activation of the DISC1-inducible cyclic AMP phosphodiesterase-4D9 (PDE4D9), through multi-site phosphorylation, influences cell cycle progression. Cell Signal 2014; 26:1958-74; PMID:24815749; http://dx.doi.org/ 10.1016/j.cellsig.2014.04.023 [DOI] [PubMed] [Google Scholar]
- 14. Costa M, Gerner EW, Russell DH. Cell cycle-specific activity of type I and type II cyclic adenosine 3':5'-monophosphate-dependent protein kinases in Chinese hamster ovary cells. J Biol Chem 1976; 251:3313-9; PMID:179994 [PubMed] [Google Scholar]
- 15. Stork PJ, Schmitt JM. Crosstalk between cAMP and MAP kinase signaling in the regulation of cell proliferation. Trends Cell Biol 2002; 12:258-66; PMID:12074885; http://dx.doi.org/ 10.1016/S0962-8924(02)02294-8 [DOI] [PubMed] [Google Scholar]
- 16. Chen J, Iyengar R. Suppression of Ras-induced transformation of NIH 3T3 cells by activated G alpha s. Science 1994; 263:1278-81; PMID:8122111; http://dx.doi.org/ 10.1126/science.8122111 [DOI] [PubMed] [Google Scholar]
- 17. Deeble PD, Murphy DJ, Parsons SJ, Cox ME. Interleukin-6- and cyclic AMP-mediated signaling potentiates neuroendocrine differentiation of LNCaP prostate tumor cells. Mol Cell Biol 2001; 21:8471-82; PMID:11713282; http://dx.doi.org/ 10.1128/MCB.21.24.8471-8482.2001 [DOI] [PMC free article] [PubMed] [Google Scholar]
- 18. Caretta A, Mucignat-Caretta C. Protein kinase a in cancer. Cancers (Basel) 2011; 3:913-26; PMID:24212646; http://dx.doi.org/ 10.3390/cancers3010913 [DOI] [PMC free article] [PubMed] [Google Scholar]
- 19. Sample V, Mehta S, Zhang J. Genetically encoded molecular probes to visualize and perturb signaling dynamics in living biological systems. J Cell Sci 2014; 127:1151-60; PMID:24634506; http://dx.doi.org/ 10.1242/jcs.099994 [DOI] [PMC free article] [PubMed] [Google Scholar]
- 20. Zhang J, Allen MD. FRET-based biosensors for protein kinases: illuminating the kinome. Mol Biosyst 2007; 3:759-65; PMID:17940658; http://dx.doi.org/ 10.1039/b706628g [DOI] [PubMed] [Google Scholar]
- 21. Sipieter F, Vandame P, Spriet C, Leray A, Vincent P, Trinel D, Bodart JF, Riquet FB, Heliot L. From FRET imaging to practical methodology for kinase activity sensing in living cells. Prog Mol Biol Transl Sci 2013; 113:145-216; PMID:23244791; http://dx.doi.org/ 10.1016/B978-0-12-386932-6.00005-3 [DOI] [PubMed] [Google Scholar]
- 22. Vandame P, Spriet C, Riquet F, Trinel D, Cailliau-Maggio K, Bodart JF. Optimization of ERK activity biosensors for both ratiometric and lifetime FRET measurements. Sensors (Basel) 2013; 14:1140-54; PMID:24434874; http://dx.doi.org/ 10.3390/s140101140 [DOI] [PMC free article] [PubMed] [Google Scholar]
- 23. Komatsu N, Aoki K, Yamada M, Yukinaga H, Fujita Y, Kamioka Y, Matsuda M. Development of an optimized backbone of FRET biosensors for kinases and GTPases. Mol Biol Cell 2011; 22:4647-56; PMID:21976697; http://dx.doi.org/ 10.1091/mbc.E11-01-0072 [DOI] [PMC free article] [PubMed] [Google Scholar]
- 24. Depry C, Allen MD, Zhang J. Visualization of PKA activity in plasma membrane microdomains. Mol Biosyst 2011; 7:52-8; PMID:20838685; http://dx.doi.org/ 10.1039/c0mb00079e [DOI] [PubMed] [Google Scholar]
- 25. Matyakhina L, Lenherr SM, Stratakis CA. Protein kinase A and chromosomal stability. Ann N Y Acad Sci 2002; 968:148-57; PMID:12119274; http://dx.doi.org/ 10.1111/j.1749-6632.2002.tb04333.x [DOI] [PubMed] [Google Scholar]
- 26. Imaizumi-Scherrer T, Faust DM, Barradeau S, Hellio R, Weiss MC. Type I protein kinase a is localized to interphase microtubules and strongly associated with the mitotic spindle. Exp Cell Res 2001; 264:250-65; PMID:11262182; http://dx.doi.org/ 10.1006/excr.2001.5164 [DOI] [PubMed] [Google Scholar]
- 27. Larsson N, Marklund U, Gradin HM, Brattsand G, Gullberg M. Control of microtubule dynamics by oncoprotein 18: dissection of the regulatory role of multisite phosphorylation during mitosis. Mol Cell Biol 1997; 17:5530-9; PMID:9271428 [DOI] [PMC free article] [PubMed] [Google Scholar]
- 28. Rubin CI, Atweh GF. The role of stathmin in the regulation of the cell cycle. J Cell Biochem 2004; 93:242-50; PMID:15368352; http://dx.doi.org/ 10.1002/jcb.20187 [DOI] [PubMed] [Google Scholar]
- 29. Diviani D, Scott JD. AKAP signaling complexes at the cytoskeleton. Journal of Cell Science 2001; 114:1431-7; PMID:11282019 [DOI] [PubMed] [Google Scholar]
- 30. Diviani D, Langeberg LK, Doxsey SJ, Scott JD. Pericentrin anchors protein kinase A at the centrosome through a newly identified RII-binding domain. Curr Biol 2000; 10:417-20; PMID:10753751; http://dx.doi.org/ 10.1016/S0960-9822(00)00422-X [DOI] [PubMed] [Google Scholar]
- 31. Lutz W, Lingle WL, McCormick D, Greenwood TM, Salisbury JL. Phosphorylation of centrin during the cell cycle and its role in centriole separation preceding centrosome duplication. J Biol Chem 2001; 276:20774-80; PMID:11279195; http://dx.doi.org/ 10.1074/jbc.M101324200 [DOI] [PubMed] [Google Scholar]
- 32. Terrin A, Monterisi S, Stangherlin A, Zoccarato A, Koschinski A, Surdo NC, Mongillo M, Sawa A, Jordanides NE, Mountford JC, et al. PKA and PDE4D3 anchoring to AKAP9 provides distinct regulation of cAMP signals at the centrosome. J Cell Biol 2012; 198:607-21; PMID:22908311; http://dx.doi.org/ 10.1083/jcb.201201059 [DOI] [PMC free article] [PubMed] [Google Scholar]
- 33. Ma L, Ho K, Piggott N, Luo Z, Measday V. Interactions between the kinetochore complex and the protein kinase A pathway in Saccharomyces cerevisiae. G3 (Bethesda) 2012; 2:831-41; PMID:22870406; http://dx.doi.org/full_text [DOI] [PMC free article] [PubMed] [Google Scholar]
- 34. Magtanong L, Ho CH, Barker SL, Jiao W, Baryshnikova A, Bahr S, Smith AM, Heisler LE, Choy JS, Kuzmin E, et al. Dosage suppression genetic interaction networks enhance functional wiring diagrams of the cell. Nat Biotechnol 2011; 29:505-11; PMID:21572441; http://dx.doi.org/ 10.1038/nbt.1855 [DOI] [PMC free article] [PubMed] [Google Scholar]
- 35. Yanagida M, Yamashita YM, Tatebe H, Ishii K, Kumada K, Nakaseko Y. Control of metaphase-anaphase progression by proteolysis: cyclosome function regulated by the protein kinase A pathway, ubiquitination and localization. Philos Trans R Soc Lond B Biol Sci 1999; 354:1559-69; discussion 69-70; PMID:10582241; http://dx.doi.org/ 10.1098/rstb.1999.0499 [DOI] [PMC free article] [PubMed] [Google Scholar]
- 36. Sawano A, Miyawaki A. Directed evolution of green fluorescent protein by a new versatile PCR strategy for site-directed and semi-random mutagenesis. Nucleic Acids Res 2000; 28:E78; PMID:10931937; http://dx.doi.org/ 10.1093/nar/28.16.e78 [DOI] [PMC free article] [PubMed] [Google Scholar]
- 37. Kardash E, Bandemer J, Raz E. Imaging protein activity in live embryos using fluorescence resonance energy transfer biosensors. Nat Protoc 2011; 6:1835-46; PMID:22051797; http://dx.doi.org/ 10.1038/nprot.2011.395 [DOI] [PubMed] [Google Scholar]