

Abstract
Cellular senescence is a cell cycle arrest accompanied by high expression of cyclin dependent kinase inhibitors which counteract overactive growth signals, which serves as a tumor suppressive mechanism. Senescence can be a result of telomere shortening (natural or replicative senescence) or DNA damage resulting from exogenous stressors (induced senescence). Here, we performed gene expression profiling through RNA-seq of replicative senescence, adriamycin-induced senescence, H2O2-induced senescence, and 5-aza-2-deoxycytidine-induced senescence in order to profile the pathways controlling various types of senescence. Overall, the pathways common to all 4 types of senescence were related to inflammation and the innate immune system. It was also evident that 5-aza-induced senescence mirrors natural replicative senescence due to telomere shortening. We also examined the prevalence of senescence-associated secretory phenotype (SASP) factors in the RNA-seq data, showing that it is a common characteristic of all 4 types of senescence. In addition, we could discriminate changes in gene expression due to quiescence during cellular senescence from those that were specific to senescence.
Keywords: adriamycin, aging, hydrogen peroxide, Li Fraumeni Syndrome, RNA-seq, Senescence, 5-aza-2’-deoxycytidine
Abbreviations
- H2O2
hydrogen peroxide
- 5-aza
5-aza-2′-deoxycytidine
- LFS
Li-Fraumeni Syndrome
- adria
adriamycin
- nat
natural
- LLP
lowest passage
- LP
low passage
- IFN
interferon
- IPA
Ingenuity Pathway Analysis
- GGA
Genomatix Genome Analyzer
- SPIA
Signaling Pathway Impact Analysis
Introduction
Cellular senescence is a progressive growth arrest that was first identified by Hayflick in 1961.2 The constant shortening of telomeres with each round of replication, due to the “end replication problem” causes telomeres to be incompletely replicated3 and these shortened telomeres are recognized as a signal for growth arrest due to DNA damage. Senescent cells are still stimulated to proliferate, however high levels of cyclin dependent kinases prevent successful proliferation.4 Senescence is thought to be irreversible, preventing cells from ever progressing through the cell cycle though they remain metabolically active.5 Senescence is a tumor suppressive mechanism, preventing immortality (infinite replication) potentially leading to the acquisition of cancer-causing mutations6 in this permissive genetic background. Cells can also undergo premature or induced senescence in response to external stimuli, such as DNA damage, oncogenic stimulation or treatment with chemotherapeutic agents.7 Agents used in this study that can induce cellular senescence include H2O2, through oxidative stress, 5-aza-2-deoxycytidine (5-aza), through DNA demethylation, and adriamycin, which is a chemotherapeutic agent that intercalates into DNA8-10 inhibiting the enzyme topoisomerase II thus causing DNA damage.
Senescent cells exhibit an irreversible exit from cell cycle, even when stimulated with growth factors, and show an enlarged and flattened morphology.11 Senescent cells frequently show activation of the Rb and p53 pathways11 and contain senescence-associated heterochromatic foci (SAHF), areas of condensed chromatin containing repressive histone marks.12 The most widely employed method of senescence detection is through the senescence-associated β-galactosidase assay, which relies on the unexplained phenomenon of enlarged lysosomes in senescent cells accumulating an increased amount of β-galactosidase that is measured by the cleavage of 5-bromo-4-chloro-3-indolyl-β-D-galactopyranoside (x-gal) into a blue precipitate at pH 6.13
Senescence has been identified in vivo in response to chemotherapy, highlighting a need for understanding the physiological role of the senescence pathways.14 The presence of senescent cells in cancer treatment is still controversial. Senescent cells can be seen as a desirable effect by rendering the cell incapable of dividing, however senescent cells secrete several inflammatory factors known as the senescence-associated secretory phenotype (SASP).15 The full consequences of the SASP are not fully understood, but it has been shown to enhance the conditions that promote tumor dormancy.16 Therefore apoptosis may be the more desired effect of chemotherapy, because the cells are completely eliminated from the body rather than senescence which could potentially have a negative effect on surrounding cells due to the SASP if they are not eliminated by the immune system. It may also be possible that senescent cells could acquire further mutations that allow them to re-enter the cell cycle, potentially contributing to tumor dormancy. Therefore the elimination of a senescent fraction of drug-treated cells during therapy could be beneficial.
Previous expression profiling of fibroblasts and their senescence induced by 5-aza identified 3 epigenetically silenced pathways critical for immortalization: the interferon pathway, cytoskeletal pathway and cell cycle pathway.1 Additionally, it was shown that the interferon pathway is silenced in spontaneously immortal cells and up-regulated in 5-aza induced and natural senescence.17 Furthermore, the importance of the interferon pathway was confirmed through transfection of interferon regulatory factors, IRF5 and IRF7, into immortal cells which caused activation of the IFN pathway and concomitantly induced senescence.18 However, it was found that transfection of STAT1, another interferon regulated transcription factor, was not sufficient to induce cellular senescence.19 Because the IRFs were able to induce senescence and affect several interferon stimulated genes, and because the upregulation of STAT1 alone is not able to induce senescence, it is probable that several interferon-related regulatory genes are responsible for senescence. The current study examines natural replicative senescence as well as senescence induced by H2O2, 5-aza-2-deoxycytidine and adriamycin using next generation RNA-seq analysis.
Results
Genes differentially expressed in all 4 types of senescence and represent inflammatory and immune system pathways
Fibroblasts from a patient with Li-Fraumeni Syndrome (heterozygous for p53) can maintain a functional copy of p53 and undergo replicative senescence, or can lose their functional copy of p53 and spontaneously become immortal during additional serial culture.20 For this study, MDAH041 LFS cells were grown until they ceased to divide and demonstrated morphological evidence of senescence, thus representing the natural replicative senescence. Spontaneously immortalized MDAH041 cells were treated with H2O2, 5-aza, or Adriamycin to induce senescence. Senescence-associated β-galactosidase assays were performed concurrently to assess senescence (Figure S1A) and RNA was extracted for RNA-seq in biological triplicates on independent occasions. RNA integrity was assessed, and all samples were found acceptable for RNA-sequencing based on RIN and 28S/18S ratios (Table S1). Additionally, we analyzed levels of Cyclin A2 expression through RT-PCR and found a decrease in Cyclin A2 expression in all 4 types of senescence compared to the immortal sample, consistent with withdrawal from cell cycle (Figure S1C) and previous results from our lab.21 MDAH041 cells were grown in low serum to achieve quiescence, and were analyzed to identify gene expression changes due to simple withdrawal from cell cycle rather than being due to activation of the program of cellular senescence. Cell cycle analysis was performed on quiescent samples to confirm G1/S arrest (Figure S1B).
The gene expression associated with each of the 4 types of senescence, Natural, H2O2, 5-aza and Adriamycin-induced were compared to the immortal counterpart gene expression to identify the differentially expressed genes with a fold change of +/−2 (corresponding log2 fold change of +/−1) with a P-value < 0.05. Comparisons of each senescent sample to the immortal samples were then further analyzed for commonalities among all 4 types of senescence. There were 93 genes that were differentially expressed in all types of senescence compared to immortalization, and 45 genes that were differentially expressed in quiescent and compared to untreated immortal MDAH041 cells. Those 45 quiescence-associated genes were removed to yield 48 senescence-associated genes (Fig. 1A). Hierarchical clustering analysis was performed using these 48 genes differentially expressed in all types of senescence, which revealed the up-regulation of most genes in all types of senescence compared to the immortal sample (Fig. 1B). H2O2-induced senescence associated most closely with 5-aza-induced senescence; however the 5-aza-induced senescence also associates closely with natural senescence. Interestingly, the majority of genes were upregulated in the 4 types of senescence compared to immortalization, which was consistent with the concept that senescence is dominant and immortality is recessive.22 The 48 genes differentially expressed in all 4 types of senescence were also included in cluster analysis of lowest passage cells (LLP; pd10-p12) and low passage cells (LP; p17-pd19) (Fig. 1C). This analysis indicated that the immortal samples associated most closely with the LLP samples, which is consistent with their robust proliferation. The LLP and immortal samples had mostly down-regulated genes compared to the LP and natural senescence samples indicating that the LP samples represented an aged cell proliferating but has not quite reached senescence, but somewhat associated with the expression profile of the natural senescence sample. The LP and natural senescence sample have mostly up-regulated genes compared to the immortal and LLP samples. These data indicate that normal cells activate senescence genes as they reach their replicative limit and approach senescence. This too is consistent with the concept of senescence-associated genes being dominant.
Figure 1.

(A) Gene expression comparisons among different types of senescence. Values in black represent differentially expressed genes compared to the immortal sample, values in red represent number of genes up-regulated in each sample compared to the immortal sample, and values in green represent number of genes down-regulated in each sample compared to the immortal sample. (B) Hierarchical cluster analysis of 48 senescence-associated genes among immortalization and 4 types of senescence. Green boxes indicate down-regulation relative to the mean, red boxes indicated upregulation relative to the mean. Black bars indicate no change from the mean. Imm: immortal, 5Aza: 5-Aza-2-deoxycytidine-induced senescence, adria: Adriamycin-induced senescence, H2O2: hydrogen peroxide-induced senescence, nat: natural replicative senescence. (C) Hierarchical cluster analysis of 48 senescence-associated genes among low low passage cells, low passage cells, replicative senescence and immortalization. Green boxes indicate downregulation relative to the mean, red boxes indicated up-regulation relative to the mean. Black bars indicate no change from the mean. LLP: lowest passage cells (PD 10–12), LP: low passage cells (PD 17–19), nat: natural replicative senescence, imm: immortalization.
Pathway analysis of senescence associated genes
The 48 genes in all 4 types of senescence were then subjected to pathway analysis using a multiple software approaches. Genomatix Genome Analyzer (www.genomatix.de) yielded 255 pathways involving the 48 genes common to all 4 types of senescence. These pathways were related to innate immune function/interferon response which was consistent with our previous experience with 5-aza induced senescence.1,23 The top 20 pathways (with the lowest p-values) are shown in Table 1. SPIA (Signaling pathway impact analysis) software24 was also employed for analysis of this data set and again the 48 genes participated in an abundance of interferon/immune related pathways (data not shown). In addition, these data were analyzed using IPA (Ingenuity® Systems, www.ingenuity.com). Ingenuity Pathway Analysis (IPA) revealed 116 pathways related to the 48 genes in all types of senescence, again with the majority being related to immune function/interferon response. The top 20 pathways are displayed in Table 1. A more stringent analysis was also performed through IPA by analyzing the genes in all types of senescence with log2 fold change of 2 with a p-value < 0.01 (data not shown). Interestingly, the resulting pathways were almost identical, with most of the pathways falling in the category of immune function/interferon response. These results are consistent with our previous studies17 demonstrating that the interferon pathway is frequently abrogated during immortalization and upregulated during senescence.
Table 1.
A: List of pathways statistically significant in all types of senescence through Genomatix Genome Analyzer (using the 48 senescence-associated genes)
| Genomatix Pathway | P-value |
|---|---|
| defense response | 3.76E-13 |
| immune response | 4.22E-12 |
| immune system process | 6.55E-10 |
| cytokine-mediated signaling pathway | 6.76E-10 |
| cellular response to cytokine stimulus | 1.55E-09 |
| response to stress | 2.86E-09 |
| inflammatory response | 8.54E-09 |
| response to cytokine stimulus | 2.74E-08 |
| innate immune response | 3.65E-08 |
| response to wounding | 4.60E-07 |
| response to organic substance | 1.57E-06 |
| cellular response to organic substance | 2.20E-06 |
| regulation of I-kappaB kinase/NF-kappaB cascade | 3.72E-06 |
| cell surface receptor linked signaling pathway | 5.55E-06 |
| response to stimulus | 6.40E-06 |
| response to molecule of bacterial origin | 6.51E-06 |
| positive regulation vascular endothelial growth factor production | 7.55E-06 |
| response to chemical stimulus | 7.77E-06 |
| multi-organism process | 8.67E-06 |
| regulation of interleukin-6 production | 1.15E-05 |
Table 1.
B: List of pathways statistically significant in all types of senescence through Ingenuity Pathway Analysis (using the 48 senescence-associated genes).
| Ingenuity Pathway | P-value |
|---|---|
| Dendritic Cell Maturation | 0.00525 |
| Role of Cytokines in Mediating Communication between Immune Cells | 0.00687 |
| Atherosclerosis Signaling | 0.00799 |
| NF-κB Signaling | 0.015 |
| Role of Macrophages, Fibroblasts and Endothelial Cells in Rheumatoid Arthritis | 0.0194 |
| Role of Hypercytokinemia/hyperchemokinemia in the Pathogenesis of Influenza | 0.0231 |
| Graft-versus-Host Disease Signaling | 0.0262 |
| IL-6 Signaling | 0.0271 |
| Role of Osteoblasts, Osteoclasts and Chondrocytes in Rheumatoid Arthritis | 0.0287 |
| LXR/RXR Activation | 0.0311 |
| TREM1 Signaling | 0.0391 |
| Hepatic Cholestasis | 0.0391 |
| IL-10 Signaling | 0.0478 |
| Acute Phase Response Signaling | 0.049 |
| Altered T Cell and B Cell Signaling in Rheumatoid Arthritis | 0.0555 |
| Communication between Innate and Adaptive Immune Cells | 0.0572 |
| Differential Regulation of Cytokine Production in Intestinal Epithelial Cells by IL-17A and IL-17F | 0.062 |
| PPAR Signaling | 0.0639 |
| FXR/RXR Activation | 0.0665 |
| IL-1 Signaling | 0.0665 |
The 45 genes previously determined to be associated with quiescence were also analyzed through cluster analysis. Interestingly, when these genes were analyzed, quiescence associated with immortalization and not senescence. Most genes in the senescent samples tended to be up-regulated, while these genes in the immortal and quiescent samples tended to be downregulated. This confirmed our decision to remove the quiescent genes from pathway analysis because the expression profile of quiescence differs greatly from the profile of senescence. When these genes were studied by cluster analysis of the LLP, LP and natural senescence RNAs, gene expression in LP cells was again associated with natural senescence and in immortal cells with to the more proliferative LLP cells (Fig. 2B).
Figure 2.
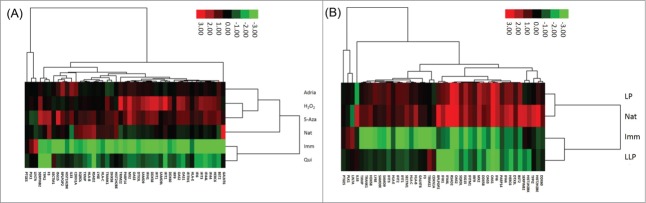
(A) Hierarchical clustering analysis of 45 quiescence-associated genes among immortalization, quiescence and 4 types of senescence. Green boxes indicate down-regulation relative to the mean, red boxes indicated upregulation relative to the mean. Black bars indicate no change from the mean. Imm: immortal, qui: quiescence, 5Aza: 5-Aza-2-deoxycytidine-induced senescence, adria: Adriamycin-induced senescence, H2O2: hydrogen peroxide-induced senescence, nat: natural replicative senescence. (B) Hierarchical clustering analysis of 45 quiescence-associated genes among immortalization, low low passage cells, low passage cells and natural senescence. Green boxes indicate downregulation relative to the mean, red boxes indicated up-regulation relative to the mean. Black bars indicate no change from the mean. LLP: lowest passage cells (PD 10–12), LP: low passage cells (PD 17–19), nat: natural replicative senescence, imm: immortalization.
The Interleukin 1 pathway is upregulated in all 4 types of senescence
To confirm the activation of genes associated with the SASP in all types of senescence, qRT-PCR was performed on independent biological replicates analyzing selected genes from the IL1R pathway, which was prominently activated in all types of senescence. At a protein level, activation of this pathway includes IL1α or IL1β binding the IL1 receptor, causing dimerization of Myd88 and consequently recruitment of IRAKs (IL1 receptor activated kinases).25,26 The IRAKs, particularly 1 and 4, cause downstream activation of NF-κB and its effectors, such as IL8, IL6 and ICAM1.27 RNA-seq revealed a robust upregulation of this pathway in all types of senescence compared to immortalization (Table 2). MDAH041 cells treated with the 3 senescence-inducing agents as well as the MDAH041 naturally senescent cells all showed a statistically significant increase in the RNA expression of IL1α, IL1β, Myd88, ICAM1 and IL8 compared to the proliferating MDAH041 immortal cells (Fig. 3A–E).
Table 2.
Gene expression of IL1 pathway members in 4 types of senescence. Values presented are log2 fold changes relative to the immortal sample according to RNA-seq data
| H2O2 | Adria | Nat | 5-aza | |
|---|---|---|---|---|
| IL1a | 5.82 | 3.44 | 5.98 | 8.87 |
| IL1b | 6.38 | 3.75 | 4.58 | 9.57 |
| Myd88 | 1.92 | 1.32 | 1.26 | 1.62 |
| ICAM1 | 3.95 | 2.94 | 3.73 | 7.23 |
| IL8 | 5.55 | 3.10 | 2.78 | 7.28 |
Figure 3.

(A) RT-PCR analysis of Il1α expression in MDAH041 cells. Changes presented are log2 fold changes compared to the immortal sample, and astericks represent statistical significance with P < 0.05. (B) RT-PCR analysis of Il1β expression in MDAH041 cells. Changes presented are log2 fold changes compared to the immortal sample, and astericks represent statistical significance with P < 0.05. (C) RT-PCR analysis of Myd88 expression in MDAH041 cells. Changes presented are log2 fold changes compared to the immortal sample, and astericks represent statistical significance with P < 0.05. (D) RT-PCR analysis of ICAM1 expression in MDAH041 cells. Changes presented are log2 fold changes compared to the immortal sample, and astericks represent statistical significance with P < 0.05. (E) RT-PCR analysis of IL8 expression in MDAH041 cells. Changes presented are log2 fold changes compared to the immortal sample, and astericks represent statistical significance with P < 0.05.
In order to be assured that this change in the IL1 pathway was not idiosyncratic of MDAH041 cells only, we confirmed the up-regulation of the IL1 pathway in 2 additional human cell lines: MDAH087-1 and MDAH087-N, which are independent immortal cell lines from the same LFS patient. Both of these cell lines showed a statistically significant increase in Il1α and Il1β in the 3 types of induced senescence compared to immortal controls (Fig. 4A–D). RT-PCR of IRF5 and IRF7 was performed in order to analyze involvement of the interferon pathway in all types of senescence and also to show consistency with previous microarray data from our lab showing up-regulated IRF5 and IRF7 in 5-aza-induced senescence.18 IRF5 was upregulated in all 4 types of senescence compared to untreated immortal cells (Fig. 5A), and IRF7 upregulation was limited to natural senescence and 5-aza-induced senescence (Fig. 5B). These data indicate that although the interferon pathway is up-regulated in all types of senescence, the mechanism of activation of the pathway may vary due to differential regulation of IRFs, which serve as activators for several of the interferon-stimulated genes. These data again highlight the similarity between natural senescence and 5-aza-induced senescence.
Figure 4.

(A) RT-PCR analysis of IL1α expression in MDAH087-1 cells. Changes presented are log2 fold changes compared to the immortal sample, and astericks represent statistical significance with P < 0.05. (B) RT-PCR analysis of IL1β expression in MDAH087-1 cells. Changes presented are log2 fold changes compared to the immortal sample, and astericks represent statistical significance with P < 0.05. (C) RT-PCR analysis of IL1α expression in MDAH087-N cells. Changes presented are log2 fold changes compared to the immortal sample, and astericks represent statistical significance with P < 0.05. (D) RT-PCR analysis of IL1β expression in MDAH087-N cells. Changes presented are log2 fold changes compared to the immortal sample, and astericks represent statistical significance with P < 0.05.
Figure 5.
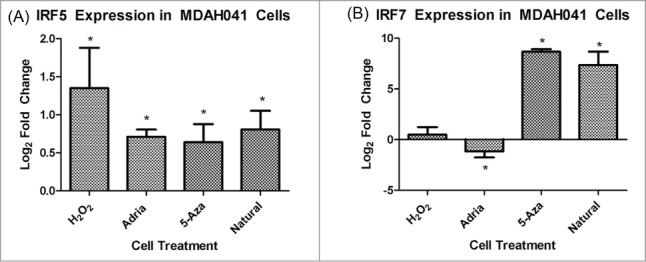
(A) RT-PCR analysis of IRF5 expression in MDAH041 cells. Changes presented are log2 fold changes compared to the immortal sample, and astericks represent statistical significance with P < 0.05. (B) RT-PCR analysis of IRF7 expression in MDAH041 cells. Changes presented are log2 fold changes compared to the immortal sample, and astericks represent statistical significance with P < 0.05.
The senescence-associated secretory phenotype is a common feature among 4 types of senescence
The senescence-associated secretory phenotype is a large group of factors secreted from senescent cells. These factors are mostly inflammatory cytokines and can cause bystander senescence of neighboring cells or bystander transformation of pre-malignant cells.28 Because the inflammatory pathway was found to be common to all 4 types of senescence, we also wanted to assess the level of the SASP in our RNA-seq data across all 4 types of senescence. When all of the known SASP components were analyzed across all 4 types of senescence and immortalization, we found that the senescent cells had these inflammatory factors upregulated compared to the immortal cells (Fig. 6A). In addition, the 5-aza sample had the highest up-regulation of many of the factors, as well as more genes up-regulated than the other types of senescence. Interestingly, the 5-aza sample again associated most closely with the natural senescence. Surprisingly, the adriamycin-induced senescent sample showed a relative down-regulation of several of the SASP genes, although DNA damage is a known cause of SASP expression.15
Figure 6.

(A) Hierarchical clustering analysis of all known senescence-associated secretory phenotype genes among immortalization and 4 types of senescence. Green boxes indicate down-regulation relative to the mean, red boxes indicated upregulation relative to the mean. Black bars indicate no change from the mean. Genes excluded from cluster due to lack of value in RNA-seq data include GCP2, TNFRSF18, NAP2, OPG, SPG130, ACRP30, BLC, CCL16, MSP-a, SERPINEB2, SCF and VEGF. Imm: immortal, 5Aza: 5-Aza-2-deoxycytidine-induced senescence, adria: Adriamycin-induced senescence, H2O2: hydrogen peroxide-induced senescence, nat: natural replicative senescence. (B) Hierarchical clustering analysis of known senescence-associated secretory phenotype genes with known high fold changes among immortalization and 4 types of senescence. Green boxes indicate downregulation relative to the mean, red boxes indicated up-regulation relative to the mean. Black bars indicate no change from the mean. Imm: immortal, 5Aza: 5-Aza-2-deoxycytidine-induced senescence, adria: Adriamycin-induced senescence, H2O2: hydrogen peroxide-induced senescence, nat: natural replicative senescence. (C) Hierarchical clustering analysis of known senescence-associated secretory phenotype genes with known intermediate fold changes among immortalization and 4 types of senescence. Green boxes indicate down-regulation relative to the mean, red boxes indicated upregulation relative to the mean. Black bars indicate no change from the mean. Imm: immortal, 5Aza: 5-Aza-2-deoxycytidine-induced senescence, adria: Adriamycin-induced senescence, H2O2: hydrogen peroxide-induced senescence, nat: natural replicative senescence. (D) Hierarchical clustering analysis of known senescence-associated secretory phenotype genes with known low fold changes among immortalization and 4 types of senescence. Green boxes indicate downregulation relative to the mean, red boxes indicated up-regulation relative to the mean. Black bars indicate no change from the mean. Imm: immortal, 5Aza: 5-Aza-2-deoxycytidine-induced senescence, adria: Adriamycin-induced senescence, H2O2: hydrogen peroxide-induced senescence, nat: natural replicative senescence.
The secretory factors were then sorted based on their known level of fold change (high, intermediate and low fold change29) and cluster analysis performed on each category. The clustering analysis is presented as upregulation or downregulation of a given gene in a given sample relative to the median expression of that gene. The genes representing high fold changes showed a down-regulation in immortalization compared to the median expression and up-regulation in all 4 types of senescence compared to the median expression of the gene, as expected (Fig. 6B). Additionally, 5-aza exhibited the highest fold changes for most changes compared to other types of senescence. The genes representing intermediate fold changes again showed a downregulation in immortalization for most genes compared to the 4 types of senescence (Fig. 6C). The 5-aza-induced senescence again associated closely with natural senescence, again indicating a similar mechanism of activation. There were several genes in the intermediate fold change category that were not found in our data (indicated by gray bars). The genes representing small fold changes again showed a down-regulation in the immortal samples compared to the 4 types of senescence (Fig. 6D). 5-aza-induced senescence exhibited the highest upregulation of several of the genes compared to the other types of senescence in all of the fold change categories.
The most consistently used indicators of the senescence-associated secretory phenotype are IL6 and IL8. IL8 was shown to be upregulated in replicative senescence and senescence induced by 5-Aza, Adriamycin, and H2O2. However, IL6 was up-regulated in only the induced forms of senescence in this study, and did not show up-regulation in replicative senescence. The reason for this is unknown, as IL6 has been shown to be upregulated in several types of senescence, including replicative.15
Discussion
Gene expression changes in the interferon/innate immunity pathway were strongly associated with 5-aza-induced senescence and an abrogation of key regulators of this pathway are silenced during immortalization.17 We expanded this analysis to include additional types of senescence, including replicative senescence, H2O2-induced senescence and adriamycin-induced senescence. For comparison 5-aza-induced senescence was again assessed in this study given that we used a different expression profiling technology. Analysis of the RNA-seq data again indicated that the inflammatory or interferon pathways were up-regulated in all 4 types of senescence compared to immortal cells. In addition, we confirmed the upregulation of this pathway using qRT-PCR for the members of the IL1 pathway, which was a highly represented pathway in this data. IL1 pathway members were also regulated in independent immortal LFS cells, MDAH087-1 and MDAH087-N.
While only fibroblasts were examined in this study, it is likely that changes in the IL1 pathway and/or inflammatory pathway occur during senescence in other cell types. Previous studies have shown that IL1α and Il1β are upregulated in HCA2 cells induced to senescence by bleomycin,27 in IMR90 cells during oncogene-induced senescence30 and in 3 out of 6 HUVEC strains (endothelial) exhibited increased IL1α upon aging of cells.31 IL1 is up-regulated in U2OS cells senescence induced by etoposide, replicative senescence in BJ fibroblasts and oncogene-induced senescence in BJ fibroblasts.32 Interferon-inducible gene IFI16 is upregulated in prostate epithelial cells upon replicative senescence.33 A different study also showed up-regulation of interferon genes during replicative senescence of prostate epithelial cells.34 Our research shows increased Il1α and Il1β, as well as the inflammatory pathway, in several types of senescence (Adriamycin, H2O2, 5-aza and replicative) in a single spontaneously immortalized cell line with a consistent genetic background, providing a more consistent analysis of the pathways of senescence. This analysis is consistent with previous studies of senescence in several cell types, further validating the relevance of our cell model.
The upregulation of inflammatory factors during replicative senescence may be the cause of increased aging-associated inflammation in vivo, which can lead to several aging-related diseases such as cancer.29 This up-regulation of inflammatory factors during aging could be the cause of the senescence-associated secretory phenotype, which causes a secretion of inflammatory factors to the surrounding environment leading to bystander senescence of nearby cells or even transformation of nearby pre-malignant cells.30 However, the upregulation of inflammatory factors is also present in senescence not due to terminal replication, and this is accompanied by activation of the senescence-associated secretory phenotype, but the reason for this is not known. It seems contradictory that inflammation, which can lead to tumorigenesis, is increased during senescence, which is a tumor suppressive mechanism. This could be an example of antagonistic pleiotropy; senescence prevents cancer formation during young life, but becomes a detriment to the organism as it ages because of the senescence-associated secretory phenotype.35
The involvement of several inflammatory pathways led us to examine the presence of senescence-associated secretory phenotype genes in our RNA-seq data. As expected, a large number of the known SASP genes were also up-regulated in the 4 types of senescence, indicating that the SASP is a common characteristic of senescence, regardless of the mechanism of induction. However, it does appear that different types of senescence have different levels of SASP expression, if fold change of gene expression is an indicator (Fig. 6). For example, the 5-aza-induced senescence samples have a much higher fold change for several of the genes present in the SASP.
Previous gene expression studies using immortal LFS cells demonstrated several similarities between 5-aza-induced senescence and replicative senescence. Aging studies have shown a progressive demethylation of DNA during aging, which may explain the similarity between replicative senescence and 5-aza-induced senescence, which also involves DNA demethylation. We examined this idea in our current RNA-seq data, and found a similarity between 5-aza-induced senescence and replicative senescence. First, gene expression of IRF5 and IRF7 were similar in these 2 types of senescence through RT-PCR. Secondly, when clustering analysis was performed of the 48 genes in all types of senescence, the 5-aza-induced senescence samples were similar to replicative senescence in the quantity of genes upregulated compared to immortalization. Although the genes differentially expressed in 5-aza-induced senescence and replicative senescence may differ, the pathways are consistent, indicating that gene expression may be heterogeneous. Similarly, when the SASP components were analyzed among various types of senescence by clustering analysis, we found an association between 5-aza-induced senescence and replicative senescence. This is likely to be due the fact that normal cells show decreased amounts of methylation during aging, while immortal cells do not show a decrease in methylation with time.36 Therefore, we conclude that 5-aza-induced senescence mimics the natural aging at a cellular level. Recently, 5-aza was shown to decrease telomere length and reduce telomerase activity in chronic leukemia cell lines.37 This further corroborates our conclusion that 5-aza mimics natural senescence caused by telomere shortening.
This study utilized an LFS cell model, using fibroblasts which were spontaneously immortalized due to loss of p53 and subsequent genetic instability. Therefore, induced senescence of these immortal cells was not dependent on the activation of p53, because its expression was lost upon immortalization. Additionally, upon immortalization the promoter of tumor suppressor p16 becomes hyper-methylated and therefore p16 is silenced. Expression of p16 is only observed in the immortal cells induced into senescence after treatment with 5-aza, which demethylates the p16 promoter and allowing its re-activation.1 H2O2 and Adriamycin-induced senescence do not show any expression of p16 protein (data not shown). Replicative senescence of LFS fibroblasts shows expression of both p53 and p16, while the various types of induced senescence do not have expression of p53 or p16 (with the exception of 5-Aza as mentioned previously). However, both replicative senescence and induced senescence showed an up-regulation of p21, but further research is necessary to ascertain how p21 becomes activated in these cells, as well as to examine the Rb status of these various types of senescence. We have shown previously that introduction of p16 induces senescence that is dependent on Rb,21 however it is not known if the absence of p16 in this study is related to Rb status.
It is also important to note that senescence-inducing stimuli such as 5-Aza is not as effective on normal fibroblasts, hence the use of immortal LFS fibroblasts in this study. LFS cells were chosen based on the spontaneous nature of immortalization, which minimizes genetic variability due to manual immortalization of a cell line. While we chose only to use cells from LFS patients for this reason, the results obtained were highly reproducible among several independently harvested LFS cell lines (in this and previous studies1,17,21) and when applicable, our data was consistent with other studies using different cell lines, further validating our cell model.
Methods
Cell culture and drug treatments
Cells were cultured in Modified Eagles Medium (MEM, Invitrogen). Cells were supplemented with 10% fetal bovine serum (FBS, Hyclone), 100 units/ml penicillin and 100 μg/ml streptomycin (Invitrogen) and were maintained at 37°C in 5% humidified CO2. H2O2 treatment was performed by adding H2O2 to cell media at a final concentration of 20 μM for MDAH-087-N and MDAH087-1, 25 μM for MDAH172 and 85 μM for MDAH041 cells and incubating at 37°C for 2 hours. Drug concentrations were optimized to achieve greatest amounts of SA-β-galactosidase staining for each cell line. Plates were then washed with PBS and replenished with growth media, and incubated at 37°C for 5 days.
5-aza-2’-deoxycytidine treatment was performed by adding fresh preparations of sterile 5-aza in 50% acetic acid to cell media to a final concentration of 1 μM every other day and plates were harvested on day 8. For the last 18 hours prior to RNA extraction the 5-aza-containing medium was replaced with medium free of the drug.
Adriamycin treatment was performed by adding a stock of adriamycin dissolved in water to cell media at a final concentration of 0.5 μM for MDAH041 cells and 0.20 μM for MDAH087-1, 087-N and MDAH172 cells. Cells were treated for 2 hours (MDAH041) or 1.5 hours (087-N, 087-1 and 172) at 37°C, and were then washed with PBS and growth media was replenished. Cells were grown at 37°C for 5 days before harvest for RNA or protein.
Naturally senescent cells were achieved through serial passaging at a 1:2 split ratio until cells halted proliferation and appeared morphologically senescent (PD 29–30). Lowest passage cells (PD 10–12) and low passage cells (PD 17–19) were split 1:2 and harvested at the indicated passage. Immortal cells were maintained in culture through 1:4 splits and harvested at high population doublings (greater than 200).
Gene expression analysis using RNA seq
Quality control for all RNA samples was performed on the Agilent 2100 Bioanalyzer by the Applied Genomics and Technology Center (AGTC) at Wayne State University. Preparation of samples for sequencing was performed at the AGTC using the TruSeq RNA sample preparation kit (Illumina). Briefly, mRNA was prepared from the total RNA by magnetic beads containing oligo dT, which selects for the 3’ poly A tails of mRNA. The samples are fragmented by divalent cations at elevated temperature and reverse transcribed into cDNA. The ends are repaired by addition of an “A” base and ligated to adapters which enable multiplexing of samples, and all fragments are enriched with PCR to get a final cDNA library. In this sequencing run, the samples were multiplexed with 6 samples per lane, in 4 lanes, for a total of 24 samples. Samples were then sequenced on the Illumina HiSeq 2000 System, and analyzed by at the AGTC. Briefly, samples were demultiplexed with Illumina's CASAVA 1.8.2 software (www.illumina.com) and quality control was assessed using FastQC from Babraham Bioinformatics (www.bioinformatics.babraham.ac.uk/). Reads were then aligned to the Human Genome Consortium's reference human genome hg1938 using Tophat software,39 allowing 20 alignments to the genome per sequencing read. Relative abundances and differential expression was calculated using Cufflinks software.40 Raw and processed data from RNA-seq were submitted to the Gene Expression Omnibus as GSE60340.
Senescence-associated beta-galactosidase assay
A senescence detection kit (BioVision) was used for staining according to the manufacturer's instructions. Briefly, treated cells were stained for senescence-associated β-galactosidase activity after 5–7 days of drug treatment. In order to count the senescence-associated β-galactosidase positive cells, cell plates were washed twice with PBS and fixed with fixative solution for 10–15 minutes at room temperature. The fixed cells were washed with PBS and stained with the staining solution containing X-gal and staining supplement and incubated at 37°C overnight with no CO2. Cells containing blue stain were counted as senescent, proportionate to the total number of cells per field of vision. At least 300 cells in at least 4 fields of vision were counted.
RNA Extraction
RNA was extracted from 10 cm plates of 80% confluent cells of all conditions using the QIAGEN RNeasy Kit (QIAGEN). Fully supplemented media was added to the cells approximately 18 hours before harvest to ensure similar proliferation rates.
RT-PCR
cDNA was prepared from 3 μg of RNA, using the Superscript II system from Invitrogen. Q-RT-PCR was performed using SYBR Green PCR Detection Kit from Applied Biosystems and analyzed on the ABI 5700 Sequence Detection System (Applied Biosystems). The relative fold change was calculated using the CT method as follows: 2−ΔΔCT, where, ΔΔCT = (CT Gene of interest − CT GAPDH) experiment − (CT Gene of interest − CT GAPDH) control. Statistical analysis was performed using a paired student's t-test, comparing the various types of senescence to the immortal control with p-values less than 0.05 considered significant.
Disclosure of Potential Conflicts of Interest
No potential conflicts of interest were disclosed.
Acknowledgments
The authors thank Dr. Aliccia Bollig-Fisher for helpful discussions regarding RNA-seq analysis.
Funding
This work was supported by Barbara and Fred Erb Endowed Chair in Cancer Genetics (MAT), the Karmanos Cancer Institute, and the Molecular Medicine and Genetics Applied Genomics Technology Center at Wayne State University and the Karmanos Cancer Institute, grant P30CA022453. MP was funded by the DeRoy Testamentary Foundation Fellowship and Graduate Research Assistant Fellowship from Wayne State University.
Supplemental Materials
Supplemental data for this article is available on the publisher's website.
References
- 1. Fridman AL, Tang L, Kulaeva OI, Ye B, Li Q, Nahhas F, Roberts PC, Land SJ, Abrams J, Tainsky MA. Expression profiling identifies three pathways altered in cellular immortalization: interferon, cell cycle, and cytoskeleton. J Gerontol A Biol Sci Med Sci 2006; 61:879-89; PMID:16960018; http://dx.doi.org/ 10.1093/gerona/61.9.879 [DOI] [PubMed] [Google Scholar]
- 2. Hayflick L. The limited in vitro lifetime of human diploid cell strains. Exp Cell Res 1965; 37:614-36; PMID:14315085; http://dx.doi.org/ 10.1016/0014-4827(65)90211-9 [DOI] [PubMed] [Google Scholar]
- 3. Levy MZ, Allsopp RC, Futcher AB, Greider CW, Harley CB. Telomere end-replication problem and cell aging. J Mol Biol 1992; 225:951-60; PMID:1613801; http://dx.doi.org/ 10.1016/0022-2836(92)90096-3 [DOI] [PubMed] [Google Scholar]
- 4. Blagosklonny MV. Cell cycle arrest is not yet senescence, which is not just cell cycle arrest: terminology for TOR-driven aging. Aging (Albany NY) 2012; 4:159-65; PMID:22394614 [DOI] [PMC free article] [PubMed] [Google Scholar]
- 5. Ohtani N, Mann DJ, Hara E. Cellular senescence: its role in tumor suppression and aging. Cancer Sci 2009; 100:792-7; PMID:19302284; http://dx.doi.org/ 10.1111/j.1349-7006.2009.01123.x [DOI] [PMC free article] [PubMed] [Google Scholar]
- 6. Campisi J. Cellular senescence as a tumor-suppressor mechanism. Trends Cell Biol 2001; 11:S27-31; PMID:11684439; http://dx.doi.org/ 10.1016/S0962-8924(01)02151-1 [DOI] [PubMed] [Google Scholar]
- 7. Roninson IB. Tumor cell senescence in cancer treatment. Cancer Res 2003; 63:2705-15; PMID:12782571 [PubMed] [Google Scholar]
- 8. Chen QM, Bartholomew JC, Campisi J, Acosta M, Reagan JD, Ames BN. Molecular analysis of H2O2-induced senescent-like growth arrest in normal human fibroblasts: p53 and Rb control G1 arrest but not cell replication. Biochem J 1998; 332 (Pt 1):43-50; PMID:9576849 [DOI] [PMC free article] [PubMed] [Google Scholar]
- 9. Momparler RL. Epigenetic therapy of cancer with 5-aza-2’-deoxycytidine (decitabine). Semin Oncol 2005; 32:443-51; PMID:16210084; http://dx.doi.org/ 10.1053/j.seminoncol.2005.07.008 [DOI] [PubMed] [Google Scholar]
- 10. Elmore LW, Rehder CW, Di X, McChesney PA, Jackson-Cook CK, Gewirtz DA, Holt SE. Adriamycin-induced senescence in breast tumor cells involves functional p53 and telomere dysfunction. J Biol Chem 2002; 277:35509-15; PMID:12101184; http://dx.doi.org/ 10.1074/jbc.M205477200 [DOI] [PubMed] [Google Scholar]
- 11. Sherr CJ, McCormick F. The RB and p53 pathways in cancer. Cancer Cell 2002; 2:103-12; PMID:12204530; http://dx.doi.org/ 10.1016/S1535-6108(02)00102-2 [DOI] [PubMed] [Google Scholar]
- 12. Zhang R, Chen W, Adams PD. Molecular dissection of formation of senescence-associated heterochromatin foci. Mol Cell Biol 2007; 27:2343-58; PMID:17242207; http://dx.doi.org/ 10.1128/MCB.02019-06 [DOI] [PMC free article] [PubMed] [Google Scholar]
- 13. Dimri GP, Lee X, Basile G, Acosta M, Scott G, Roskelley C, Medrano EE, Linskens M, Rubelj I, Pereira-Smith O, et al. A biomarker that identifies senescent human cells in culture and in aging skin in vivo. Proc Natl Acad Sci U S A 1995; 92:9363-7; PMID:7568133; http://dx.doi.org/ 10.1073/pnas.92.20.9363 [DOI] [PMC free article] [PubMed] [Google Scholar]
- 14. Kuilman T, Michaloglou C, Mooi WJ, Peeper DS. The essence of senescence. Genes Dev 2010; 24:2463-79; PMID:21078816; http://dx.doi.org/ 10.1101/gad.1971610 [DOI] [PMC free article] [PubMed] [Google Scholar]
- 15. Coppe JP, Desprez PY, Krtolica A, Campisi J. The senescence-associated secretory phenotype: the dark side of tumor suppression. Annu Rev Pathol 2010; 5:99-118; PMID:20078217; http://dx.doi.org/ 10.1146/annurev-pathol-121808-102144 [DOI] [PMC free article] [PubMed] [Google Scholar]
- 16. Velarde MC, Demaria M, Campisi J. Senescent cells and their secretory phenotype as targets for cancer therapy. Interdiscip Top Gerontol 2013; 38:17-27; PMID:23503512; http://dx.doi.org/ 10.1159/000343572 [DOI] [PMC free article] [PubMed] [Google Scholar]
- 17. Kulaeva OI, Draghici S, Tang L, Kraniak JM, Land SJ, Tainsky MA. Epigenetic silencing of multiple interferon pathway genes after cellular immortalization. Oncogene 2003; 22:4118-27; PMID:12821946; http://dx.doi.org/ 10.1038/sj.onc.1206594 [DOI] [PubMed] [Google Scholar]
- 18. Li Q, Tang L, Roberts PC, Kraniak JM, Fridman AL, Kulaeva OI, Tehrani OS, Tainsky MA. Interferon regulatory factors IRF5 and IRF7 inhibit growth and induce senescence in immortal Li-Fraumeni fibroblasts. Mol Cancer Res 2008; 6:770-84; PMID:18505922; http://dx.doi.org/ 10.1158/1541-7786.MCR-07-0114 [DOI] [PMC free article] [PubMed] [Google Scholar]
- 19. Tang L, Roberts PC, Kraniak JM, Li Q, Tainsky MA. Stat1 expression is not sufficient to regulate the interferon signaling pathway in cellular immortalization. J Interferon Cytokine Res 2006; 26:14-26; PMID:16426144; http://dx.doi.org/ 10.1089/jir.2006.26.14 [DOI] [PubMed] [Google Scholar]
- 20. Bischoff FZ, Yim SO, Pathak S, Grant G, Siciliano MJ, Giovanella BC, Strong LC, Tainsky MA. Spontaneous abnormalities in normal fibroblasts from patients with Li-Fraumeni cancer syndrome: aneuploidy and immortalization. Cancer Res 1990; 50:7979-84; PMID:2253239 [PubMed] [Google Scholar]
- 21. Moolmuang B, Tainsky MA. CREG1 enhances p16INK4a induced cellular senescence. Cell Cycle 2011; 10:518-30; PMID:21263217; http://dx.doi.org/ 10.4161/cc.10.3.14756 [DOI] [PMC free article] [PubMed] [Google Scholar]
- 22. Pereira-Smith OM, Smith JR. Evidence for the recessive nature of cellular immortality. Science 1983; 221:964-6; PMID:6879195; http://dx.doi.org/ 10.1126/science.6879195 [DOI] [PubMed] [Google Scholar]
- 23. Fridman AL, Tainsky MA. Critical pathways in cellular senescence and immortalization revealed by gene expression profiling. Oncogene 2008; 27:5975-87; PMID:18711403; http://dx.doi.org/ 10.1038/onc.2008.213 [DOI] [PMC free article] [PubMed] [Google Scholar]
- 24. Draghici S, Khatri P, Tarca AL, Amin K, Done A, Voichita C, Georgescu C, Romero R. A systems biology approach for pathway level analysis. Genome Res 2007; 17:1537-45; PMID:17785539; http://dx.doi.org/ 10.1101/gr.6202607 [DOI] [PMC free article] [PubMed] [Google Scholar]
- 25. Janssens S, Beyaert R. Functional diversity and regulation of different interleukin-1 receptor-associated kinase (IRAK) family members. Mol Cell 2003; 11:293-302; PMID:12620219; http://dx.doi.org/ 10.1016/S1097-2765(03)00053-4 [DOI] [PubMed] [Google Scholar]
- 26. Loiarro M, Sette C, Gallo G, Ciacci A, Fanto N, Mastroianni D, Carminati P, Ruggiero V. Peptide-mediated interference of TIR domain dimerization in MyD88 inhibits interleukin-1-dependent activation of NF-{kappa}B. J Biol Chem 2005; 280:15809-14; PMID:15755740; http://dx.doi.org/ 10.1074/jbc.C400613200 [DOI] [PubMed] [Google Scholar]
- 27. Orjalo AV, Bhaumik D, Gengler BK, Scott GK, Campisi J. Cell surface-bound IL-1alpha is an upstream regulator of the senescence-associated IL-6/IL-8 cytokine network. Proc Natl Acad Sci U S A 2009; 106:17031-6; PMID:19805069; http://dx.doi.org/ 10.1073/pnas.0905299106 [DOI] [PMC free article] [PubMed] [Google Scholar]
- 28. Nelson G, Wordsworth J, Wang C, Jurk D, Lawless C, Martin-Ruiz C, von Zglinicki T. A senescent cell bystander effect: senescence-induced senescence. Aging Cell 2012; 11:345-9 [DOI] [PMC free article] [PubMed] [Google Scholar]
- 29. Freund A, Orjalo AV, Desprez PY, Campisi J. Inflammatory networks during cellular senescence: causes and consequences. Trends Mol Med 2010; 16:238-46; PMID:20444648; http://dx.doi.org/ 10.1016/j.molmed.2010.03.003 [DOI] [PMC free article] [PubMed] [Google Scholar]
- 30. Acosta JC, Banito A, Wuestefeld T, Georgilis A, Janich P, Morton JP, Athineos D, Kang TW, Lasitschka F, Andrulis M, et al. A complex secretory program orchestrated by the inflammasome controls paracrine senescence. Nat Cell Biol 2013; 15:978-90; PMID:23770676; http://dx.doi.org/ 10.1038/ncb2784 [DOI] [PMC free article] [PubMed] [Google Scholar]
- 31. Garfinkel S, Brown S, Wessendorf JH, Maciag T. Post-transcriptional regulation of interleukin 1 alpha in various strains of young and senescent human umbilical vein endothelial cells. Proc Natl Acad Sci U S A 1994; 91:1559-63; PMID:8108444; http://dx.doi.org/ 10.1073/pnas.91.4.1559 [DOI] [PMC free article] [PubMed] [Google Scholar]
- 32. Hubackova S, Krejcikova K, Bartek J, Hodny Z. IL1- and TGFbeta-Nox4 signaling, oxidative stress and DNA damage response are shared features of replicative, oncogene-induced, and drug-induced paracrine ‘bystander senescence’. Aging (Albany NY) 2012; 4:932-51; PMID:23385065 [DOI] [PMC free article] [PubMed] [Google Scholar]
- 33. Xin H, Curry J, Johnstone RW, Nickoloff BJ, Choubey D. Role of IFI 16, a member of the interferon-inducible p200-protein family, in prostate epithelial cellular senescence. Oncogene 2003; 22:4831-40; PMID:12894224; http://dx.doi.org/ 10.1038/sj.onc.1206754 [DOI] [PubMed] [Google Scholar]
- 34. Untergasser G, Koch HB, Menssen A, Hermeking H. Characterization of epithelial senescence by serial analysis of gene expression: identification of genes potentially involved in prostate cancer. Cancer Res 2002; 62:6255-62; PMID:12414655 [PubMed] [Google Scholar]
- 35. Williams G. Pleiotropy, natural selection and the evolution of senescence. Evolution 1957; 11:398-411; http://dx.doi.org/ 10.2307/2406060 [DOI] [Google Scholar]
- 36. Wilson VL, Jones PA. DNA methylation decreases in aging but not in immortal cells. Science 1983; 220:1055-7; PMID:6844925; http://dx.doi.org/ 10.1126/science.6844925 [DOI] [PubMed] [Google Scholar]
- 37. Grandjenette C, Schnekenburger M, Karius T, Ghelfi J, Gaigneaux A, Henry E, Dicato M, Diederich M. 5-aza-2’-deoxycytidine-mediated c-myc Down-regulation Triggers Telomere-dependent Senescence by Regulating Human Telomerase Reverse Transcriptase in Chronic Myeloid Leukemia. Neoplasia 2014; 16:511-28; PMID:24970385 [DOI] [PMC free article] [PubMed] [Google Scholar]
- 38. Lander ES, Linton LM, Birren B, Nusbaum C, Zody MC, Baldwin J, Devon K, Dewar K, Doyle M, FitzHugh W, et al. Initial sequencing and analysis of the human genome. Nature 2001; 409:860-921; PMID:11237011; http://dx.doi.org/ 10.1038/35057062 [DOI] [PubMed] [Google Scholar]
- 39. Trapnell C, Pachter L, Salzberg SL. TopHat: discovering splice junctions with RNA-Seq. Bioinformatics 2009; 25:1105-11; PMID:19289445; http://dx.doi.org/ 10.1093/bioinformatics/btp120 [DOI] [PMC free article] [PubMed] [Google Scholar]
- 40. Trapnell C, Williams BA, Pertea G, Mortazavi A, Kwan G, van Baren MJ, Salzberg SL, Wold BJ, Pachter L. Transcript assembly and quantification by RNA-Seq reveals unannotated transcripts and isoform switching during cell differentiation. Nat Biotechnol 2010; 28:511-5; PMID:20436464; http://dx.doi.org/ 10.1038/nbt.1621 [DOI] [PMC free article] [PubMed] [Google Scholar]
Associated Data
This section collects any data citations, data availability statements, or supplementary materials included in this article.