

Abstract
Alterations in the gut microbiota are correlated with ailments such as obesity, inflammatory bowel disease, and diarrhea. Up to 60% of individuals traveling from industrialized to developing countries acquire a form of secretory diarrhea known as travelers' diarrhea (TD), and enterotoxigenic Escherichia coli (ETEC) and norovirus (NoV) are the leading causative pathogens. Presumably, TD alters the gut microbiome, however the effect of TD on gut communities has not been studied. We report the first analysis of bacterial gut populations associated with TD. We examined and compared the gut microbiomes of individuals who developed TD associated with ETEC, NoV, or mixed pathogens, and TD with no pathogen identified, to healthy travelers. We observed a signature dysbiotic gut microbiome profile of high Firmicutes:Bacteroidetes ratios in the travelers who developed diarrhea, regardless of etiologic agent or presence of a pathogen. There was no significant difference in α-diversity among travelers. The bacterial composition of the microbiota of the healthy travelers was similar to the diarrheal groups, however the β-diversity of the healthy travelers was significantly different than any pathogen-associated TD group. Further comparison of the healthy traveler microbiota to those from healthy subjects who were part of the Human Microbiome Project also revealed a significantly higher Firmicutes:Bacteriodetes ratio in the healthy travelers and significantly different β-diversity. Thus, the composition of the gut microbiome in healthy, diarrhea-free travelers has characteristics of a dysbiotic gut, suggesting that these alterations could be associated with factors such as travel.
Keywords: dysbiosis, enterotoxigenic Escherichia coli, gastrointestinal disease, microbiome, norovirus, travelers' diarrhea
Abbreviations
- DAEC
diffuse-adhering E. coli
- EAEC
enteroaggregative E. coli
- ETEC
enterotoxigenic E. coli
- HMP
Human Microbiome Project
- IBD
inflammatory bowel disease
- IBS
irritable bowel syndrome
- NoV + Ec
norovirus plus pathogenic E. coli
- NoV
norovirus
- NPI
no pathogen identified
- nt
nucleotide
- OTU
operational taxonomic unit
- rDNA
ribosomal DNA
- TD
travelers' diarrhea
- rRNA
ribosomal RNA
Introduction
Globally, infectious diarrhea affects about one billion individuals each year. Unless comorbidities exist, most cases are not life threatening and resolve within several days, yet in developing countries it is a leading cause of malnutrition and mortality in children. Up to 100 million people travel from industrialized to these developing countries each year, and 40–60% of them will develop diarrhea.1,2 This travelers' diarrhea (TD) is clinically defined as the passing of 3 or more unformed stools within a 24-hour period accompanied by at least one additional enteric symptom, including vomiting, abdominal cramps, fever, and nausea.3 TD is acquired by consuming local contaminated food and water and results in severe dehydration, can become incapacitating, and causes major disruptions in business and personal travel and military service.4,5
A variety of pathogens are known to cause TD, including bacteria, such as enterotoxigenic, enteroaggregative, and diffuse-adhering Escherichia coli (ETEC, EAEC, and DAEC, respectively), Campylobacter, Salmonella, and Shigella, viruses, [e.g. norovirus (NoV), rotavirus and astroviruses], and parasites, such as Giardia, Entameoba, and Strongyloides. Yet, in 25–40% of cases, no etiologic agent can be correlated with disease.1,6,7 TD studies include research on the identification and diagnosis of etiologic agents, epidemiology, treatments, and preventative measures. A critical component that has been overlooked is the gut microbiome and how it is affected by TD.
The gut microbiome functions as a protective barrier to incoming pathogens, is responsible for synthesis of essential vitamins and degradation of complex polysaccharides, and aids in immune system development.8–10 A number of diseases have been correlated with alterations in the composition of the human gut microbiome resulting in a state known as dysbiosis. This dysbiotic state is often characterized by a high abundance of bacteria in the phylum Firmicutes, and is accompanied by an increase of bacteria belonging to the phylum Proteobacteria and fewer members of the Bacteroidetes. Low bacterial diversity is another hallmark of dysbiosis. Dysbiotic gut microbiomes have been associated with obesity,11,12 irritable bowel syndrome (IBS),13,14 and inflammatory bowel diseases (IBD).15 This is in contrast to the healthy gut microbiome, which is generally dominated by Bacteroidetes and composed of fewer members of the Firmicutes, Actinobacteria, and Proteobacteria, respectively. These generalities are not true for every individual but have been reported in the healthy Western population.
With the exception of studies on Clostridium difficile-associated diarrhea,16 IBS-diarrhea subtype,13,14,17 one study examining norovirus-associated diarrhea,18 and one study exploring diarrhea in infants and children under 5 y of age,19 there have been few community surveys of the gut microbiome during diarrheal disease in humans. None have examined the bacterial gut communities associated with travelers' diarrhea. We used bacterial 16S rDNA profiling to characterize and compare gut communities of individuals who developed pathogen-associated TD (from NoV, ETEC, and ETEC plus pathogenic E. coli co-infections), to individuals who developed TD where a pathogen was not identified, and to healthy, diarrhea-free travelers. Understanding the alterations that occur in the bacterial gut communities during TD may aid in development of better treatment regimens and preventative measures.
Results
Samples and sequencing statistics
To determine how pathogens associated with TD might alter the bacterial populations of the human gastrointestinal tract, we performed a retrospective bacterial 16S rDNA sequencing study using single stool samples collected from 111 individuals who traveled from the US to Central America or India between 2005 and 2010. Each stool sample was tested for the presence of known diarrheal pathogens using previously described diagnostic methods.3,20-23 The only pathogens identified in these samples were E. coli and NoV. The E. coli strains identified were ETEC, EAEC and DAEC (Tables S2A and S2C), with ETEC predominating. In previous work, we evaluated the ETEC, no pathogen identified (NPI), and healthy traveler samples for the presence and relative gene copy number of the ETEC toxin genes, eltA, sta1, and sta2 by qPCR;22 quantification of toxin genes for the ETEC group is summarized in Supplemental Table 2A; ETEC was identified in a single healthy traveler at low titer (Table S2E). NoV was detected in some samples, and for positive samples, genogroups were typed by qPCR (Tables S2B and S2C).20 Based on these diagnostic assays, the diarrheal stool samples were categorized into 4 groups: ETEC (n = 38 ), NoV (n = 7), NoV + Ec (n = 17), and NPI (n = 43). Twelve stool samples from healthy, diarrhea-free travelers were included as controls. DNA was extracted from each sample, and the amplified 16S rRNA gene V3-V5 variable regions were sequenced to determine the bacterial diversity of each sample.
Table 2.
Median values (interquartile ranges) of bacterial community richness metrics.
| Metric | ETEC | NoV | NoV + Ec | NPI | HT | KW p Value | HMP | WRS p Valuea |
|---|---|---|---|---|---|---|---|---|
| Chao1 | 98 (76) | 144 (49) | 152 (45) | 99 (48) | 109 (67) | 0.02b | 121 (87) | 0.22 |
| Sobs | 65 (40) | 98 (23) | 87 (23) | 63 (38) | 55 (26) | 0.02c | 74 (50) | 0.25 |
ETEC = enterotoxigenic E. coli.
NoV = norovirus.
NoV + Ec = norovirus + pathogenic E. coli.
NPI = no pathogen identified.
HT = healthy traveler.
HMP = human microbiome project.
KW = Kruskal-Wallis rank sum test.
WRS = Wilcoxon rank sum test.
HMP vs. HT.
NoV + Ec vs. NPI, p = 0.04.
NoV vs. HT p = 0.03, NoV vs. NPI p = 0.02.
Following sequence read quality trimming and chimera removal, the range of coverage per sample was >98%, and the average read length was >240 nt. To account for uneven sequencing depth between samples, we rarefied each sample to 2,938 sequences (the lowest number of reads closest to our target of 3,000) by random subsampling prior to downstream community analyses. This resulted in the elimination of 3 ETEC samples and 3 NPI samples from the analysis because of low read counts. Sequencing statistics by group are summarized in Table 1.
Table 1.
Sequencing statistics for diarrheal and control groups
| Number of Sequences |
Number of Samples |
|||
|---|---|---|---|---|
| Sample Group | After Quality Trimming | After Processing Pipeline | Included in Study | Included in Analysesa |
| ETEC | 567,817 | 462,214 | 38 | 35 |
| NoV | 54,649 | 42,122 | 7 | 7 |
| NoV + Ec | 133,910 | 97,666 | 17 | 17 |
| NPI | 719,410 | 559,155 | 43 | 40 |
| HT | 69,436 | 57,431 | 12 | 12 |
| HMP | 2,156,219 | 1,709,262 | NA | 235 |
Based on 2,938 sequences per sample.
ETEC = enterotoxigenic E. coli.
NoV = norovirus.
NPI = no pathogen identified.
HT = healthy traveler.
HMP = human microbiome project.
The TD microbiome resembles a dysbiotic microbiome
The mean relative abundances of post-processed sequence reads by group are shown in Figure 1. The most abundant phyla in the diarrheal groups were the Firmicutes, Bacteroidetes, and Proteobacteria, consecutively. In general, the abundance profiles of the individual subjects were reflective of the aggregate, although there was a continuum (Fig. S1). Among the diarrheal groups, there was only a significant difference in the abundance of the Bacteroidetes between the NoV + Ec group (15%), and the NPI group (5%, p = 0.007). We tested each of the following sample metadata features (Table S1) for significant differences within each sample group: travel destination, year collected, ETEC toxin type, ETEC toxin gene copy number, and NoV genogroup. None of the correlations between any of these features were significant. Thus, we conclude that TD, independent of pathogen, including unidentified pathogens, is associated with general alterations seen in other gut-associated diseases (low Bacteroidetes:Firmicutes ratio).11,12 We also observed that the community abundance profile of the healthy traveler group was similar to that of the TD groups, although it was distinguished by having a very low abundance of Bacteroidetes (0.5%), which was significantly less than the NoV + Ec (15%, p = 0.0002) and NoV (23%, p = 0.01) groups. This will be discussed in more detail below.
Figure 1.
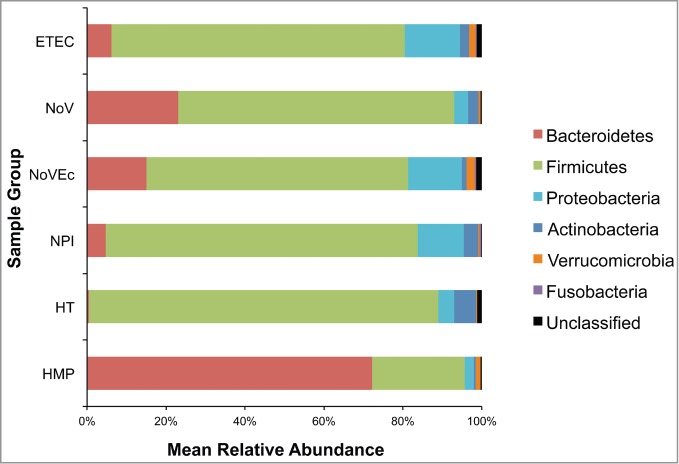
Phylum-level mean relative abundance of bacterial populations for diarrheal and control groups. Variable regions 3 through 5 of the bacterial 16S rRNA gene were amplified, sequenced using 454 pyrosequencing, and processed using mothur version 31. High quality, chimera-free sequences were used to generate OTUs based on 97% sequence identity, and OTUs were classified using the Ribosomal Database Project Version 9.
Three metrics were used to calculate and estimate the differences in α-diversity, or within sample diversity, of the diarrheal and control groups. The Chao1 richness estimator and observed OTUs (Sobs) were calculated to estimate richness, or the number of taxa, or OTUs, in a community (Table 2). Among the traveler groups, the NoV + Ec and NoV groups had the highest estimated richness with median Chao1 values of 152 and 144 OTUs, respectively. The healthy travelers had an estimated richness of 109 OTUs, and the ETEC and NPI groups had Chao1 values of 98 and 99, respectively. There was a significant difference in community richness between the NoV + Ec and NPI groups (p = 0.04). The Sobs for each traveler group followed a similar pattern, although in general, the values were lower (about 65%) than the Chao1 results. There was a significant difference in Sobs within the traveler groups, specifically when comparing the NoV group to the healthy traveler and NPI groups (p = 0.03 and 0.02, respectively).
We also calculated the inverse Simpson diversity index (1/D) to evaluate both richness and evenness between the diarrheal and control groups (Fig. 2). The NoV group had the most diverse community (median 1/D = 13), while the remaining diarrheal groups and the healthy traveler group had similar median diversity indices indicating similar number and distribution of taxa within samples.
Figure 2.
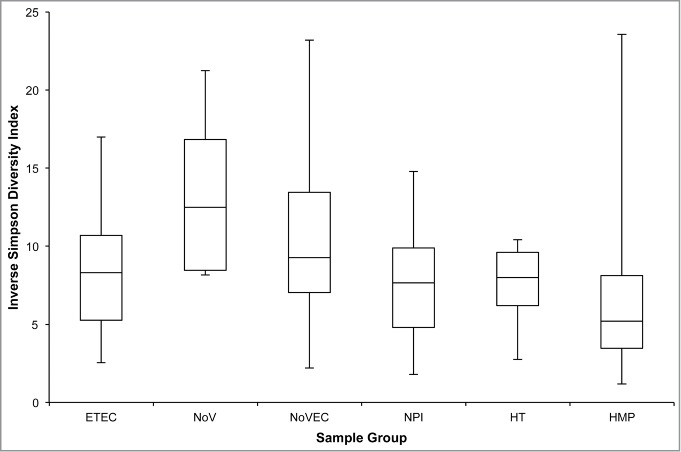
Inverse Simpson Diversity by sampling group. The inverse Simpson's diversity index was calculated using mothur version 31. Boxes represent the first quartile (bottom), median value (middle line), and third quartile (top). Bottom whiskers were calculated by subtracting the minimum value from the first quartile and top whiskers were calculated by subtracting the third quartile from the maximum value.
To compare β-diversity, or between sample diversity, we generated a θYC distance matrix, which was plotted using non-metric dimensional scaling (Fig. 3). Pairwise comparisons of each sample in the healthy traveler group to those in the ETEC, NoV, and NoV + Ec groups were significant (p ≤ 0.001) but not when compared to those in the NPI group (Fig. 3A). Thus, while there are similar numbers of OTUs in each group, the structures of most of the bacterial communities are different.
Figure 3.
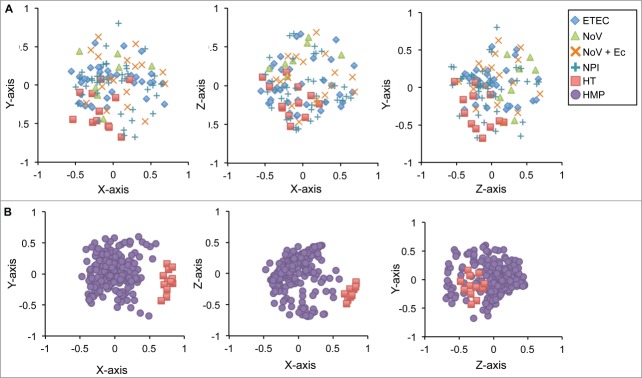
Differences in community structure between diarrheal and control groups. Non-metric multidimensional scaling was used to plot θYC distances, which represent bacterial community structures. Samples with similar community structures cluster closer together.
To better understand the diarrheal communities, we examined the differences in taxa present in each group. We focused our analysis on the top 100 OTUs, which contained 97% of the sequences. We identified 11 OTUs with abundances that were significantly different: four classified to the phylum Bacteroidetes, six to Firmicutes and one to Proteobacteria (Table 3). The NoV + Ec group had the highest median abundance of one of the two OTUs classified as Bacteroides (OTU11) and this was the only group that had a significant abundance of two OTUs: OTU58, which was classified to the Clostridium XIVb cluster within the Lachnospiraceae family, and OTU98, which was classified as Bilophila. In addition to having the highest median percent abundance of the second Bacteroides species (OTU20), the NoV group also had the highest median percent abundance of Alistipes, Barnesiella, Roseburia, and OTU66, which classified as a member of the Lachnospiraceae family. Here, the healthy traveler group contained the highest median abundance of Streptococcus and was the only group that contained a significant abundance of two species of Lactococcus (OTU37 and OTU76).
Table 3.
Percent median relative abundance (interquartile range) of significantly different OTUs between traveler groups
| OTU | Classification | ETEC | NoV | NoV + Ec | NPI | HT |
|---|---|---|---|---|---|---|
| Bacteroidetes | ||||||
| 11 | Bacteroides | 0.20 (0.56) | 0.88 (12.42) | 2.21 (5.45) | 0.17 (0.67) | 0.09 (0.17) |
| 20 | Bacteroides | 0.10 (0.48) | 1.74 (4.77) | 1.02 (1.46) | 0.12 (0.43) | 0.02 (0.08) |
| 25 | Alistipes | 0.07 (0.24) | 4.05 (4.14) | 0.20 (1.26) | 0 (0.07) | 0 (0.03) |
| 41 | Barnesiella | 0 (0.03) | 0.54 (1.26) | 0.10 (2.42) | 0 (0.07) | 0 (0) |
| Firmicutes | ||||||
| 6 | Streptococcus | 0.51 (1.29) | 0.17 (0.71) | 1.26 (5.85) | 1.84 (3.03) | 7.40 (12.72) |
| 37 | Lactococcus | 0 (0) | 0 (0) | 0 (0) | 0 (0.03) | 0.12 (1.94) |
| 46 | Roseburia | 0.07 (0.15) | 0.88 (2.77) | 0.14 (1.16) | 0 (0.07) | 0 (0.03) |
| 58 | Lachnospiraceae | 0 (0) | 0 (0.02) | 0.03 (0.27) | 0 (0.07) | 0 (0) |
| 66 | Lachnospiraceae | 0.03 (0.12) | 0.14 (0.20) | 0.10 (0.20) | 0.03 (0.14) | 0 (0) |
| 76 | Lactococcus | 0 (0) | 0 (0.05) | 0 (0.03) | 0 (0.04) | 0.27 (0.52) |
| Proteobacteria | ||||||
| 98 | Bilophila | 0 (0.02) | 0 (0.03) | 0.03 (0.44) | 0 (0) | 0 (0) |
ETEC = enterotoxigenic E. coli.
NoV = norovirus.
NoV + Ec = norovirus + pathogenic E. coli.
NPI = no pathogen identified.
HT = healthy traveler.
The gut microbiota of healthy travelers is disrupted
The high abundance of Firmicutes observed in the healthy travelers (Fig. 1) was an unexpected finding. Unfortunately, we did not have pre-travel stool samples from these subjects as temporal controls. To compare these results to a healthy cohort, we chose to use data from the HMP as a reference set. Importantly, the TD stool samples and the BCM Human Microbiome Project (HMP) samples were processed and sequenced in our laboratories, which provided internal consistency. As shown in Fig. 1, and previously reported by the HMP Consortium,24 the aggregate bacterial abundance of the HMP stool samples is dominated by the Bacteroidetes (73%) followed by the Firmicutes (24%). In contrast, the healthy travelers have significantly fewer Bacteroidetes (0.5%, p = 4.7 x 10⁻⁸) and significantly more Firmicutes (89%, p = 4.7 × 10⁻⁸) and Actinobacteria (6%, p = 4.7 × 10⁻⁸) than the HMP cohort.
Based on Chao1 and Sobs calculations, the bacterial community richness of both healthy traveler and HMP groups are similar (Table 2). The median microbial diversity of the HMP group (median 1/D = 5) is less than that of the healthy travelers (median 1/D = 8), however the difference is not significant, and the HMP variation is broad (Fig. 2). We expected that the healthy traveler community might be less diverse based on the dysbiotic gut microbiome profile observed in Figure 1 and from previous studies showing this disrupted profile is associated with decreased diversity.11,12 Examination of the differences in community structure, by plotting θYC distances using non-metric dimensional scaling (Fig. 3B), however, clearly illustrated that the healthy traveler and HMP stool communities were distinct.
To identify taxa that distinguish the healthy travelers and the HMP cohort, we combined sequences from these two groups and repeated the sequence analysis methods described for the traveler groups. This generated a new set of OTUs that were specific to the healthy traveler-HMP comparison. We again compared the median abundances of the top 100 OTUs and identified 33 OTUs with significantly different median percent abundances (Table 4). As expected, the HMP cohort contained many more significant OTUs belonging to Bacteroidetes. Two species of Bacteroides (OTU1 and OTU2) were strikingly more abundant in the HMP cohort. Additionally, Odoribacter, two species of Parabacteroides, and two species of Alistipes were more prevalent in the HMP cohort. Twenty-two of the 33 OTUs were classified as Firmicutes, and within this phylum, the largest difference was seen in OTU12, which was classified as a member of the Lachnospiraceae family and was more prevalent in the healthy traveler group. The healthy traveler group also had more abundant relative representation of Streptococcus, Coprococcus, Enterococcus, Anaerostipes, Clostridium XI, and Clostridium XVIII species, two species of Blautia, and two additional OTUs that classified in the family Lachnospiraceae. The OTUs that were significantly more prevalent in the HMP cohort were Roseburia, Oscillibacter, Flavonifractor, and OTU7, which is a member of the Lachnospiraceae. Three additional OTUs that are members of the Lachnospiraceae family, two OTUs that are members of the Ruminococcaceae family, and one OTU that classified as a member of the order Clostridiales were more abundant in the HMP cohort. Two OTUs belonging to the phylum Proteobacteria were significantly different between groups: these were Escherichia, which was more prevalent in the healthy traveler group, and Parasutterella, which was more abundant in the HMP cohort. Two members of the phylum Actinobacteria, Bifidobacterium and Collinsella, were more abundant in the healthy traveler group.
Table 4.
Percent median relative abundance (interquartile range) of significantly different OTUs between healthy travelers and HMP subjects by phylum.
| OTU | Classification | HT | HMP |
|---|---|---|---|
| Actinobacteria | |||
| 47 | Bifidobacterium | 1.65 (6.12) | 0 (0.28) |
| 82 | Collinsella | 0.39 (2.00) | 0 (0.03) |
| Bacteroidetes | |||
| 1 | Bacteroides | 0.07 (0.25) | 24.91 (24.35) |
| 2 | Bacteroides | 0.09 (0.14) | 19.64 (18.96) |
| 3 | Alistipes | 0.02 (0.43) | 3.74 (5.40) |
| 6 | Parabacteroides | 0 (0) | 1.53 (3.74) |
| 9 | Parabacteroides | 0 (0) | 0.82 (2.01) |
| 26 | Odoribacter | 0 (0) | 0.27 (0.77) |
| 58 | Alistipes | 0 (0) | 0 (0.15) |
| Firmicutes | |||
| 18 | Lachnospiraceae* | 0 (0.03) | 0.34 (0.78) |
| 11 | Ruminococcaceae* | 0 (0.08) | 0.68 (1.97) |
| 37 | Oscillibacter | 0 (0) | 0.14 (0.24) |
| 56 | Lachnospiraceae* | 0 (0) | 0.07 (0.12) |
| 59 | Lachnospiraceae* | 0 (0) | 0.07 (0.17) |
| 71 | Flavonifractor | 0 (0) | 0.03 (0.10) |
| 19 | Clostridiales* | 0.02 (0.09) | 0.27 (0.82) |
| 15 | Roseburia* | 0.05 (0.07) | 0.41 (1.09) |
| 7 | Lachnospiraceae* | 0.12 (0.54) | 0.92 (1.82) |
| 4 | Ruminococcaceae* | 0.20 (0.32) | 3.03 (5.33) |
| 57 | Anaerostipes* | 0.22 (2.42) | 0 (0) |
| 60 | Erysipelotrichaceae | 0.71 (0.88) | 0 (0.07) |
| 67 | Enterococcus | 0.97 (3.93) | 0 (0) |
| 44 | Coprococcus* | 1.11 (1.80) | 0.07 (0.17) |
| 24 | Lachnospiraceae* | 1.51 (3.16) | 0.17 (0.36) |
| 49 | Blautia* | 1.58 (4.69) | 0 (0.07) |
| 25 | Blautia* | 2.14 (6.59) | 0.10 (0.20) |
| 42 | Peptostreptococcaceae* | 4.12 (7.05) | 0 (0.03) |
| 36 | Lachnospiraceae* | 4.56 (7.72) | 0 (0.07) |
| 29 | Streptococcus | 6.76 (15.01) | 0 (0.03) |
| 12 | Lachnospiraceae* | 19.40 (10.92) | 0.51 (0.83) |
| Proteobacteria | |||
| 39 | Escherichiaa | 1.32 (2.44) | 0 (0.03) |
| 16 | Parasutterella | 0 (0) | 0.10 (0.97) |
Member of the order Clostridiales.
Genus identified using megablast against the NCBI nucleotide database.
Co-occurrence networks in NPI and pathogen-associated TD
We performed network analysis to examine differences in co-occurrences of taxa in the presence and absence of known TD pathogens. Here, we created two networks for comparison: one combining all pathogen-associated diarrheal OTUs and one corresponding to the NPI OTUs. We did not create a network for the healthy traveler group because the number of samples was too small and would not allow for meaningful interpretations and valid conclusions. After removing low variance OTUs (Figs. S2A-B), an undirected Poisson graphical model was applied to capture conditional relationships within each group. Of the 239 OTUs included in the analysis, the two most abundant OTUs in both groups were OTU1, which classified as Lachnospiraceae, and OTU2, which classified as Escherichia (Fig. 4). Within the pathogen-associated group there were two OTUs that only co-occurred with OTU1 (Lachnospiraceae), these were OTU6 (Streptococcus) and OTU9 (Lachnospiraceae). Six OTUs co-occurred only with OTU2 (Escherichia): OTU28 (Eubacterium), OTU13 (Blautia), OTU21 (Akkermansia), OTU46 (Roseburia), OTU26 (Ruminococcaceae), and OTU29 (Acinetobacter), which also occurred with OTU33 (Chryseobacterium) (Fig. 4A). The co-occurrence network in the NPI group was more complex (37 OTUs/nodes) than the pathogen-associated group (22 OTUs/nodes). Eight OTUs co-occurred with only OTU1 (Lachnospiraceae): OTU20 (Bacteroides), OTU30 (Lachnospiraceae), OTU55 (Lactobacillales), OTU63 (Actinobacteria), OTU21 (Akkermansia), OTU45 (Blautia), OTU48 (Firmicutes), and OTU65 (Weissella). Four OTUs co-occurred with only OTU2 (Escherichia): OTU18 (Erysipelotrichaceae), OTU38 (Erysipelotrichaceae), OTU11 (Bacteroides), and OTU32 (Acidaminococcaceae) (Fig. 4B).
Figure 4.
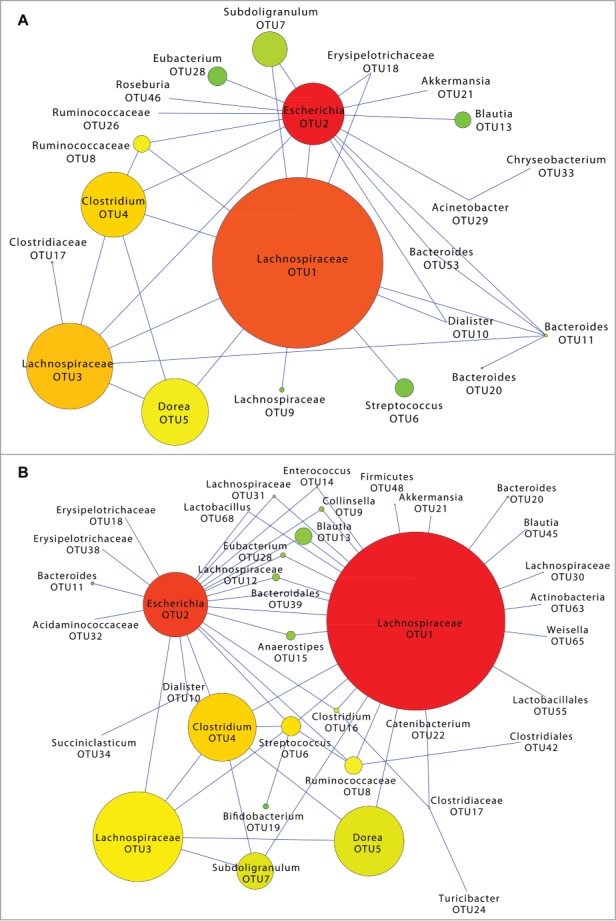
OTU co-occurrence networks in pathogen-associated and no pathogen identified travelers' diarrhea communities. Low abundance OTUs were filtered prior to applying an undirected sub-linear graphical model to capture co-occurrences of OTUs in pathogen-associated TD (A) and no pathogen identified TD (B) groups. Node size corresponds to OTU median abundance. Node color represents the number of connections from red (many connections) to green (one connection).
Discussion
Early non-molecular stool culture studies demonstrated that the bacterial flora of people changed when they left their home countries and traveled to developing regions.25 These changes were assumed to relate to the ingestion of foods that contained heavier counts of bacteria in the new locale.26 We used bacterial 16S rDNA profiling in a retrospective analysis of the human gut microbiome during TD to identify differences based on two of the most common etiologic agents associated with TD. We compared the bacterial communities of TD and control groups: ETEC, NoV, NoV + Ec, NPI, and healthy, diarrhea-free travelers. Our results indicate that diarrhea is associated with similar bacterial communities regardless of the etiologic agent, or absence of a known etiologic agent (Fig. 1). The phylum-level profiles we observed are similar to profiles observed in other studies of gut dysbioses, specifically, those in seen in obesity, IBS-diarrhea subtype, IBD, and recurrent antibiotic-associated C. difficile infections. In all cases, the healthy controls contained a high Bacteroidetes:Firmicutes ratio and the diseased groups contained lower Bacteroidetes:Firmicutes ratios.11-14,16 Generally, increased bacterial diversity is associated with a healthy gut, and the above studies also associated decreases in α-diversity to obesity, IBS-diarrhea subtype, and infections with Clostridium difficile. While we did not directly compare the diversity of the diarrheal groups to the healthy HMP cohort, it is apparent that the diversity indices of the diarrheal groups are comparable to, or greater than, the HMP group; therefore our diversity results were not consistent with other studies examining diversity of the gut microbiome during dysbiosis. Our samples were collected within 72 hours of acute illness, and it is possible that communities from samples collected in the 72-hour range may have already shifted to a more diverse population. For example, the diarrheal episodes that occur within the first 24 hours would presumably displace several members of the population, which would result in an initial decrease in bacterial diversity. Over time, the displaced bacteria would begin to repopulate the gut, which would result in an increase in bacterial diversity that would stabilize as diarrhea subsides. We were not able to stratify our analyses based on collection time, however it would be interesting to determine how diversity is affected during the initial hours of TD.
Only one study has examined the human gut microbiome during norovirus infection. Nelson et al. used sequencing and analysis protocols that were nearly identical to those described in this work to compare data from 38 NoV-infected subjects with data from 22 HMP individuals.18 Only ∼20% of the NoV-infected individuals (n = 7) had a dysbiotic gut microbiome, which was comprised mainly of Proteobacteria. These individuals also had decreased diversity compared to the HMP samples. The remaining samples had bacterial communities and diversity scores that were similar to the HMP, which is similar to what we observed in all of our diarrheal groups.
Our OTU-level analysis comparing the travelers (Table 3) revealed an abundance of Streptococcus in the healthy traveler group. Streptococcus species are known gut commensals, specifically Streptococcus agalactiae, however they are not generally reported as highly abundant genera in the gastrointestinal tract. Pop et al. compared the gut communities of children from Africa and Southeast Asia ages newborn to 59 months.19 The study included diarrheal and control groups and identified three streptococcal species that were positively associated with the diarrheal group. Two of these species were also associated with dysenteric diarrhea in their study. An abundance of Alistipes was observed in the NoV group. A previous study by Saulnier et al. that characterized the gut microbiome of a pediatric IBS population observed a correlation in the abundance of Alistipes with frequency of abdominal pain.17 Abdominal pain is a common complaint among individuals suffering from TD,27 but we were not able to correlate symptoms with microbial communities because this information was not available for the individuals in our study population. This underscores the importance of collection and inclusion of metadata in analyses of microbiome studies.
Within the diarrheal groups we observed an abundance of bacteria that classified within the order Clostridiales: OTU 46: Roseburia, and two Lachnospiraceae OTUs (OTU58 and OTU66). Bacteria in these taxa are known for their utilization of carbohydrates that result in the production of short chain fatty acids, specifically butyrate. Butyrate is essential for gut health and functions as a regulator of cell proliferation and differentiation.28 We speculate that the abundance of these OTUs in the diarrheal groups is a result of the gut attempting to return to a state of homeostasis.
We also observed a significant abundance of Bacteroides species in the NoV and NoV + Ec groups. Bacteroides are generally associated with a healthy gut, particularly Bacteroides thetaiotaomicron, which metabolizes polysaccharides indigestible by the host. The increase in Bacteroides seen in the NoV and NoV + Ec groups may be a consequence of fucose utilization. Fucosylated glycans are an important nutrient for Bacteroides, and murine studies have shown B. thetaiotaomicron can induce fucosylation of glycans in intestinal epithelial cells, thus enhancing its colonization potential.9 It has been suggested that mutations in host fucosyltransferases, such as the secretor fut2 gene, may alter the gut microbiota, specifically the abundance of Bacteroides species. Interestingly, susceptibility to NoV infection is linked to the secretor fut2 gene. Secretor-positive individuals have been shown to be more susceptible to NoV infection than secretor-negative individuals. Secretor status was not available for the individuals included in this study, however we speculate that those infected with NoV are secretor-positive and harbor a gut environment that potentially promotes rebound colonization of Bacteroides.
Several possible scenarios, alone, or in combination, could be responsible for the dysbiotic profile we observed in the healthy travelers. First, travel alone may disrupt the gut microbiome. Travel, especially to international destinations, can be stressful and often results in changes in sleep patterns, hydration, and alimentary routine. Second, while the individuals in the healthy traveler group were diarrhea-free at the time of stool collection, they were not followed to determine if they later developed diarrhea. It is possible that the communities identified represent a pre-diarrhea state. Third, the dysbiotic microbiome profile could be result of, or a response to, local diet and water that the subjects were exposed to at their travel destinations. Subjects did stay with host families for the duration of their visit and were presumably fed local cuisine. Our single time point study does not allow us to address any of these possibilities but emphasizes the importance of a longitudinal analysis that includes pre-, and post-travel sampling plus collection of crucial metadata, such as diet, to unravel the specific reasons for the unexpected bacterial composition observed in the healthy travelers.
Our comparison of OTUs between the healthy travelers and HMP cohort identified 33 OTUs that significantly varied in abundance (Table 4). We speculate that changes in the diets, or changes in nutrients, of the healthy travelers upon arrival to Central America or India are responsible for the observed differences. As described above, we speculate that the healthy traveler communities are attempting to shift to a homeostatic state. Seven of the 10 OTUs within the Firmicutes that are significantly more abundant in the healthy travelers are associated with healthy gut homeostasis and responsible for the metabolism of carbohydrates, such as Bacteroides, Bifidobacterium, and OTUs that classified within the Clostridiales (annotated in Table 4).
We performed network analysis to identify co-occurrence of taxa in pathogen-associated and NPI TD. While the NPI network was more complex, both networks included OTUs associated with gut health, such as Bifidobacterium, Bacteroides, and members of Clostridiales, such as Lachnospiraceae, Ruminococcaceae, Roseburia, Blautia, Coprococcus, Eubacterium, and Dorea. These results point to a potential struggle of the commensal gut bacteria to return their environment to a stable state. Co-occurrence of genera in a study characterizing the gut microbiome of Danish, French, Italian, Spanish, and Japanese individuals was hypothesized to be associated with utilization of available nutrients.29 In this study, subjects were classified into three groups, or enterotypes, based on the abundance of three genera: Bacteroides, which co-occurred with Parabacteroides; Prevotella, which co-occurred with Desulfovibrio; and Ruminococcus, which co-occurred with Akkermansia. Our TD co-occurrence networks are more complex than the networks described in this study, and we did not see similar co-occurrence of OTUs. We speculate that during the course of TD, resident microbes are displaced by the rapid influx of water and electrolytes. This displacement may require synergy of the remaining community of microbes to return the gut to its pre-disrupted state. Again, a longitudinal study that examines not only shifts in bacterial communities, but also addresses changes in nutrient utilization by assessing functional pathways are necessary to address this and our above mentioned hypotheses.
This study provides the first comprehensive analysis of the bacterial communities within the human gut associated with TD. The results from this study are important for future research in TD and travel medicine. Specifically, they will be important in the development of future studies that will determine how travel affects the gut microbiome and whether alterations lead to development of diarrhea and will provide a reference for comparison for future studies. Our results may also provide insight into better treatment regimens that may include reconstitution of specific members of the gut community.
Materials and Methods
Travelers diarrhea study population
Stool samples were obtained from previous TD studies and were used for bacterial community analysis. Samples were collected between 2005 and 2010 from adult males and non-pregnant females who had traveled from the United States to Central America or India and who either developed travelers’ diarrhea (n = 99), or remained diarrhea-free (healthy travelers, n = 12). At the destination sites, subjects lived with host families for five weeks. Exclusion criteria are listed in Table S1, but important to this work, subjects were excluded from the study if they showed signs of gastroenteritis, had taken antibiotics or antidiarrheal medication prior to study entry, or had a history of inflammatory bowel disease. Demographic data, such as age and gender, were not available due to de-identification and coding of samples prior to processing at Baylor College of Medicine. Informed consent was obtained from all study participants, and the Institutional Review Board at The University of Texas Health Science Center at Houston (UTHSC) approved the studies.
Stool sample collection and pathogen screening
For subjects suffering from TD, stool specimens were self-collected within 72 hours of the onset of acute illness, and samples were transported to study investigators within 30 minutes of collection. Samples were shipped to UTHSC within 24 hours of collection, where they were aliquoted and stored at −80°C. Twelve stool samples from healthy, diarrhea-free travelers were included as healthy controls (DuPont, personal communication).
Stool samples were screened for known diarrheal pathogens, as previously described.3,20-23 For this study, stool samples were grouped according to pathogen, or pathogens, identified: ETEC (n = 38), NoV (n = 7), NoV + a pathogenic strain of E. coli (ETEC, EAEC, or DAEC; n = 17) (NoV + Ec). No pathogen was identified in an additional 43 diarrheal samples (NPI). Available metadata associated with the samples are listed in Supplemental Tables 2A-E.
DNA extraction, bacterial 16S rRNA gene amplification, and 454 pyrosequencing
One aliquot of each frozen stool sample was thawed, and 500–800 μl of stool was transferred to a MO BIO PowerSoil DNA Extraction PowerBead Tube (MO BIO Laboratories, Inc., cat# 12888). Samples were incubated at 95°C for 10 minutes, then at 65°C for 10 minutes,30 followed by genomic DNA extraction using the MO BIO PowerSoil DNA Extraction Kit protocol (MO BIO Laboratories, Inc.), and DNA samples were stored at −20°C. Using the extracted DNA as a template, the 16S rRNA gene variable regions three through five (V3-V5) were amplified and sequenced following version 4.2.2 of the HMP Data Generation 16S 454 Protocol (http://www.hmpdacc.org/doc/16S_Sequencing_SOP_4.2.2.pdf).
16S rDNA sequence analysis
Sequences for this study were uploaded to the NCBI short read archive and are available under BioProject ID PRJNA276911. mothur version 1.31 was used for processing and analysis of 454 16S rDNA reads.31 The 454 standard operating procedure (http://www.mothur.org/wiki/454_SOP32) was followed with the modification of additionally removing sequences greater than 500 base pairs (bp) in length. Chimeras were detected using mothur's implementation of UCHIME33 and removed, and operational taxonomic units (OTUs) were generated based on 97% sequence identity. OTUs in each group were classified using mothur's implementation of the Ribosomal Database Project (Version 9).34 α-diversity was calculated using the Chao1 richness estimator35 and the Inverse Simpson Diversity Index.36 β-diversity was evaluated using the Yue and Clayton distance metric37 and visualized using non-metric multidimensional scaling. For network analysis, an undirected Poisson graphical model was applied to determine co-occurrence of OTUs. This model was applied to data that were first filtered to remove OTUs with a variance below 1/e, because these usually represent rare species that contribute to zero inflation in the data (Fig. S2).
Human microbiome project sequence data
16S rDNA reads from stool samples collected for the Human Microbiome Project (HMP) 16S rRNA Clinical Production Phase I July 2010 data freeze were downloaded from http://www.hmpdacc.org/HMR16S to use as an independent set of healthy controls. Samples were collected and processed at Baylor College of Medicine in Houston, Texas and at Washington University and St. Louis Hospital in St. Louis, Missouri.30 DNA was extracted and 16S rDNA sequencing was performed as described above. Reads corresponding to the 16S rDNA V3-V5 regions from 235 individuals24 were analyzed in parallel with the healthy traveler reads, as described above.
Statistics
Statistical analyses were performed using R and mothur's implementation of metastats.31,38 We performed Kruskal-Wallis Rank Sum, Wilcoxon Rank Sum, and analysis of molecular variance tests, as appropriate. The Benjamini-Yekutieli and Bonferroni p value adjustment methods were used to account for multiple comparisons. A p value ≤ 0.05 was considered significant.
Disclosure of Potential Conflicts of Interest
No potential conflicts of interest were disclosed.
Supplemental Material
Supplemental data for this article can be accessed on the publisher's website.
Disclaimer
The content is solely the responsibility of the authors and does not necessarily represent the official views of the National Institutes of Health.
Funding
SKH was supported by the National Institutes of Health Institute of Diabetes and Digestive and Kidney Diseases by award number R21DK099573. BPY was supported by the National Institutes of Health National Institute of Diabetes and Digestive and Kidney Diseases by award number F31DK094596 and by National Institute of General Medical Sciences by award number R25GM056929. WDW was supported by the National Institutes of Health National Cancer Institute by award 2T32CA096520. Contributions by FC are based upon work supported by the National Science Foundation Graduate Research Fellowship Program under Grant No. 0940902. The National Institutes of Health National Human Genome Research Institute award number U54HG003273 also funded parts of the study.
References
- 1. de la Cabada. Bauche J, Dupont HL. New developments in traveler's diarrhea. Gastroenterol Hepatol (N Y) 2011; 7:88-95; PMID:21475415 [PMC free article] [PubMed] [Google Scholar]
- 2. Harvey K, Esposito DH, Han P, Kozarsky P, Freedman DO, Plier DA, Sotir MJ. Surveillance for travel-related disease–GeoSentinel Surveillance System, United States, 1997–2011. MMWR Surveill Summ 2013; 62:1-23; PMID:23863769 [PubMed] [Google Scholar]
- 3. Jiang ZD, Lowe B, Verenkar MP, Ashley D, Steffen R, Tornieporth N, von Sonnenburg F, Waiyaki P, DuPont HL. Prevalence of enteric pathogens among international travelers with diarrhea acquired in Kenya (Mombasa), India (Goa), or Jamaica (Montego Bay). J Infect Dis 2002; 185:497-502; PMID:11865402; http://dx.doi.org/ 10.1086/338834 [DOI] [PubMed] [Google Scholar]
- 4. Brown JA, Riddle MS, Putnam SD, Schlett CD, Armstrong AW, Jones JJ, Tribble DR, Sanders JW. Outcomes of diarrhea management in operations Iraqi Freedom and Enduring Freedom. Travel Med Infect Dis 2009; 7:337-43; PMID:19945010; http://dx.doi.org/ 10.1016/j.tmaid.2009.09.001 [DOI] [PubMed] [Google Scholar]
- 5. Porter CK, El Mohammady H, Baqar S, Rockabrand DM, Putnam SD, Tribble DR, Riddle MS, Frenck RW, Rozmajzl P, Kilbane E, et al. Case series study of traveler's diarrhea in US military personnel at Incirlik Air Base, Turkey. Clin Vaccine Immunol 2008; 15:1884-7; PMID:18845833; http://dx.doi.org/ 10.1128/CVI.00163-08 [DOI] [PMC free article] [PubMed] [Google Scholar]
- 6. Hill DR, Beeching NJ. Travelers' diarrhea. Curr Opin Infect Dis 2010; 23:481-7; PMID:20683261; http://dx.doi.org/ 10.1097/QCO.0b013e32833dfca5 [DOI] [PubMed] [Google Scholar]
- 7. Kollaritsch H, Paulke-Korinek M, Wiedermann U. Traveler's diarrhea. Infect Dis Clin North Am 2012; 26:691-706; PMID:22963778; http://dx.doi.org/ 10.1016/j.idc.2012.06.002 [DOI] [PubMed] [Google Scholar]
- 8. Guarner F. Enteric flora in health and disease. Digestion 2006; 73 1:5-12; PMID:16498248; http://dx.doi.org/ 10.1159/000089775 [DOI] [PubMed] [Google Scholar]
- 9. Hooper LV, Midtvedt T, Gordon JI. How host-microbial interactions shape the nutrient environment of the mammalian intestine. Annu Rev Nutr 2002; 22:283-307; PMID:12055347; http://dx.doi.org/ 10.1146/annurev.nutr.22.011602.092259 [DOI] [PubMed] [Google Scholar]
- 10. Mazmanian SK, Liu CH, Tzianabos AO, Kasper DL. An immunomodulatory molecule of symbiotic bacteria directs maturation of the host immune system. Cell 2005; 122:107-18; PMID:16009137; http://dx.doi.org/ 10.1016/j.cell.2005.05.007 [DOI] [PubMed] [Google Scholar]
- 11. Ley RE, Turnbaugh PJ, Klein S, Gordon JI. Microbial ecology: human gut microbes associated with obesity. Nature 2006; 444:1022-3; PMID:17183309; http://dx.doi.org/ 10.1038/4441022a [DOI] [PubMed] [Google Scholar]
- 12. Turnbaugh PJ, Hamady M, Yatsunenko T, Cantarel BL, Duncan A, Ley RE, Sogin ML, Jones WJ, Roe BA, Affourtit JP, et al. A core gut microbiome in obese and lean twins. Nature 2009; 457:480-4; PMID:19043404; http://dx.doi.org/ 10.1038/nature07540 [DOI] [PMC free article] [PubMed] [Google Scholar]
- 13. Jeffery IB, O'Toole PW, Ohman L, Claesson MJ, Deane J, Quigley EM, Simren M. An irritable bowel syndrome subtype defined by species-specific alterations in faecal microbiota. Gut 2012; 61:997-1006; PMID:22180058; http://dx.doi.org/ 10.1136/gutjnl-2011-301501 [DOI] [PubMed] [Google Scholar]
- 14. Krogius-Kurikka L, Lyra A, Malinen E, Aarnikunnas J, Tuimala J, Paulin L, Makivuokko H, Kajander K, Palva A. Microbial community analysis reveals high level phylogenetic alterations in the overall gastrointestinal microbiota of diarrhoea-predominant irritable bowel syndrome sufferers. BMC Gastroenterol 2009; 9:95; PMID:20015409; http://dx.doi.org/ 10.1186/1471-230X-9-95 [DOI] [PMC free article] [PubMed] [Google Scholar]
- 15. Frank DN, St Amand AL, Feldman RA, Boedeker EC, Harpaz N, Pace NR. Molecular-phylogenetic characterization of microbial community imbalances in human inflammatory bowel diseases. Proc Natl Acad Sci USA 2007; 104:13780-5; PMID:17699621; http://dx.doi.org/ 10.1073/pnas.0706625104 [DOI] [PMC free article] [PubMed] [Google Scholar]
- 16. Chang JY, Antonopoulos DA, Kalra A, Tonelli A, Khalife WT, Schmidt TM, Young VB. Decreased diversity of the fecal microbiome in recurrent Clostridium difficile-associated diarrhea. J Infect Dis 2008; 197:435-8; PMID:18199029; http://dx.doi.org/ 10.1086/525047 [DOI] [PubMed] [Google Scholar]
- 17. Saulnier DM, Riehle K, Mistretta TA, Diaz MA, Mandal D, Raza S, Weidler EM, Qin X, Coarfa C, Milosavljevic A, et al. Gastrointestinal microbiome signatures of pediatric patients with irritable bowel syndrome. Gastroenterology 2011; 141:1782-91; PMID:21741921; http://dx.doi.org/ 10.1053/j.gastro.2011.06.072 [DOI] [PMC free article] [PubMed] [Google Scholar]
- 18. Nelson AM, Walk ST, Taube S, Taniuchi M, Houpt ER, Wobus CE, Young VB. Disruption of the human gut microbiota following Norovirus infection. PLoS One 2012; 7:e48224; PMID:23118957; http://dx.doi.org/ 10.1371/journal.pone.0048224 [DOI] [PMC free article] [PubMed] [Google Scholar]
- 19. Pop M, Walker AW, Paulson J, Lindsay B, Antonio M, Hossain MA, Oundo J, Tamboura B, Mai V, Astrovskaya I, et al. Diarrhea in young children from low-income countries leads to large-scale alterations in intestinal microbiota composition. Genome Biol 2014; 15:R76; PMID:24995464; http://dx.doi.org/ 10.1186/gb-2014-15-6-r76 [DOI] [PMC free article] [PubMed] [Google Scholar]
- 20. Ajami N, Koo H, Darkoh C, Atmar RL, Okhuysen PC, Jiang ZD, Flores J, Dupont HL. Characterization of norovirus-associated traveler's diarrhea. Clin Infect Dis 2010; 51:123-30; PMID:20540620; http://dx.doi.org/ 10.1086/653530 [DOI] [PMC free article] [PubMed] [Google Scholar]
- 21. Cerna JF, Nataro JP, Estrada-Garcia T. Multiplex PCR for detection of three plasmid-borne genes of enteroaggregative Escherichia coli strains. J Clin Microbiol 2003; 41:2138-40; PMID:12734261; http://dx.doi.org/ 10.1128/JCM.41.5.2138-2140.2003 [DOI] [PMC free article] [PubMed] [Google Scholar]
- 22. Youmans BP, Ajami NJ, Jiang ZD, Petrosino JF, DuPont HL, Highlander SK. Development and accuracy of quantitative real-time polymerase chain reaction assays for detection and quantification of enterotoxigenic Escherichia coli (ETEC) heat labile and heat stable toxin genes in travelers' diarrhea samples. Am J Trop Med Hyg 2014; 90:124-32; PMID:24189361; http://dx.doi.org/ 10.4269/ajtmh.13-0383 [DOI] [PMC free article] [PubMed] [Google Scholar]
- 23. Meraz IM, Jiang ZD, Ericsson CD, Bourgeois AL, Steffen R, Taylor DN, Hernandez N, DuPont HL. Enterotoxigenic Escherichia coli and diffusely adherent E. coli as likely causes of a proportion of pathogen-negative travelers' diarrhea–a PCR-based study. J Travel Med 2008; 15:412-8; PMID:19090795; http://dx.doi.org/ 10.1111/j.1708-8305.2008.00249.x [DOI] [PubMed] [Google Scholar]
- 24. Consortium H. Structure, function and diversity of the healthy human microbiome. Nature 2012; 486:207-14; PMID:22699609; http://dx.doi.org/ 10.1038/nature11234 [DOI] [PMC free article] [PubMed] [Google Scholar]
- 25. Stenderup J, Orskov I, Orskov F. Changes in serotype and resistance pattern of the intestinal Escherichia coli flora during travel. results from a trial of mecillinam as a prophylactic against travellers' diarrhoea. Scand J Infect Dis 1983; 15:367-73; PMID:6318304; http://dx.doi.org/ 10.3109/inf.1983.15.issue-4.07 [DOI] [PubMed] [Google Scholar]
- 26. Wood LV, Ferguson LE, Hogan P, Thurman D, Morgan DR, DuPont HL, Ericsson CD. Incidence of bacterial enteropathogens in foods from Mexico. Appl Environ Microbiol 1983; 46:328-32; PMID:6354085 [DOI] [PMC free article] [PubMed] [Google Scholar]
- 27. DuPont HL. Travelers' diarrhea: antimicrobial therapy and chemoprevention. Nat Clin Pract Gastroenterol Hepatol 2005; 2:191-8; PMID:16265184; http://dx.doi.org/ 10.1038/ncpgasthep0142 [DOI] [PubMed] [Google Scholar]
- 28. Wong JM, de Souza R, Kendall CW, Emam A, Jenkins DJ. Colonic health: fermentation and short chain fatty acids. J Clin Gastroenterol 2006; 40:235-43; PMID:16633129; http://dx.doi.org/ 10.1097/00004836-200603000-00015 [DOI] [PubMed] [Google Scholar]
- 29. Arumugam M, Raes J, Pelletier E, Le Paslier D, Yamada T, Mende DR, Fernandes GR, Tap J, Bruls T, Batto JM, et al. Enterotypes of the human gut microbiome. Nature 2011; 473:174-80; PMID:21508958; http://dx.doi.org/ 10.1038/nature09944 [DOI] [PMC free article] [PubMed] [Google Scholar]
- 30. Aagaard K, Petrosino J, Keitel W, Watson M, Katancik J, Garcia N, Patel S, Cutting M, Madden T, Hamilton H, et al. The human microbiome project strategy for comprehensive sampling of the human microbiome and why it matters. FASEB J 2013; 27:1012-22; PMID:23165986; http://dx.doi.org/ 10.1096/fj.12-220806 [DOI] [PMC free article] [PubMed] [Google Scholar]
- 31. Schloss PD, Westcott SL, Ryabin T, Hall JR, Hartmann M, Hollister EB, Lesniewski RA, Oakley BB, Parks DH, Robinson CJ, et al. Introducing mothur: open-source, platform-independent, community-supported software for describing and comparing microbial communities. Appl Environ Microbiol 2009; 75:7537-41; PMID:19801464; http://dx.doi.org/ 10.1128/AEM.01541-09 [DOI] [PMC free article] [PubMed] [Google Scholar]
- 32. Schloss PD, Gevers D, Westcott SL. Reducing the effects of PCR amplification and sequencing artifacts on 16S rRNA-based studies. PLoS One 2011; 6:e27310; PMID:22194782; http://dx.doi.org/ 10.1371/journal.pone.0027310 [DOI] [PMC free article] [PubMed] [Google Scholar]
- 33. Edgar RC, Haas BJ, Clemente JC, Quince C, Knight R. UCHIME improves sensitivity and speed of chimera detection. Bioinformatics 2011; 27:2194-200; PMID:21700674; http://dx.doi.org/ 10.1093/bioinformatics/btr381 [DOI] [PMC free article] [PubMed] [Google Scholar]
- 34. Wang Q, Garrity GM, Tiedje JM, Cole JR. Naive bayesian classifier for rapid assignment of rRNA sequences into the new bacterial taxonomy. Appl Environ Microbiol 2007; 73:5261-7; PMID:17586664; http://dx.doi.org/ 10.1128/AEM.00062-07 [DOI] [PMC free article] [PubMed] [Google Scholar]
- 35. Chao A. Non-parametric estimation of the number of classes in a population. Scand J Statist 1984; 11:265-70. [Google Scholar]
- 36. Magurran AE. Ecological diversity and its measurement. NJ Princeton: Princeton University Press, 1988 [Google Scholar]
- 37. Yue JC, Clayton MK, Lin FC. A nonparametric estimator of species overlap. Biometrics 2001; 57:743-9; PMID:11550923; http://dx.doi.org/ 10.1111/j.0006-341X.2001.00743.x [DOI] [PubMed] [Google Scholar]
- 38. Foster EK. METASTATS: behavioral science statistics for Microsoft Windows and the HP49G programmable calculator. Behav Res Methods Instrum Comput 2003; 35:325-8; PMID:12834092; http://dx.doi.org/ 10.3758/BF03202560 [DOI] [PubMed] [Google Scholar]
Associated Data
This section collects any data citations, data availability statements, or supplementary materials included in this article.