

Introduction
Urban American Indian (AI) communities are diverse, rapidly growing, and relatively under-examined in research. The proportion of AIs living on reservations or Native lands has declined from 62% in 1970 to 22% in 2010, while those living in urban areas are an increasing majority, 71% in 2010 (National Urban Indian Family Coalition [NUIFC], 2008; US Census Bureau, 2010). Although the AI population remains less concentrated than non-Natives in large metropolitan centers, in 2010 42% of those identifying only as AI lived in large cities of 750,000 or more (US Census Bureau, 2012). Starting in the late 19th century, American Indian migration into cities was promoted through the removal of American Indian children from Native lands to boarding schools and their training to fulfill domestic labor jobs in White society (Slivka, 2011). Migration was greatly accelerated in the last half century by Federal policies that relocated families and terminated tribal rights in the 1950s and 1960s (Burt, 1986). While pervasive poverty and limited educational, job training, and employment opportunities on reservations have sustained the momentum for urban migration, many American Indian families continue to struggle in cities to secure jobs, education, health care and social services. American Indians have the highest poverty rate of all racial/ethnic groups in the U.S. (27%), more than double the rate for non-Hispanic Whites (Macartney, Bishaw, & Fontenot, 2013). In urban areas, poverty rates are also much higher for American Indians than for the general population, reaching over 25% in metropolitan areas with large numbers of American Indians—Chicago, Denver, Houston, New York, Phoenix, Oklahoma City, and Tucson.
There is relatively little empirical research on the cultural identities of urban AI youth, even as more AI families have lived for multiple generations in the city. Although their communities are quite diverse—differing by region, migration history and tribal backgrounds—urban AIs face similar social and cultural challenges that may be attributed to colonization and historical trauma. Compared to non-Natives, urban AIs have markedly higher rates of lacking a high school degree; of unemployment, inadequate housing, and homelessness; of infant mortality, accidental death, diabetes, and substance use-related illnesses and mortality; and of child abuse and neglect (NUIFC, 2008). A major resource for promoting wellbeing, however, is that urban AIs are able to sustain their cultures and identities by maintaining deep connections to reservation homelands or tribal communities, (Clifford, 2007). Research on identity formation of urban AI youth is needed to understand their distinctive identity processes and the role of indigenous identity in promoting the health and wellbeing of urban AIs.
This study reports the ways that urban AI youth in a large Southwestern metropolis reported their family ethnic backgrounds, cultural orientations, and connections to their indigenous heritage. Following Markstrom's (2011) model of indigenous identity, the study utilized latent class analysis to determine how identity-related variables clustered in subgroups with distinctive patterns, and examined how the strength and nature of AI ethnic identity varied across these subgroups.
American Indian Identity
We employ a definition of cultural identity used in other studies of AI youth populations: the development and adoption of a sense of self that is integrally connected to American Indian communities and cultures (Oetting & Beauvais, 1991; Whitesell, Mitchell, Spicer, & Voices of Indian Teens Project team, 2009). Many explorations of AI identity have focused on the related concepts of enculturation—participation in and identification with traditional culture (Zimmerman, Ramirez, Washienko, Walter, & Dyer, 1994), and bicultural competence—the ability to function effectively in two cultures while maintaining cultural identity (LaFromboise, Albright, & Harris, 2010; Oetting & Beauvais, 1991). Much of the research on biculturalism for AI populations is in line conceptually with Berry's (2003, 2007) model of acculturation as a process of multidirectional cultural transformation that results from intercultural contact. Berry's acculturation typology includes four quadrants representing those who adopt only their origin culture (separatist), the host culture alone (acculturated), both cultures (bicultural), or neither culture (marginalized). Although Berry's typology has been developed and applied to address acculturation processes for international immigrants arriving in new cultures, it is also the template for measures of bicultural orientations developed specifically for American Indians (Moran et al., 1999; Oetting & Beauvais, 1991). Models of indigenous identity for youth emphasize how enculturation and bicultural competence are not mutually exclusive, but rather closely intertwined (Markstrom, 2011; Walters, 1999).
Previous findings indicate that a strong connection to and understanding of one's tribal traditions is associated with better educational outcomes (Whitbeck, Hoyt, Stubben, & LaFromboise , 2001; Whitbeck, Walls & Hartshorn, 2014), decreased risk of suicide (Lester, 1999), less susceptibility to substance abuse, and improved treatment for it (Brady, 1995; Gray & Nye, 2001; Herman-Stahl, Spencer, & Duncan, 2003; May & Moran, 1995; Moncher, Holden, & Trimble, 1997; Spicer, Novins, Mitchell, & Beals, 2003; Stubben, 2001; Whitbeck, Hoyt, McMorris et al., 2001; Zimmerman et al., 1994). Further, enculturation may buffer the negative effects of historical trauma and experiences of discrimination on health and mental health in AI women (Walters, Simoni & Evans-Campbell, 2002). Even when it is not directly associated with AI substance use, AI cultural identity is related to social support and protective family and peer influences, which in turn, can protect AI youth from risky and dangerous behaviors (Baldwin, Brown, Wayment, Nez & Brelsford, 2011).
Although some studies suggest that enculturation may not universally function as a protective mechanism (DeCoteau, Hope, & Anderson, 2003; LaFromboise, Medoff, Lee & Harris, 2007), a larger body of research suggests that enculturation is a mechanism for coping with acculturative stress (LaFromboise, Hoyt, Oliver, & Whitbeck, 2006; Sunday, Eyles, & Upshur, 2001; Zimmerman, Ramirez-Valles, Washienko, Walter, & Dyer, 1996), facilitating healing (Iwasakia, Bartlett, & O’Neil, 2005), and discovering meaning in life (McCormick, 2000). A number of studies suggest that bicultural competence encourages healthy coping strategies and positive mental health outcomes (Bankston & Zhou, 1997; Berry, 1997; Berry, Phinney, Sam & Vedder, 2006; Phinney et al., 2002; Suinn, Rickard-Figueroa, Lew, & Vigil, 1987; Garrett & Carroll, 2000; Whitbeck, Hoyt, McMorris et al., 2001; LaFromboise et al., 2010). Because it enhances the ability to navigate both the dominant and heritage cultures, bicultural competence is related to better personal adjustment (LaFromboise, Coleman & Gerton, 1993), social support networks from both cultures (Mok, Morris, Benet-Martínez & Karakitapoglu-Aygun, 2007), and greater integrative complexity, intellectual flexibility, and creativity (Benet-Martínez, Lee, & Leu, 2006; Tadmor, Tetlock, & Peng, 2009). However, some findings suggest this is not always the case and negotiating two cultures may lead to stress, isolation, and identity confusion (Rudmin, 2003; Vivero & Jenkins, 1999). The disparate findings may reflect the indirect nature of any benefits of enculturation and bicultural competence. These processes are spurred by cultural change and cultural stressors that present challenges to wellbeing, but those who navigate the stressors most effectively may have other protective factors to draw upon.
Urban American Indian Youth Identity
Despite the unique challenges that urban AI adolescents face in negotiating issues of cultural identity development (Trimble, 2000; Weaver & Brave Heart, 1999), few studies have investigated their identity processes. The sheer diversity of the AI population in large urban areas is one challenge. Urban AI youth are likely to differ in tribal backgrounds, family histories of reservation life, and inter-marriage across tribes and non-native ethnic groups (Moran et al., 1999). Although these differences increase the complexity, variability and diffuseness of urban AI identities, they also provide opportunities to recognize common values across the differences that can help them sustain their cultural heritage (Reeves, Dustman, Harthun, Kulis, & Brown, 2014). Urban AI youth may have similar family legacies of migration, navigate the same cultural conflicts and acculturation related stresses, and face frequent encounters with discrimination from non-natives. Their relatively small proportional representation in urban neighborhoods and schools can promote heterogeneous AI social networks that span tribal lines, and the sharing of cultures.
American Indian youth are typically socialized into the values and norms of at least two different cultures, often not in agreement (LaFramboise et al., 2010). For example, many are actively seeking to maintain tribal values which include frequent visits to their tribal homelands for family matters and ceremonies. During this bidirectional process they select characteristics of tribal life to retain, characteristics of mainstream culture to adopt, and ways to combine them (LaFromboise et al., 2010) which may heighten struggles between AI intertribal, traditional values and those of the dominant culture (Stubben, 2001). The urban nexus for AI identify is bound up with their complex relationships to kin and to other urban AIs who connect with one another mainly through organizations run by or serving AIs and contact at AI cultural events (Ramirez, 2001). Despite cultural differences among urban AI youth who come from various tribal backgrounds and reservation communities, they share a common sense of “Indianness.” “Pan-Indian” or “pan-traditional” concepts that bridge tribal boundaries and unite people around larger regional or national identities have been the foundation for prevention programs that serve people of diverse tribal backgrounds (Garrett & Carroll, 2000). However, the degree to which urban AI youth identify as “pan-Indian” is unclear, and there are suggestions that identities framed around “pan-Indian” concepts may lessen the strength of identification with American Indian ethnic heritage (Leibler, 2004).
Some conceptual approaches to understanding urban AI youth identities have viewed pan-Indian identity as a developmental stage on the way toward a more tribally-specific identity. Walters’ (1995) stage model of Urban American Indian Identity (UAII) model delineated multiple cognitive and affective dimensions including self-identity, group identity, urban context, and the historical relationship of the individual with the dominant culture. In this model, an integrated urban AI emerges through attitude shifts in awareness of one's heritage and incorporation of tribal values, language, knowledge, and spirituality (Walters, 1999).
A recent conceptual model by Markstrom (2011) addresses identity formation of AI adolescents as operating at three levels - local, national, and global. Although the current study lacks measures to address the global level, the local and national levels of this conceptual model provide a broad framework for the analysis. The local level of identity, which is used interchangeably with ethnic or cultural identity, includes three components–identification, connection and culture/spirituality–each part with sub-dimensions. The first component focuses on identification with a clan or tribe, perceiving the self as AI, and AI blood quantum. The second component maps a sense of connection to kinship, genealogy/ancestors, and land/place. The culture/spirituality component contains language, history/origin stories, world view/values and beliefs/practices.
Markstron's local level of American Indian youth identity parallels core elements of Phinney's (1992) concept of ethnic identity formation, a key developmental task through which adolescents come to understand their ethnic background and heritage, understand what it means, and locate themselves as a member of the ethnic group. Phinney viewed ethnic identity as a process that emerges from exploring the meaning of ethnic group membership, participating in ethnic group cultural events and activities, and learning about family ancestry. Through this process youth also develop attachment, affinity, and stable commitment to the group (Umaña-Taylor & Alfaro, 2006).
Markstrom's three components of local identity have repeatedly emerged in the literature as core aspects of identity that can enhance individual wellbeing and operate as protective factors for various AI groups. Several studies have found that a strong connection to tribal culture, traditions, and/or spirituality is linked to a decreased likelihood of substance abuse (Baldwin et al., 2011; Walters et al., 2002;), fewer depressive symptoms (Gray, Mays, Wolf & Jirsak, 2010; Whitbeck, McMorris, Hoyt, Stubben, & LaFromboise, 2002), and successful transition out of foster care (Long, Downs, Gilette, Kills In Sight & Konen, 2006). Programs and assessment approaches for AI populations that integrate culturally relevant ways of healing have a positive impact on self-esteem, HIV prevention, and substance abuse (Baldwin et al., 2011; Duran et al., 2010; Gone, 2009; Hodge & Limb, 2009).
In addition to the local level of identity, Markstrom (2011) addresses the impact of non-indigenous cultural influences operating at the national historical level. This layer recognizes the pervasive influence of colonial oppression, historical trauma, and pressures on AI youth to develop bicultural, multicultural or hybrid identities, which increasingly can be assembled from an array of ethnic and socioeconomic subcultures that indigenous youth access through expanding technologies. The current study incorporates the national level of the Markstrom model by assessing bicultural orientations. Because of a lack of direct measures, the study does not address Markstrom's global level of identity, which encompasses the development of awareness and affinity for other indigenous movements across the globe, and a heightened sense of American Indian identity rooted in a recognition of common struggles and commitments to sustain indigenous cultures.
The Markstrom model emphasizes the complex composition of AI youth identities in multiple layers and shifting contexts. For some, a sub-tribal identity such as clan affiliation is primary. For others, identification with a tribe or region may take precedence. Still others adopt a broader identity as Native or indigenous people. Different layers of identity are likely to be presented according to the context: “Thus, an American Indian might be a ‘mixed-blood’ on the reservation, from ‘Pine Ridge’ when speaking to someone from another reservation, an ‘Oglala Sioux’ or ‘Lakota’ when asked about tribal affiliation, or an ‘American Indian’ when interacting with non-Indians” (Nagel, 1996).
The Current Study
This study had two objectives. The first was to determine how identity-related variables clustered in distinctive ways for subgroups of the youth, using latent class analysis of measures of parental heritage, association with AI friends, reservation connections, affinity for AI culture and mainstream culture, tribal language, and native spirituality. Considering the multicultural influences and identity challenges confronting urban Indian communities, we expected urban AI youth to be differentially aligned with various components in the Markstrom model of local and national identity. In childhood and adolescence certain components of the Markstrom model are determined by the parents of the adolescents to significant degrees, such as connections to tribal heritage and contacts with reservation communities. Adolescents have more flexibility to explore and incorporate the other components of the model, such the adoption of AI culture, spirituality, and bicultural orientations.
The second study objective was to examine how the strength and nature of AI ethnic identity varied across these subgroups, or latent classes. These associations were explored by testing for differences across the latent classes in the overall strength of ethnic identity and in open-ended descriptions of the key elements contributing to one's AI identity. Variables from all the components of the Markstrom local and national identity model were expected to be salient predictors of the strength of indigenous ethnic identity and the likelihood of affirming an AI only rather than hybrid ethnic identity. Open-ended identity descriptors were explored to aid in interpreting the latent classes.
Because of its dynamic, evolving, and complex nature, adolescent identity development is impossible to fully capture in a cross sectional analysis. Thus the purpose of this study is not to categorize the adolescents, reify distinct cultural identity subgroups, or delineate stages of identity development. Instead, the study aims to shed light on the complexity of heritage and the choices for constructing indigenous identities in urban settings.
Methods
The study site is one of the three metropolitan areas in the United States with the largest urban AI communities, those with over 90,000 residents identifying only as American Indian or Alaska Native (U.S. Bureau of the Census, 2012). AI families in the study area come from all over the US, but most trace connections to federally recognized tribes in the surrounding state.
Data for the current study were drawn from a study to culturally adapt and test a prevention program designed specifically for urban AI youth (see Kulis, Dustman, Brown, & Martinez , 2013, for details). A total of 208 youth from five public middle schools completed pretest questionnaires in fall of 2008, 2009 or 2010, immediately before the prevention curriculum began. The students were all enrolled in voluntary academic enrichment classes for AI youth only, held during regular school hours and led by an AI teacher. AI students comprised between 5 and 11 percent of all students enrolled at the five schools.
The study followed policies for protecting human subjects of the researchers’ university IRB, of the students’ schools and school districts, and of the urban Indian center sponsoring the academic enrichment program. Every AI student in the academic enrichment programs within the study schools was invited to participate in the study. Active parental consent and student assent were obtained in a non-coercive manner: students with parental consent were given the option to discretely return an unsigned assent form and blank questionnaire if they chose not to participate. AI graduate students from the research team served as survey proctors during administration of the one-hour written questionnaire. Students were informed the survey was part of a university research project, participation was voluntary, and answers were confidential. The rate of participation was high: 95% of all students enrolled in the academic enrichment programs completed the pretest questionnaire.
The sample was nearly gender balanced (52% female, 48% male), between the ages of 11 and 15 (mean=12.5), and most students were in 7th or 8th grade. Most (54%) lived with both parents, 37% lived with one parent, and 9% with neither parent (typically living with grandparents). Most respondents came from low income homes: 81% received a free or reduced price lunch through the federal school lunch program.
Identity Measures
The questionnaire included measures of the three components of Markstrom's model of local identity (Table 1). Measures reflecting the “identification” component included tribal background, strength of American Indian ethnic identity, and ethnic self-categorization (as American Indian only or mixed ethnic identities). The “connection” component was measured through parental ethnic heritage, ties to a reservation or tribal community, and, in the urban area, through associations with AIs as best friends. Measures of the “cultural/spiritual” component included involvement in AI cultural practices, tribal language, and AI spirituality. The Markstrom national level of identity was assessed with measures of bicultural orientations (toward AI culture and the “White way”).
Table 1. Distributions for Identity Variables in the Latent Class Analysis.
| Dichotomous | No | Yes | Range | |||
|---|---|---|---|---|---|---|
| Mother American Indian only | 34 (18%) | 158 (82%) | 0-1 | |||
| Father American Indian only | 65 (34%) | 129 (66%) | 0-1 | |||
| Respondent American Indian only | 107 (52%) | 97 (48%) | 0-1 | |||
| Best Friend American Indian | 106 (55%) | 85 (45%) | 0-1 | |||
| Ever Lived on Reservation | 64 (35%) | 120 (65%) | 0-1 | |||
| Categorical | Low | Medium | High | Range* | Mean* | SD* |
| Visits Reservation | 81 (39%) | 73 (35%) | 52 (25%) | 1-7 | 4.42 | 1.77 |
| AI Cultural Traditions | 54 (29%) | 65 (35%) | 65 (35%) | 0-10 | 5.73 | 3.20 |
| Tribal Language | 75 (38%) | 83 (42%) | 42 (21%) | 1-4 | 2.14 | 0.80 |
| Spirituality | 66 (35%) | 68 (36%) | 53 (28%) | 1-4 | 2.72 | 0.79 |
| Lives the “Indian Way” | 78 (42%) | 58 (31%) | 51 (27%) | 1-4 | 2.96 | 0.75 |
| Lives the “White Way” | 48 (26%) | 81 (44%) | 54 (30%) | 1-4 | 1.95 | 0.84 |
Descriptive statistics for scales prior to trichotomizing them for the latent class analysis.
Tribal Background
Respondents used a checklist to indicate the AI tribe(s) to which they belonged. Nearly all (98%) students said they belonged to an AI tribe or reservation community. Eighteen different tribal affiliations were listed, and 95% of these were affiliations with one of over 20 tribal communities in the surrounding state. Because virtually all students claimed a tribal heritage and the tribes mentioned were numerous and diverse, specific tribal affiliation was not included in the latent class analysis.
Ethnic Self-Categorization
To assess the adoption of multi-ethnic or blended identities, a single item asked if students considered themselves “American Indian only,” “an equal member” of multiple ethnic or racial groups, “more American Indian” than other ethnicities, “more a member of (another ethnic/racial) group than American Indian,” or not “a part of any of these groups.” This item was dichotomized (AI only versus other responses) in the latent class analysis.
Strength of American Indian Ethnic Identity
The overall strength of AI identity was measured with modified items from Phinney's (1992) Multigroup Ethnic Identity Measure [MEIM], adapting the 11 original scale items to refer specifically to American Indian identity. Sample items include: “I have often talked to other people, like my parents, to learn more about my American Indian background;” “I have a clear sense of my American Indian background and what it means to me;” “I think about how my life will be affected because I am American Indian;” “I feel like I really belong to an American Indian community;” “I am involved in American Indian customs, such as food, music or celebrations;” and “I feel good about my American Indian background.” Responses to the items (strongly disagree, disagree, agree, strongly agree, coded 1 to 4) combined into a highly reliable mean scale (α = 0.90).
Ethnic Heritage
Students indicated the ethnicity that “best” described their mothers and fathers (AI, African American, Asian or Pacific Islander, Mexican American or Chicano, Hispanic or Latino, White, Other, mixed AI and non-AI). These responses were dichotomized into the large majority that described each parent as AI only versus all others responses.
Reservation Connections
Students indicated whether they had had ever lived on a reservation (dichotomy), and how often they visited a reservation (daily, weekly, monthly, several times yearly, once a year, less often, never).
American Indian Friends
Students indicated the ethnicity that “best” described their best friend, using the same categories employed to describe the parents’ ethnicity, which were dichotomized into best friends who were AI only versus some other ethnicity.
Cultural Traditions and Practices
Questionnaire items reflecting involvement in AI cultural practices encompassed 10 ceremonies or traditions common in southwest AI communities: memorials/feasts, powwows/dances, giveaways, healing ceremonies, sweats, naming ceremonies, talking circles, spiritual running, drumming groups, sacred tobacco use. The items were combined as a count of how many different practices the respondent had participated in.
Tribal Language
Respondents reported how often an AI tribal language was spoken in their home (rarely, sometimes, often, almost always), and the extent to which they understand their tribal language, and speak it (not at all, a little, some, a lot’). These three items were combined into a mean scale (α = 0.75).
Spirituality
Respondents were asked, “How involved are you in private American Indian spiritual activities?”, “How important is being spiritual to you?”, “Are spiritual values a part of your life?”, and “How important is it for you to follow traditional American Indian beliefs?” These items were combined into a mean scale (α = 0.80).
Cultural Orientations
The Bicultural Ethnic Identity Scale [BEIS], developed for AIs, was employed to assess cultural orientations on two subscales, following the “American Indian way of life” and following the “White or Anglo way of life” (Moran, et al., 1999). The six items in the first subscale ask: “Do you live by or follow the American Indian way of life [AIWOL];” “When you are an adult, how involved do you think you will be in the AIWOL;” When you are an adult, will you be a success in the AIWOL;” Does your family live by or follow the AIWOL;” “Is your family a success in the AIWOL;” and “In your family, how many special activities or traditions (such as holiday parties, special meals, religious activities, trips, or visits) are based on the AIWOL.” Six parallel items for the second subscale have identical stems but conclude with “…the White or Anglo way of life.” Responses from the six component items (not at all=1, a little=2, some=3, a lot=4) were combined to produce reliable mean scales for American Indian Way of Life (α = 0.89) and White/Anglo Way of Life (α = 0.95).
Open-ended Identity Descriptors
Before the questions described above, students were asked to “List 3 things about yourself that make you an American Indian.” Most students (85%) filled in at least one short description, 72% listed two, and 60% listed three. A qualitative analysis of the 450 descriptions in all was conducted independently from the latent class analysis by three Native coders (Mihesuah, 1998), producing twelve categories (see Table 5).
Table 5. Proportion Mentioning Open-ended Identity Descriptors (1st, 2nd or 3rd), by Latent Classes.
| Class 1 | Class 2 | Class 3 | Class 4 | Class 5 | ||
|---|---|---|---|---|---|---|
| Mixed Heritage, Acculturated | Moderate Heritage, Low Enculturation | Strong Heritage & Enculturation | Strong Heritage, Culturally Disengaged | Moderate Heritage, Bicultural | All Classes | |
| Tribe | .143 | .333† | .220 | .188 | .134 | .192 |
| Clan | .000 | .048 | .102 | .188* | .015 | .062 |
| Blood | .143* | .000 | .051 | .000 | .030 | .040 |
| Family | .571 | .333 | .271* | .313 | .463 | .379 |
| Ancestry | .143 | .095 | .034 | .000 | .090 | .068 |
| Reservation/Land | .071† | .238 | .186 | .250 | .209 | .198 |
| Tribal Language | .071 | .048 | .356* | .125 | .194 | .215 |
| Sacred Traditions | .000 | .048 | .136 | .000 | .224** | .136 |
| AI Customs | .214 | .381 | .407 | .250 | .358 | .356 |
| Physical Trait | .214 | .286 | .186 | .188 | .209 | .209 |
| Self-identity Claim | .286† | .095 | .153 | .125 | .075 | .124 |
| Other | .071 | .190** | .034 | .063 | .045 | .062 |
| N1 | 14 | 21 | 59 | 16 | 67 | 177 |
Proportion significantly different than other classes at
p < .01;
p < .05; at
p < .10.
Number of students in the latent class who volunteered at least one open-ended identity description, which was the denominator for proportions in each column.
Analysis
Exploratory correlational and factor analyses and data reduction techniques were used to assess scale reliability and produce summary scales. Continuous scales were trichotomized to facilitate statistical estimation and interpretations in the latent class analysis according to two criteria: to produce roughly equal numbers of cases in the low, medium and high categories but also designating substantively meaningful cutpoints, such as a threshold for the high category that corresponded to responses such as “strongly agree” or “a lot.”
Latent class analysis (LCA) in Mplus 5.2 (Muthén & Muthén, 2008) was employed to identify clusters of individuals with similar patterns of alignment on the identity measures. LCA focuses on a person-centered analysis in contrast to variable based approaches such as factor analysis that group items (Reinke, Herman, Petras, & Ialongo, 2008). LCA determines the optimal number of classes through multiple fit statistics and significance tests. Missing data were handled in Mplus using full information likelihood (FIML) estimation. After determining the optimal number of latent classes to describe distributions across the identity measures, the classes were interpreted and tentatively labeled. Finally, after assigning a single class membership to each respondent, ANOVA, t-tests, and crosstabular Chi-square tests assessed whether there was significant variation across latent classes on measures of the strength of AI ethnic identity, open-ended descriptions of the key sources of AI identities, demographic characteristics, and indicators of academic performance, wellbeing and risk behaviors. The sources for these measures are indicated as they are discussed in the results section.
Qualitative data analysis of the open-ended identity descriptors identified emergent themes rather than a priori categories (Corbin & Straus, 2008). After transcribing and compiling responses, three AI research team members worked independently to identify themes, grouping similar responses to reach saturation (Guest, Bunce, & Johnson, 2006). They then labeled and defined thematic categories based on team consensus and then independently re-assigned each response into these categories. Intercoder reliability was ensured by comparing and adjusting coding decisions to resolve any discrepancies (Kulis, Reeves, Dustman, & O’Neill, 2011).
Results
Table 1 provides distributions and descriptive statistics on the closed-ended identity-related variables. A large majority (82%) of the students described their mothers’ heritage as AI only, and about two-thirds (66%) described their fathers as AI only. Only about half (48%) described themselves as AI only, and less than half (45%) had best friends that were AI. Most (65%) students had lived at some point on a reservation. The means for ordinal or scale variables, prior to trichotomizing them, indicated that a typical student: visited an AI reservation monthly or several times a year; participated in about 6 of 10 AI cultural traditions, heard or spoke their tribal language “a little;” were “somewhat” spiritual; followed the “Indian way of life” to “some” degree but the “White or Anglo way of life” only “a little.”
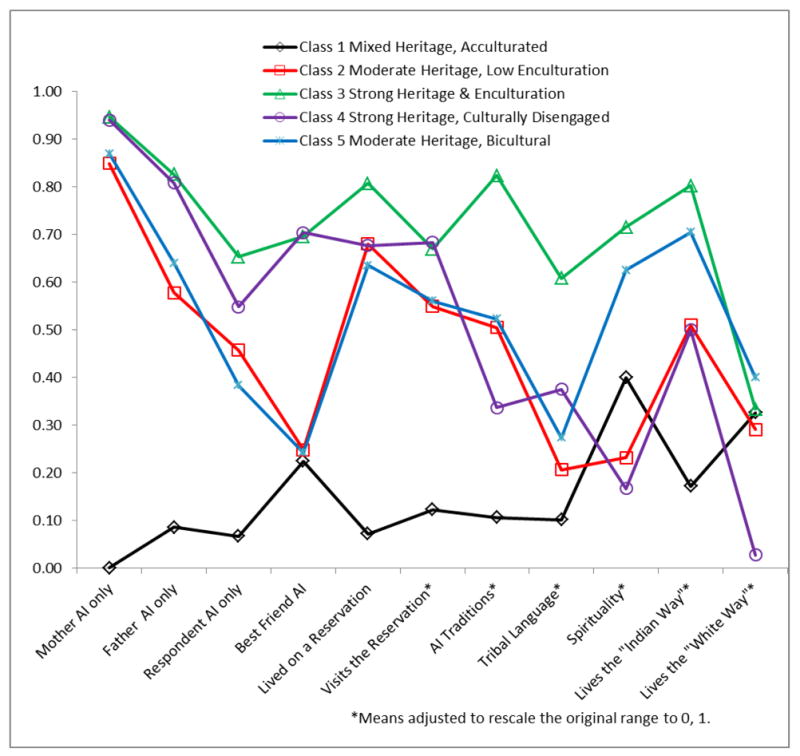
This study relied on recommended statistical criteria and on theoretical results to determine the best latent class model to describe the identity variables (Table 2). The adjusted Bayesian Information Criterion (BIC) accounts for sample size effects, relative entropy identifies which model classifies individuals most precisely, and the Lo-Mendell-Rubin test indicates whether an additional class is necessary (Jefferies, 2003; Nylund, Asparouhov, & Muthen, 2007). Table 2 demonstrates that the 4 and 5 class models have the lowest adjusted BIC, with a non-significant difference of less of 10 between them (Kass & Raftery, 1995), and their relative entropy values close to 1 show that both classes adequately classify cases (Reinke, Herman, Petras & Ialongo, 2008). Since the 4 and 5 class solutions have similar results with the adjusted BIC and relative entropy, theoretically interpretable results were the deciding factor in choosing the 5 class model as an appropriate description of the data. For each of the five latent classes determined by the LCA, Table 3 presents the probabilities of observing yes or no values for dichotomous identity indicators, and low, medium or high values on other indicators. The different patterns of identity of the five latent classes are illustrated in Figure 1, which reports the proportion responding yes to the dichotomous identity measures, and means for the remaining identity measures after converting their ranges to 0 and 1. Scales for tribal language, Native spirituality, living the “Indian way”, and living the “White way” were originally scored from 1 to 4, and were transformed by subtracting 1 and dividing by 3. Class 3 and class 5 were the largest, each accounting for just over a third of the respondents. The remaining three classes were similar in size, each accounting for about one-tenth of the respondents.
Table 2. Model Fit Statistics for 1-5 Latent Classes.
| 1 class | 2 classes | 3 classes | 4 classes | 5 classes | |
|---|---|---|---|---|---|
| AIC | 3722.034 | 3554.534 | 3517.422 | 3495.509 | 3491.501 |
| BIC | 3778.772 | 3670.348 | 3694.312 | 3732.474 | 3788.542 |
| Adjusted BIC | 3724.908 | 3560.451 | 3526.382 | 3507.512 | 3506.547 |
| Entropy | N/A | 0.729 | 0.820 | 0.846 | 0.830 |
| Lo, Mendell, Rubin Test | N/A | <.001 | 0.046 | 0.759 | 1.00 |
| N for each class | class 1: 208 | class 1: 110 class 2: 98 |
class 1: 79 class 2: 18 class 3: 111 |
class 1: 19 class 2: 77 class 3: 93 class 4: 19 |
class 1: 19 class 2: 24 class 3: 74 class 4: 20 class 5: 71 |
Note. Bold values indicate best fit: lowest BIC and adjusted BIC and entropy closest to 1.
Table 3. Latent Class Probabilities.
| Class 1 | Class 2 | Class 3 | Class 4 | Class 5 | ||
|---|---|---|---|---|---|---|
| Mother is | No | 1.00 | 0.15 | 0.05 | 0.06 | 0.13 |
| American Indian Only | Yes | 0.00 | 0.85 | 0.95 | 0.94 | 0.87 |
| Father is | No | 0.91 | 0.42 | 0.17 | 0.19 | 0.36 |
| American Indian Only | Yes | 0.09 | 0.58 | 0.83 | 0.81 | 0.64 |
| Respondent is | No | 0.93 | 0.54 | 0.35 | 0.45 | 0.62 |
| American Indian Only | Yes | 0.07 | 0.46 | 0.65 | 0.55 | 0.38 |
| Best Friend is | No | 0.78 | 0.76 | 0.30 | 0.30 | 0.76 |
| American Indian | Yes | 0.22 | 0.25 | 0.70 | 0.70 | 0.24 |
| Lived on Reservation | Yes | 0.93 | 0.32 | 0.19 | 0.32 | 0.37 |
| No | 0.07 | 0.68 | 0.81 | 0.68 | 0.64 | |
| Visits to Reservation | Low | 0.85 | 0.53 | 0.23 | 0.30 | 0.43 |
| Medium | 0.15 | 0.43 | 0.24 | 0.46 | 0.46 | |
| High | 0.00 | 0.03 | 0.53 | 0.25 | 0.11 | |
| AI Traditions | Low | 0.93 | 0.00 | 0.00 | 0.79 | 0.37 |
| Medium | 0.07 | 1.00 | 0.36 | 0.00 | 0.34 | |
| High | 0.00 | 0.00 | 0.64 | 0.21 | 0.30 | |
| Tribal Language | Low | 0.93 | 0.74 | 0.02 | 0.50 | 0.45 |
| Medium | 0.00 | 0.26 | 0.52 | 0.11 | 0.55 | |
| High | 0.07 | 0.00 | 0.46 | 0.40 | 0.00 | |
| Spirituality | Low | 0.54 | 1.00 | 0.04 | 1.00 | 0.24 |
| Medium | 0.25 | 0.00 | 0.53 | 0.00 | 0.44 | |
| High | 0.21 | 0.00 | 0.44 | 0.00 | 0.32 | |
| Lives the “Indian Way” | Low | 1.00 | 0.86 | 0.10 | 0.80 | 0.36 |
| Medium | 0.00 | 0.14 | 0.41 | 0.11 | 0.38 | |
| High | 0.00 | 0.00 | 0.48 | 0.10 | 0.25 | |
| Lives the “White Way” | Low | 0.26 | 0.00 | 0.19 | 0.87 | 0.22 |
| Medium | 0.43 | 0.89 | 0.49 | 0.13 | 0.36 | |
| High | 0.31 | 0.11 | 0.32 | 0.00 | 0.41 |
Figure 1. Proportion Responding Yes on Dichotomous Variables or Adjusted Means* for Scale Variables, by Latent Classes.
Class 1
Students in the first class are distinctive in having mixed AI and non-AI parental heritage and self-identity, non-AI best friends, little connection to reservations, the least engagement with AI cultural traditions, language, spirituality, and way of life, and greater adherence to the “White way” than to the “Indian way of life.” It might be described briefly as an acculturated mixed heritage class. Very few students in the class (under .10) describe the heritage of their mother, father, and self as AI only. They seldom have AI best friends (.22). Large majorities in this class have never lived on a reservation (.93), visit a reservation infrequently (.85), and report low levels of experience with AI cultural traditions (.93), tribal language (.93), and following the “Indian way” (1.0). More than half (.54) report low spiritual involvement. This class is the most variable in following the “White way,” and the only class where the scale mean for the living the “White Way” is higher than for the “Indian Way.”
Class 2
Students in this class are moderately strong in AI heritage but low in connection and enculturation. Although most have AI only mothers (.85), fewer describe their father (.58) or themselves (.46) as AI only. Only a quarter have an AI best friend. Although three-fourths (.68) have lived on a reservation, few (.03) visit a reservation frequently. Although participating at medium levels in AI cultural traditions (1.0), they cluster in the low range on three other AI cultural indicators—tribal language (.74), spirituality (1.00), and living the “Indian way” (.86). Most follow the “White way” at medium levels (.89).
Class 3
Class three has a distinctive alignment of strong AI heritage, connection and enculturation: an AI-only parental heritage and self-identity, strong links to reservations and AI best friends, and the highest levels of engagement with AI culture and spirituality. It is the class most likely to describe their mother (.95), father (.83), and self (.65) as AI only. Most of their best friends (.70) are AI. They have the strongest reservations connections, with a large majority (.81) having lived on a reservation and over half (.53) visiting a reservation frequently. They are the class most engaged at high levels with AI cultural traditions (.64), tribal language (.46), spirituality (.44) and following the “Indian way” (.48), and very few are at low levels on these AI cultural indicators. Notably, about half (.49) report following the “White way” at medium levels.
Class 4
Class four might be described as strong in AI heritage but culturally disengaged. It is similar to class three on indicators of AI heritage, self-identity, AI best friends and reservation living, but lower on current reservation visits and the engagement with AI spirituality and the “Indian way” of living, while also not following the “White way.” This class is highly likely to have an AI only mother (.94), AI only father (.81), and AI best friend (.70), and most self-describe as AI only (.55). About two-thirds (.68) have lived on a reservation, but visit typically with medium (.46) frequency. Most report low involvement with AI cultural traditions (.79), spirituality (1.00) and living the “Indian way” (.80), and half (.50) report low engagement with tribal language. This class is the least likely to follow the “White way,” with a large majority reporting low adherence (.87).
Class 5
Class five might be considered a biculturally oriented class with moderately strong AI heritage and connection. Most students have AI-only mothers (.87) and fathers (.64) but only slightly more than a third (.38) consider themselves to have AI-only heritage and only a fourth (.24) have AI best friends. Most (.64) have lived on a reservation but currently visit with low (.43) or medium (.46) frequency. They are fairly evenly distributed across all levels on three of the indicators of AI cultural engagement—AI cultural traditions, spirituality, and living the “Indian way,” but cluster at the low and medium levels on tribal language. Although there is considerable variability, this class has the highest proportion of all the classes reporting they follow the “White way” at a high level (.41).
Table 4 reports an analysis of variance testing whether the strength of identity as American Indian (on the adapted Phinney scale) varies across the latent classes, showing significant mean differences (F=5.1, 4 d.f., p < .001). Tukey multiple group comparison tests indicate that class 3 has significantly higher ethnic identity scores than class 1 and class 2, and class 5 has significantly higher scores than class 1.
Table 4. Analysis of Variance of American Indian Ethnic Identity by Latent Classes.
| Sum of Squares | df | Mean Square | F | Sig. | |
|---|---|---|---|---|---|
| Between Groups | 6.04 | 4 | 1.510 | 5.150 | .001 |
| Within Groups | 54.55 | 186 | .293 | ||
| Total | 60.59 | 190 | |||
|
| |||||
| N | Mean | S.D. | S. E. | ||
|
| |||||
| Class 1 | 17 | 2.66 | .635 | .154 | |
| Class 2 | 23 | 2.82 | .370 | .077 | |
| Class 3 | 68 | 3.22 | .621 | .075 | |
| Class 4 | 20 | 3.06 | .536 | .119 | |
| Class 5 | 63 | 3.13 | .471 | .059 | |
| Tukey Tests | |||||
|
| |||||
| (I) Class | (J) Class | Mean Diff. (I-J) | S.E | Sig. | |
|
| |||||
| 1 | 2 | -0.159 | 0.173 | .891 | |
| 3 | -0.559* | 0.147 | .002 | ||
| 4 | -0.400 | 0.179 | .170 | ||
| 5 | -0.469* | 0.148 | .015 | ||
|
| |||||
| 2 | 1 | 0.159 | 0.173 | .891 | |
| 3 | -0.400* | 0.131 | .021 | ||
| 4 | -0.241 | 0.166 | .592 | ||
| 5 | -0.311 | 0.132 | .133 | ||
|
| |||||
| 3 | 1 | 0.559* | 0.147 | .002 | |
| 2 | 0.400* | 0.131 | .021 | ||
| 4 | 0.159 | 0.138 | .776 | ||
| 5 | 0.090 | 0.095 | .877 | ||
|
| |||||
| 4 | 1 | 0.400 | 0.179 | .170 | |
| 2 | 0.241 | 0.166 | .592 | ||
| 3 | -0.159 | 0.138 | .776 | ||
| 5 | -0.069 | 0.139 | .987 | ||
|
| |||||
| 5 | 1 | 0.469* | 0.148 | .015 | |
| 2 | 0.311 | 0.132 | .133 | ||
| 3 | -0.090 | 0.095 | .877 | ||
| 4 | 0.069 | 0.139 | .987 | ||
The mean difference is significant at the 0.05 level.
Additional tests, not reported in tables, indicated that there were no significant variations on the demographic characteristics of the latent classes, including gender, age, living with one or both parents, and socioeconomic status as indicated by participation in the Federal school lunch program. There were also no statistically significant differences on measures of: use of alcohol, cigarettes, marijuana, inhalants, or other illicit drugs (Hansen, Johnson, Flay, Graham, & Sobel, 1988);, permissive attitudes toward drug use (Hansen & Graham, 1991); anti-social and oppositional behavior (Achenback & Rescorla, 2001); decision-making skills (Botvin, Griffin, Diaz, & Iffil-Williams,2001); and perceived ethnic discrimination (Mena, Padilla & Maldonado, 1987). There was, however, a significant difference in academic performance (F=3.5, 4 d.f., p < .01). As measured by the student's self-reported “usual” grades in school (on a 9 point scale from mostly Ds and Fs to mostly As), the culturally disengaged class 4 students reported poorer grades than classes 1, 3 and 5 in Tukey tests (p < .05).
In a final examination of the validity of the latent classes, Table 5 presents a summary of their associations with the students’ open-ended descriptions of the sources of their American Indian identity. The table presents the proportion of students within each latent class who volunteered a description within each particular category, without distinguishing whether it was mentioned first, second or third. Students could list up to three descriptors and be represented in multiple categories; if a student's multiple descriptions fell into the same category they were represented only once in these results.
The table lists categories within the identification component of Markstrom's AI identity model first. A specific tribal affiliation, often connected to a formal enrollment process, was mentioned as a key source of AI identity more often by class two than by other classes. Membership in a clan, typically determined by parental heritage, was listed more often by class four. Although rare overall, blood quantum was mentioned most often by class one, and not at all by classes two and four. The next three categories fall within the connection component of Markstrom's model. Family background, including references to a specific family relation of any degree (parents, siblings, grandparents, aunts, uncles), was mentioned more frequently than any other category overall, and by about half of classes one and five, but class three was less likely than other classes to mention this category. The ancestry category—referring to the ability to trace AI heritage through the generational descent—was mentioned less often than a specific family connection and did not vary significantly across the classes. Ties to a tribal reservation or “land,” were mentioned less often by class one than by the other classes. Three categories fit within Markstrom's culture and spirituality component. The ability to speak or exposure to one's tribal language was mentioned as a key source of AI identity by over a third of class three, but by few in classes one and two. References to sacred traditions, including active participation in AI ceremonies and spiritual practices, were listed by a higher proportion of those in class five, and not mentioned at all by classes one and four. The next category included references to the adoption of different aspects of AI food, clothing, jewelry, customs or cultural events. Although the second most commonly mentioned category, it did not vary significantly across classes.
The last three categories of the open-ended identity descriptions bear a more uncertain relationship to the components of Markstrom's model. Physical traits included references to appearance that are commonly associated with AI people, for example “long black hair.” This category was mentioned by around one in five of those in every class, without significant variation. The next category of self-identity claims refers to inherent, unobservable personal characteristics, for example, “being free.” This category—which might reflect aspects of what Markstrom includes under the identification component but with diffuse and uncertain links to Native heritage—was mentioned more often by class one than by other classes. The final, “other” category included miscellaneous responses and those which raters did not have adequate information to assess. These responses were mentioned by a higher proportion of class two.
Discussion
This study found that the urban AI youth in this southwestern sample could be described by five combinations of identity measures. The largest group (class three) was highly enculturated and scored in the high ranges on measures reflecting all three dimensions of Markstrom's AI local identity model. Students in this class reported strong AI ties through parental heritage, past and present reservation connections, and the highest levels of engagement with AI culture. Nearly as numerous was a more bicultural group (class five) that was distinctive in embracing both native and non-native cultural orientations (with the exception of tribal language), thus manifesting alignment both with Markstrom's local and national levels of identity. One of the remaining groups (class two) mirrored class five on measures of heritage and reservation connection, but was less engaged with AI culture. Class four approximated class three with high values on measures of parental heritage and reservation connection, but was relatively disengaged both from AI and mainstream culture. The smallest group (class one) was the group most likely to have mixed-AI and non-AI parental heritage and self-identity, and very low engagement with AI culture. It was an acculturated group reporting higher affinity for the following the “White way” than the “Indian way” of life.
Some evidence of the validity of the latent classes came from their association with measures of the strength of American Indian ethnic identity, and open-ended identity descriptions. The latent class with the strongest connection to AI parental heritage and culture (class three) had the highest overall ethnic identity scores and was most likely in open ended descriptions to identify tribal language as a defining facet of their AI identity. This finding is consistent with the concept of “language as identity” (Kroskrity & Field, 2009), that language and oral tradition link AIs to their past and provide a basis for continuity with future generations through the intergenerational transmission of traditional teachings, songs, medicines and practices (Kovach, 2009). Some communities teach youth that speaking the tribal language is necessary to identify fully with one's heritage (McCarty, Romero, & Zepeda, 2006), and is a “badge of ethnic identity” (Kroskrity, 1992). Class five, a more biculturally oriented group than class three, also had significantly higher ethnic identity scores and was the group most likely in open ended responses to identify participation in sacred traditions as a source of their AI identity.
The most acculturated and least enculturated class, often having mixed heritage parents (class one), reported the lowest overall ethnic identity scores, and was more likely than any other class to feel equally or more a part of non-AI ethnic groups. More than any others, in open ended responses this class mentioned blood quantum and personal characteristics as the sources of their AI identity. Identity through blood quantum, often viewed as a colonial imposed construct (Strong & Van Winkle, 1996; TallBear, 2003), is controversial and offensive to AI communities that see it as implicitly denigrating those of mixed heritage by suggesting the existence of blood lines that represent “a once-pure category” (Garouette, 2003, pg. 56). Given that AIs have high rates of intermarriage with non-Natives, blood quantum definitions pose the threat of “statistical extermination,” and a way to limit the US government's remaining obligations to AIs.
Despite the variations across classes on the identity measures, it is important to note the high overall alignment with all of them. Most of the urban AI youth in this sample connected to their indigenous heritage across all components of Markstrom's local and national identity model. Reflecting the identification component, virtually all claimed a tribal affiliation, traced their native heritage through both parents (although one-fifth had non-native mothers and one-third non-native fathers), and over half considered themselves to be “AI only.” The salience of the second Markstrom component—connection—emerged in the youths’ frequent visits to reservations, the way they often linked their AI identity to family members or ancestors, and cultivation of AI best friends in the city. The youth incorporated the third component— culture/spirituality—in more variable ways. A large majority participated in multiple AI cultural practices and spirituality, most heard their tribal language spoken at home, and some spoke it.
The salience of the national level of identity in Markstom's model emerged through the plurality of the youth that had strong or moderate bicultural orientations, adopting both the Indian and White way of life. Some of the latent classes—notably classes four and five— reported high values on one or two but not all dimensions of Markstrom's identity model, yet they reported overall strength of ethnic identity that was statistically indistinguishable from the class with the strongest AI heritage and enculturation (class three). The generally high scores on the modified Phinney ethnic identity scale need to be kept in mind in interpreting the substantive significance of any variations across latent classes. This suggests that in this sample the strength of identification as AI is not completely determined by having two AI-only parents, a personal identity as AI-only, or the strongest embrace of native culture and spirituality. Many of the youth appeared to have integrated a strong sense of AI identity even when it was rooted in diverse elements or incorporated both mainstream and native cultures.
The diverse foundations of AI identity were especially evident in the way that the classes were distinguished from each other by differences in cultural orientation, confirming the salience of the concepts of enculturation (Zimmerman et al., 1994) and bicultural competence (LaFromboise et al., 2010) for these urban AI youth. As noted above, the two latent classes with the strongest sense of AI ethnic identity (classes 3 and 5) were especially likely to mention activities related to enculturation—involvement with their tribal language and sacred cultural traditions—as key defining features of their AI identity. It was notable, however, that both of these two classes reported strong yet distinctive cultural orientations, with the first group focused more exclusively on AI culture and the second reporting the strongest bicultural orientations.
In addition to highlighting the important role of enculturation in formation of a strong AI ethnic identity, the study's findings bear indirectly on the continuing debate about the possible benefits of enculturation and bicultural competence for the mental health and wellbeing of AI youth. The survey lacked direct measures to explore whether enculturation helps equip urban AI with coping abilities to deal with acculturation pressures (LaFramboise et al., 2006; Zimmerman et al., 1996), or to assess the cognitive and perceptual processes that lead to bicultural competence (LaFramboise et al., 1993). However, the study did examine several outcomes that may be associated with the acculturative stress and coping process—decision-making skills, perceived ethnic discrimination, substance use and anti-social behaviors—but detected no statistically significant differences across the latent classes. Some of these measures gauged relatively rarely reported events, such as substance use and antisocial behavior, making it especially difficult to detect statistically significant variations with a small sample.
There was, however, a significant difference across latent classes in academic performance. Consistent with previous research reporting a positive relationship between AI enculturation and academic performance, the latent class that was most culturally disengaged reported lower grades than other classes. In this urban AI youth sample, students who were more strongly culturally engaged—whether with American Indian culture, mainstream culture, or both— reported relatively better school grades.
The study offers suggestive implications for school and community practitioners working with urban American Indian youth and their families. The findings align well with other studies showing that strong cultural identity facilitates academic competence and better academic performance, a connection shown in research with both Native and non-native youth (Fryberg et al., 2013; Whitbeck, Hoyt, Stubben, & LaFromboise, 2001). Notably, the study sample included only youth who were enrolled in academic enrichment programs for AI students, which provided opportunities to explore their individual cultural backgrounds and encounter others from diverse tribal heritages. However, the variations among these youth in strength of AI ethnic identity and in degree of cultural engagement suggest the importance for schools to recognize other ecodevelopmental influences, particularly those of parents, and assess all the potential sources of cultural assets that urban AI youth can draw upon to develop a strong sense of cultural identity rooted in their heritage. For some subgroups of youth, such as those with parents of mixed AI and non-AI heritage, this may be a complex and challenging undertaking.
Additional research is needed on the sources of cultural identity for urban AI youth and their implications for academic performance and behavioral health. More definitive tests of the relevance and generalizability of the latent classes of indigenous identity that emerged in this study will require larger geographically diverse samples of urban AI youth as well as more extensive and nuanced measures of successful coping with acculturative pressures and of resulting mental health and well-being. In addition, samples should include youth at different developmental stages from preadolescence to young adulthood to capture the evolution of identity formation, and use recruitment methods more representative of the tribal and ethnic diversity of urban AI families, and of the distinctive settlement histories of different urban AI communities.
Limitations
This was an exploratory, cross-sectional study of a non-probability sample in one metropolitan area of the southwest, limiting the generalizability of the results and creating only a snapshot of dynamic identity formation processes. Recruitment of students from academic enrichment classes for AI students may have favored the selection of students from more culturally engaged AI families. The small scale of the study also limited the ability to account for the influence of social contexts that may shape the expression of AI youth identity, such as the proportional representation of AI students in the school, the diversity of tribal heritages represented in the community, and physical proximity to tribal communities of origin. These contexts may influence how urban AI youth explore, select, assemble and describe different sources of indigenous identity.
Conclusions
Despite these limitations, the study advances knowledge on the nature and sources of indigenous identities for urban AI youth, how they may be combined, and how they maintain connections to cultural heritage. In spite of the challenges of maintaining cultural identities in the urban environment due to ethnic and tribal intermarriage, family migration, and acculturation pressures, most youth in this sample expressed a strong sense of AI ethnic identity, claimed personal and parental tribal heritage, remained connected to reservation communities, and actively engaged in AI cultural and spiritual life. Those most immersed in traditional culture, language and spirituality who also had strong AI parental heritage reported the highest levels of AI ethnic identity, but the AI ethnic identities of the more bicultually oriented were also quite strong. Future research is needed on the wellbeing of urban AI youth who adopt different ways of forming a strong indigenous identity, and on ways to support its development.
Acknowledgments
Data collection and analysis for this study was supported by the National Institute on Minority Health and Health Disparities [NIH/NIMHD] (P20-MD002316, F.F. Marsiglia, PI, and R01-MD006110, S. Kulis, PI). The content is solely the responsibility of the authors and does not necessarily represent the official views of the National Institutes of Health.
References
- Achenback TM, Rescorla LA. Manual for the ASEBA school-age forms and profiles. Burlington,VT: University of Vermont, Research Center for Children, Youth & Families; 2001. [Google Scholar]
- Baldwin JA, Brown BG, Wayment HA, Nez RA, Brelsford KM. Culture and context: Buffering the relationship between stressful life events and risky behaviors in American Indian youth. Substance Use & Misuse. 2011;46(11):1380–1394. doi: 10.3109/10826084.2011.592432. [DOI] [PubMed] [Google Scholar]
- Bankston CL, Zhou M. The social adjustment of Vietnamese American adolescents: Evidence for a segmented-assimilation approach. Social Science Quarterly. 1997;78:508–523. [Google Scholar]
- Benet-Martínez V, Lee F, Leu J. Biculturalism and cognitive complexity expertise in cultural representations. Journal of Cross-Cultural Psychology. 2006;37:386–407. [Google Scholar]
- Berry JW. Immigration, acculturation and adaptation. Applied Psychology. 1997;46:5–34. doi: 10.1111/j.1464-0597.1997.tb01087.x. [DOI] [Google Scholar]
- Berry JW. Conceptual approaches to acculturation. In: Chun K, Balls Organista P, Marín G, editors. Acculturation: Advances in theory, measurement, and applied research. Washington, DC: American Psychological Association; 2003. pp. 17–37. [Google Scholar]
- Berry JW. Acculturation strategies and adaptation. In: Lansford JE, editor. Immigrant families in contemporary society. New York: Guilford Press; 2007. pp. 69–82. [Google Scholar]
- Berry JW, Phinney JS, Sam DL, Vedder P. Immigrant youth: Acculturation, identity and adaptation. Applied Psychology. 2006;55:303–332. doi: 10.1111/j.1464-0597.2006.00256.x. [DOI] [Google Scholar]
- Botvin GJ, Griffin KW, Diaz T, Iffil-Willimas M. Drug abuse prevention among minority adolescents: Posttest and one-year follow-up of a school-based preventive intervention. Prevention Science. 2001;2:1–13. doi: 10.1023/a:1010025311161. [DOI] [PubMed] [Google Scholar]
- Brady M. Culture in treatment, culture as treatment: A critical appraisal of developments in addictions programs for indigenous North Americans and Australians. Social Science & Medicine. 1995;41:1487–1498. doi: 10.1016/0277-9536(95)00055-c. [DOI] [PubMed] [Google Scholar]
- Burt LW. Roots of the Native American urban experience: Relocation policy in the 1950s. American Indian Quarterly. 1986;10(2):85–99. [Google Scholar]
- Clifford James. Varieties of indigenous experience: Diasporas, homelands, sovereignties. In: de la Cadena M, Starn O, editors. Indigenous experience today. Oxford, UK: Berg Publishers; 2007. [Google Scholar]
- Corbin JM, Strauss AL. Basics of qualitative research: techniques and procedures for developing grounded theory. 3rd. Los Angeles, CA: Sage Publications, Inc; 2008. [Google Scholar]
- DeCoteau T, Hope DA, Anderson J. Anxiety, stress, and health among northern plains Native Americans. Behavior Therapy. 2003;34:365–380. [Google Scholar]
- Duran B, Harrison M, Shurley M, Foley K, Morris P, Davidson-Stroh L, Iralu J, Jiang Y, Andrasik MP. Tribally-driven HIV/AIDS health services partnerships: Evidence-based meets culture-centered interventions. Journal of HIV/AIDS and Social Services. 2010;9:110–129. [Google Scholar]
- Fryberg SA, Troop-Gordon W, D'Arrisso A, Flores H, Ponizovskiy V, Ranney JD, Burack JA. Cultural mismatch and the education of aboriginal youths: The interplay of cultural identities and teacher ratings. Developmental Psychology. 2013;49(1):72–79. doi: 10.1037/a0029056. doi:http://dx.doi.org/10.1037/a0029056. [DOI] [PubMed] [Google Scholar]
- Garrett MT, Carroll JJ. Mending the broken circle: Treatment of substance dependence among Native Americans. Journal of Counseling and Development. 2000;78:379–388. [Google Scholar]
- Garroute EM. Real Indians: Identity and the survival of Native America. Berkeley, CA: University of California Press; 2003. [Google Scholar]
- Gone JP. A community-based treatment for Native American historical trauma: Prospects for evidence-based practice. Journal of Consulting and Clinical Psychology. 2009;77:751–762. doi: 10.1037/a0015390. [DOI] [PubMed] [Google Scholar]
- Gray N, Mays MZ, Wolf D, Jirsak J. A culturally focused wellness intervention for American Indian women of a small southwest community: Associations With alcohol use, abstinence self-efficacy, symptoms of depression, and self-esteem. American Journal of Health Promotion. 2010;25(2):e1–e10. doi: 10.4278/ajhp.080923-quan-209. doi:http://dx.doi.org.ezproxy1.lib.asu.edu/10.4278/ajhp.080923-QUAN-209. [DOI] [PubMed] [Google Scholar]
- Gray N, Nye PS. American Indian and Alaska Native substance abuse: Co-morbidity and cultural issues. American Indian & Alaska Natives Mental Health Research. 2001;10(2):67–84. doi: 10.5820/aian.1002.2001.67. [DOI] [PubMed] [Google Scholar]
- Guest G, Bunce A, Johnson L. How many interviews are enough? An experiment with data saturation and variability. Field Methods. 2006;18:59–82. [Google Scholar]
- Hansen WB, Graham JW. Preventing alcohol, marijuana, and cigarette use among adolescents: Peer pressure resistance training versus establishing conservative norms. Preventive Medicine. 1991;20:414–430. doi: 10.1016/0091-7435(91)90039-7. [DOI] [PubMed] [Google Scholar]
- Hansen WB, Johnson CA, Flay BR, Graham JW, Sobel JL. Affective and social influence approaches to the prevention of multiple substance abuse among seventh grade students: Results from project SMART. Preventive Medicine. 1988;17:135–154. doi: 10.1016/0091-7435(88)90059-x. [DOI] [PubMed] [Google Scholar]
- Herman-Stahl M, Spencer DL, Duncan JE. The implications of cultural orientation for substance use among American Indians. American Indian & Alaska Natives Mental Health Research. 2003;11:46–66. doi: 10.5820/aian.1101.2003.46. [DOI] [PubMed] [Google Scholar]
- Hodge DR, Limb GE. Spiritual histories and Native Americans: A mixed method validation study. Journal of Social Service Research. 2009;35:285–296. [Google Scholar]
- Iwasakia Y, Bartlett J, O’Neil J. Coping with stress among Aboriginal women and men with diabetes in Winnipeg, Canada. Social Science & Medicine. 2005;60:977–988. doi: 10.1016/j.socscimed.2004.06.032. http://dx.doi.org/10.1016/j.socscimed.2004.06.032. [DOI] [PubMed] [Google Scholar]
- Jeffries N. A note on ‘Testing the number of components in a normal mixture.’. Biometrika. 2003;90(4):991–994. [Google Scholar]
- Kass RE, Raftery AE. Bayes factors. Journal of the American Statistical Association. 1995;90(430):773–795. [Google Scholar]
- Kovach M. Indigenous methodologies: Characteristics, conversations, and contexts. Toronto: University of Toronto press; 2009. [Google Scholar]
- Kroskrity PV. Arizona Kiva speech as a manifestation of linguistic ideology. Pragmatics. 1992;2:297–309. [Google Scholar]
- Kroskrity PV, Field MC. Native American language ideologies: Beliefs, practices, and struggles in Indian country. Tucson, AZ: University of Arizona Press; 2009. [Google Scholar]
- Kulis S, Dustman PA, Brown EF, Martinez M. Expanding urban American Indian youths’ repertoire of drug resistance skills: Pilot results from a culturally adapted prevention program. American Indian and Alaska Native Mental Health Research. 2013;20:35–54. doi: 10.5820/aian.2001.2013.35. [DOI] [PMC free article] [PubMed] [Google Scholar]
- Kulis S, Reeves LJ, Dustman PA, O’Neill M. Strategies to resist drug offers among urban American Indian youth of the Southwest: An enumeration, classification, and analysis by substance and offeror. Substance Use and Misuse. 2011;46:1395–1409. doi: 10.3109/10826084.2011.592433. [DOI] [PMC free article] [PubMed] [Google Scholar]
- LaFromboise TD, Albright K, Harris A. Patterns of hopelessness among American Indian adolescents: Relationships by levels of acculturation and residence. Cultural Diversity and Ethnic Minority Psychology. 2010;16:68–76. doi: 10.1037/a0016181. [DOI] [PubMed] [Google Scholar]
- LaFromboise T, Coleman HL, Gerton J. Psychological impact of biculturalism: evidence and theory. Psychological Bulletin. 1993;114:395–412. doi: 10.1037/0033-2909.114.3.395. [DOI] [PubMed] [Google Scholar]
- LaFromboise TD, Hoyt DR, Oliver L, Whitbeck LB. Family, community, and school influences on resilience among American Indian adolescents in the upper Midwest. Journal of Community Psychology. 2006;34(2):193–209. [Google Scholar]
- LaFromboise TD, Medoff L, Lee CC, Harris A. Psychosocial and cultural correlates of suicidal ideation among American Indian early adolescents on a northern plains reservation. Research in Human Development. 2007;4:119–143. [Google Scholar]
- LaFromboise TD, Trimble JE, Mohatt GV. Counseling intervention and American Indian tradition: An integrative approach. Counseling Psychologist. 1990;18:628–654. [Google Scholar]
- Lester D. Native American suicide rates, acculturation stress and traditional integration. Psychological Reports. 1999;84(2):398. doi: 10.2466/pr0.1999.84.2.398. [DOI] [PubMed] [Google Scholar]
- Liebler CA. American Indian ehnic identity: Tribal nonresponse in the 1990 Census. Social Science Quarterly. 2004;85:310–323. [Google Scholar]
- Long C, Downs AC, Gillette B, Kills In Sight L, Konen EI. Assessing cultural life skills of American Indian youth. Child Youth Care Forum. 2006;35:289–304. [Google Scholar]
- Macartney S, Bishaw A, Fontenot K. American Community Survey Briefs. Washington: U.S. Census Bureau; 2013. Poverty rates for selected detailed race and Hispanic groups by state and place: 2007–2011. http://www.census.gov/prod/2013pubs/acsbr11-17.pdf. [Google Scholar]
- Magidson J, Vermut J. Latent class models. In: Kaplan D, editor. The sage handbook of quantitative methodology for the social sciences. Thousand Oaks, CA: Sage Publications; 2004. pp. 175–198. [Google Scholar]
- Markstrom CA. Identity formation of American Indian adolescents: Local, national, and global considerations. Journal of Research on Adolescence. 2011;21(2):519–535. doi: 10.1111/j.1532-7795.2010.00690.x. [DOI] [Google Scholar]
- May PA, Moran JR. Prevention of alcohol misuse: A review of health promotion efforts among American Indians. American Journal of Health Promotion. 1995;9:288–299. doi: 10.4278/0890-1171-9.4.288. [DOI] [PubMed] [Google Scholar]
- McCarty TL, Romero ME, Zepeda O. Reclaiming the gift: Indigenous youth counter-narratives on Native language loss and revitalization. American Indian Quarterly. 2006;30:28–48. [Google Scholar]
- McCormick RM. Aboriginal traditions in the treatment of substance abuse. Canadian Journal of Counseling. 2000;34:25–32. [Google Scholar]
- Mena FJ, Padilla AM, Maldonado M. Acculturative stress and specific coping strategies among immigrant and later generation college students. Hispanic Journal of Behavioral Sciences. 1987;9:207–225. [Google Scholar]
- Mihesuah DA. American Indian identities: Issues of individual choices and development. American Indian Culture and Research Journal. 1998;22(2):193–226. [Google Scholar]
- Mok A, Morris MW, Benet-Martínez V, Karakitapoğlu-Aygün Z. Embracing American culture: Structures of social identity and social networks among first-generation biculturals. Journal of Cross-Cultural Psychology. 2007;38:629–635. doi: 10.1177/0022022107305243. [DOI] [Google Scholar]
- Moncher MS, Holdem GW, Trimble JE. Substance abuse among Native-American youth. In: Marlatt G, VandenBos G, editors. Addictive behaviors: Readings on etiology, prevention, and treatment. Washington, DC: American Psychological Association; 1997. pp. 841–856. [Google Scholar]
- Moran JR, Fleming CM, Somervall P, Manson SM. Measuring bicultural ethnic identity among American Indian adolescents: A factor analytic study. Journal of Adolescent Research. 1999;14:405–426. [Google Scholar]
- Muthén B, Muthén LK. Mplus users guide. Los Angeles, CA: Muthén and Muthén; 2008. [Google Scholar]
- Nagel J. American Indian ethnic renewal: Red Power and the resurgence of identity and culture. New York, NY: Oxford University Press; 1996. [Google Scholar]
- National Urban Indian Family Coalition. Urban Indian America. National Urban Indian Family Coalition; Seattle, WA: 2008. The status of American Indian and Alaska Native children and families today. Report to the Annie E. Casey Foundation. Retrieved online on April 2, 2014 at http://www.aecf.org/KnowledgeCenter/Publications.aspx?pubguid={CCB6DEB2-007E-416A-A0B2-D15954B48600} [Google Scholar]
- Nylund K, Asparouhov T, Muthen B. Deciding on the number of classes in latent class analysis and growth mixture modeling: A Monte Carlo simulation study. Structural Equation Modeling: An Interdisciplinary Journal. 2007;14:535–569. [Google Scholar]
- Oetting ER, Beauvais F. Orthogonal cultural identification theory: The cultural identification of minority adolescents. Substance Use & Misuse. 1991;25(s5-s6):655–685. doi: 10.3109/10826089109077265. [DOI] [PubMed] [Google Scholar]
- Phinney JS. The multigroup ethnic identity measure: A new scale for use with diverse groups. Journal of Adolescent Research. 1992;7:156–176. [Google Scholar]
- Phinney JS, Horenczyk G, Liebkind K, Vedder P. Ethnic identity, immigration, and well-being: An interactional perspective. Journal of Social Issues. 2002;57:493–510. doi: 10.1111/0022-4537.0022. [DOI] [Google Scholar]
- Ramirez R. Healing through grief: Urban Indians reimagining culture and community. In: Lobo S, Peters K, editors. American Indians and the urban experience. Walnut Creek, CA: Alta Mira Press; 2001. pp. 249–264. [Google Scholar]
- Reeves LR, Dustman PA, Harthun ML, Kulis S, Brown EF. American Indians’ cultures: How CBPR illuminated inter-tribal cultural elements fundamental to an adaptation effort. Prevention Science. 2014;15(4):547–556. doi: 10.1007/s11121-012-0361-7. [DOI] [PMC free article] [PubMed] [Google Scholar]
- Reinke WM, Herman KC, Petras H, Ialongo NS. Empirically derived subtypes of child academic and behavior problems: Co-occurrence and distal outcomes. Journal of Abnormal Child Psychology. 2008;36:759–770. doi: 10.1007/s10802-007-9208-2. [DOI] [PMC free article] [PubMed] [Google Scholar]
- Rudmin FW. Critical history of the acculturation psychology of assimilation, separation, integration, and marginalization. Review of General Psychology. 2003;7:3–37. doi: 10.1037/1089-2680.7.1.3. [DOI] [Google Scholar]
- Schinke SP, Orlandi MA, Botvin GJ, Gilchrist LD, Trimble JE, Locklear VS. Preventing substance abuse among American Indian adolescents: A bicultural competence skills approach. Journal of Counseling Psychology. 1988;35:87–90. [PMC free article] [PubMed] [Google Scholar]
- Spicer P, Novins DK, Mitchell CM, Beals J. Aboriginal social organization, contemporary experience and American Indian adolescent alcohol use. Journal of Studies of Alcohol. 2003;64:450–457. doi: 10.15288/jsa.2003.64.450. [DOI] [PubMed] [Google Scholar]
- Strong PT, Van Winkle B. “Indian blood”: Reflections on the reckoning and refiguring of Native North American identity. Cultural Anthropology. 1996;11(4):547–576. doi: 10.1525/can.1996.11.4.02a00050. [DOI] [Google Scholar]
- Stubben JD. Working with and conducting research among American Indian families. American Behavioral Scientist. 2001;44:1466–1481. [Google Scholar]
- Suinn RM, Rickard-Figueroa K, Lew S, Vigil P. The Suinn-Lew Asian Self-Identity Acculturation Scale: An initial report. Educational and Psychological Measurement. 1987;47:401–407. doi: 10.1177/0013164487472012. [DOI] [Google Scholar]
- Sunday J, Eyles J, Upshur R. Applying Aristotle's doctrine of causation to Aboriginal and biomedical understandings of diabetes. Culture, Medicine and Psychiatry. 2001;25:63–85. doi: 10.1023/a:1005638900581. [DOI] [PubMed] [Google Scholar]
- Tadmor CT, Tetlock PE, Peng K. Acculturation strategies and integrative complexity: The cognitive implications of biculturalism. Journal of Cross-Cultural Psychology. 2009;40:105–139. doi: 10.1177/0022022108326279. [DOI] [Google Scholar]
- TallBear K. DNA, blood, and racializing the tribe. Wicazo Sa Review. 2003;18(1):81–107. doi: 10.1353/wic.2003.0008. [DOI] [Google Scholar]
- Trimble JE. Social psychological perspectives on changing self-identification among American Indians and Alaska Natives. In: Dana RH, editor. Handbook of cross-cultural and multicultural personality assessment. Mahwah, NJ: Lawrence Erlbaum; 2000. pp. 197–222. [Google Scholar]
- Umaña-Taylor AJ, Alfaro EC. Ethnic identity among US Latino adolescents: Theory, measurement, and implications for well-being. In: Villarruel FA, Luster T, editors. The crisis in youth mental health: Critical issues and effective programs, Vol. 2 Disorders in adolescence. Westport, CT: Praeger Publishers; 2006. pp. 195–211. [Google Scholar]
- U.S. Bureau of the Census. Census 2010 American Indian and Alaska Native Summary File; Table: PCT2; Urban and rural; Universe Total Population; Population group name: American Indian and Alaska Native alone or in combination with one or more races 2010 [Google Scholar]
- U.S. Bureau of the Census. 132st. Washington, DC: 2012. Statistical Abstract of the United States: 2012. 2012; http://www.census.gov/compendia/statab/2012/tables/12s0023.pdf. [Google Scholar]
- Vermunt JK, Magdison J. Latent class models for classification. Computational Statistics and Data Analysis. 2003;41:531–537. [Google Scholar]
- Vivero VN, Jenkins SR. Existential hazards of the multicultural individual: Defining and understanding "cultural homelessness.". Cultural Diversity & Ethnic Minority Psychology. 1999;5:6–26. doi: 10.1037/1099-9809.5.1.6. [DOI] [PubMed] [Google Scholar]
- Walters KL. Urban American Indian identity and psychological wellness. University of California; Los Angeles: 1995. Unpublished doctoral dissertation. [Google Scholar]
- Walters KL. Urban American Indian identity attitudes and acculturation styles. Journal of Human Behavior in the Social Environment. 1999;2:163–178. [Google Scholar]
- Walters KL, Simoni JM, Evans-Campbell T. Substance use among American Indians and Alaska Natives: Incorporating culture in an “Indigenist” stress-coping paradigm. U.S. Dept. of Health and Human Services. Public Health Reports. 2002;117(Supplement 1):S104–s117. [PMC free article] [PubMed] [Google Scholar]
- Weaver HN, Brave Heart MY. Examining two facets of American Indian identity: Exposure to other cultures and the influence of historical trauma. Journal of Human Behavior in the Social Environment. 1999;2:19–33. doi: 10.1300/J137v02n01_03. [DOI] [Google Scholar]
- Whitbeck LB, Hoyt DR, McMorris BJ, Chen X, Stubben JD. Perceived discrimination and early substance abuse among American Indian children. Journal of Health & Social Behavior. 2001;42:405–424. [PubMed] [Google Scholar]
- Whitbeck LB, Hoyt DR, Stubben JD, LaFromboise T. Traditional culture and academic success among American Indian children in the upper Midwest. Journal of American Indian Education. 2001;40:48–60. [Google Scholar]
- Whitbeck LB, McMorris BJ, Hoyt DR, Stubben JD, LaFromboise T. Perceived discrimination, traditional practices, and depressive symptoms among American Indians in the upper Midwest. Journal of Health and Social Behavior. 2002;43:400–418. doi: 10.2307/30902. [DOI] [PubMed] [Google Scholar]
- Whitbeck LB, Walls M, Hartshorn K. Indigenous adolescent development: Psychological, social and historical contexts. New York: Routledge; 2014. [Google Scholar]
- Whitesell NR, Mitchell CM, Spicer P, Voices of Indian Teens Project Team A longitudinal study of self-esteem, cultural identity, and academic success among American Indian adolescents. Cultural Diversity and Ethnic Minority Psychology. 2009;15:38–50. doi: 10.1037/a0013456. [DOI] [PMC free article] [PubMed] [Google Scholar]
- Zimmerman MA, Ramirez J, Washienko KM, Walter B, Dyer S. Enculturation hypothesis: Exploring direct and positive effects among Native American youth. In: McCubbin H, Thompson E, Thompson A, Fromer J, editors. Resiliency in ethnic minority families, Vol. 1: Native and immigrant American families. Madison, WI: University of Wisconsin; 1994. pp. 199–220. [Google Scholar]
- Zimmerman MA, Ramirez-Valles J, Washienko KM, Walter B, Dyer S. The development of a measure of enculturation for Native American youth. American Journal of Community Psychology. 1996;24:295–310. doi: 10.1007/BF02510403. [DOI] [PubMed] [Google Scholar]