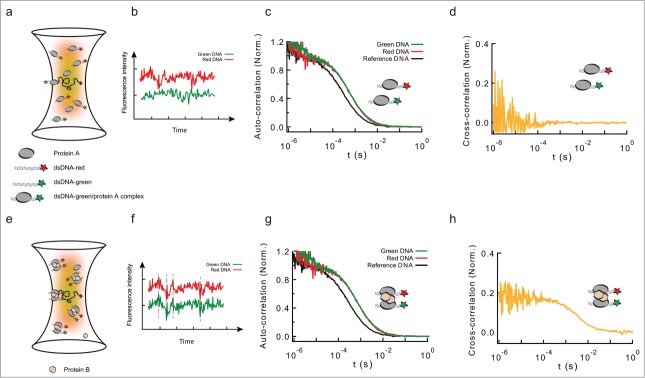
Figure 1.

Formation of long-range interactions by insulator proteins studied by PIE-FCCS. (a) Scheme depicting a typical fluorescence cross-correlation fluctuation spectroscopy (FCCS) configuration. Two fluorescently-labeled dsDNA fragments (black ribbons with green or red stars) are specifically bound by a DNA-binding protein (protein A, gray ellipse), and diffuse in and out of an excitation volume (yellow to red gradient). (b) This diffusion produces a time-dependent fluctuation in the fluorescence signals of the green and red-labeled dsDNA fragments (red and green traces). These fluctuations are independent (uncorrelated) if the red and green-labeled dsDNA fragments are not in the same molecular complex. (c) Auto-correlation functions of free dsDNA (no protein, black, could represent either green or red-labeled dsDNA), and of protein-DNA complexes formed by the interaction of protein A with green- and red-labeled DNA (green and red solid lines, respectively). As the shapes of both complexes is the same, the autocorrelation curves are undistinguishable. Binding of protein A leads to a discrete shift in the curve (compare black and red/green curves). (d) Cross-correlation function between the intensity fluctuation signals from protein-DNA complexes formed by the binding of protein A (gray ellipse) to green/red-labeled dsDNA. Absence of cross-correlation is due to the lack of correlated movement of the 2 probes, and indicates that green and red-labeled dsDNA are not in the same molecular complex. (e) Schematic representation of molecular complexes in which protein B (pink hexagon) bridges green- and red-labeled dsDNA fragments pre-bound by protein A. (f) The diffusion of these large complexes in and out of the excitation volume leads to a correlated time-dependent fluctuation in the fluorescence signals of the green and red channels (green and red traces). These fluctuations are correlated at different time-scales. (g) Auto-correlation functions of free dsDNA, and of protein-DNA complexes formed by the interaction of protein B with green- and red-labeled DNA fragments pre-bound by protein A. Even when both dsDNA fragments are part of the same molecular complex, the auto-correlation function displays a single shift in both colors. The size of the shift is larger than in panel (c), due to the increased size of the protein-DNA complex. (h) Cross-correlation function between the intensity fluctuation signals from protein-DNA complexes formed by the formation of a complex involving both green- and red-labeled dsDNA. A positive cross-correlation signal at different time-scales indicates protein-mediated interactions between green and red-dsDNA.
