

Abstract
Introduction
The prevalence of obesity in Chinese adults increased from 1991 to 2000; however, recent changes in this trend are unclear. This study aims to estimate the current prevalence of obesity and to assess trends in obesity and BMI distribution in Chinese adults from 1991 through 2011.
Methods
Height and weight measurements of 12,249 Chinese adults from the 2011 China Health and Nutrition Survey were analyzed (in 2013) together with China Health and Nutrition Survey data for 1991–2009. Obesity was defined as BMI ≥28.0 based on the Working Group on Obesity in China criteria.
Results
In the 2011 survey, the age-adjusted mean BMI was 23.8 (95% CI=23.7, 23.9) for men and 23.4 (95% CI=23.2, 23.5) for women. The age-adjusted prevalence of obesity was 11.3% (95% CI=10.8%, 11.9%) overall, 11.8% (95% CI=10.8%, 12.6%) among men, and 11.0% (95% CI=10.3%, 11.8%) among women. Estimates of age-adjusted obesity prevalence among the Chinese population were significantly lower than those of the U.S. population (all p<0.05). Over the 20-year period, the prevalence of obesity increased from 2.88% to 11.8% among men (age-adjusted annual change in OR=1.08, 95% CI=1.07, 1.09, p<0.001) and from 4.55% to 11.0% among women (OR=1.05, 95% CI=1.05, 1.06, p<0.001). Similar significant findings were observed for both men and women based on WHO recommendations.
Conclusions
The prevalence of obesity among both Chinese men and women increased significantly from 1991 through 2011, particularly among men.
Introduction
Obesity is a major risk factor for hypertension, diabetes, coronary heart disease, and certain types of cancer.1–6 Ongoing monitoring of trends in obesity is important for assessing interventions aimed at preventing or reducing the burden of obesity. With the increasing global pandemic of obesity, there has also been a dramatic rise in the number of obese adults in China.7,8 For example, during 1989–2000, the prevalence of obesity combined with overweight increased by 50% in adults aged 20–45 years.9 Additionally, Gu et al.10 found that the risk of cardiovascular disease increased with increasing BMI. However, most previous estimates of obesity and overweight were either based on limited survey data that only reflected a relatively short period of changes in obesity9,11,12 or on clinical data. Recent prevalence and trends in the distribution of BMI among Chinese adults remain unknown. In this study, we provide new estimates of the prevalence of obesity and overweight in adults aged 20 years or older based on measurements of weight and height in 2011; we also provide the long-term trend to determine if it is continuing. We further compare the prevalence of obesity in adults between the Chinese and U.S. populations. In addition, we provide the BMI distribution from 1991 to 2011 of the China Health and Nutrition Survey (CHNS) both for the overall adult population and by sex and age group.
Methods
Study Design
The CHNS is an international collaborative project between the National Institute for Nutrition and Food Safety, Chinese Center for Disease Control and Prevention, and University of North Carolina at Chapel Hill, and is also the only large-scale, longitudinal, household-based survey in China to date.13 The first round of the CHNS was conducted in 1989, and subsequently in 1991, 1993, 1997, 2000, 2004, 2006, 2009, and 2011.14 The CHNS began with eight provinces and added a ninth, Heilongjiang in 1997, and the three largest municipalities including Beijing, Shanghai, and Chongqing in 2011, accounting for approximately 56% of China’s population and varying substantially in geography, economic development, public resources, and health indicators.11 In each of the surveyed provinces, a multistage, random-cluster process was used to select the sample. A detailed description of the survey design and procedures has been published elsewhere.13,15 The study was approved by the IRB of the National Institute for Nutrition and Food Safety, China Center for Disease Control and Prevention, and University of North Carolina at Chapel Hill.
Study Population
Analysis was based on data from eight waves of the CHNS conducted from 1991–2011 previously noted, as data were not collected for all age groups in the 1989 survey. This study focused on adults aged ≥20 years in each survey year and data provided information on age, sex, urban–rural status, and detailed physical examinations including weight and height. To limit biases caused by pre-existing factors, this analysis excluded participants who had been diagnosed with pregnancy or were lactating. In addition, participants with missing information on height or weight or extreme or implausible height (<120.0 cm) or BMI (<15.0 or >40.0) values were excluded.
Anthropometric Methods and Definitions of Overweight and Obesity
Weight and height were measured by trained health workers following standardized protocols from WHO.16,17 The body weight of participants dressed in light clothing was measured without shoes to the nearest 0.1 kg with a calibrated beam scale (Seca North America, Chino, CA). The height of barefoot subjects was measured to the nearest 0.1 cm using a portable stadiometer (Seca North America). BMI was calculated as weight in kilograms divided by the height in meters squared, rounded to one decimal place.
According to the criteria of the Working Group on Obesity in China (WGOC),18 general obesity was defined as BMI ≥28.0 and normal weight was defined as BMI <24.0. Based on WHO recommendations,16 normal weight was defined as BMI <25.0, and general obesity was defined as BMI ≥30.0 for adults aged ≥20 years.
Statistical Analysis
All statistical analyses were conducted using SPSS, version 13.0, in 2013. The sample sizes were sufficient to detect an annual increase of 0.05 percentage points with >90% power. Analyses were stratified by sex, age group, and degree of urbanization (urban versus rural). Based on the age at the interview, age was grouped into 20–39 years, 40–59 years, and ≥60 years. Taking into account unequal probabilities of selection, the values of overweight and obesity were adjusted by direct method for the 2010 census of the Chinese adult population using the corresponding age groups.
Trends in the prevalence of obesity (BMI ≥28.0 or BMI ≥30.0) and of overweight and obesity combined (BMI ≥24.0 or BMI ≥25.0) among participants from 1991 to 2011 were assessed by linear-by-linear trend testing. Logistic regression was utilized to further assess the changes in obesity throughout the eight waves of the CHNS, as well as the differential increase rate by sex with an interaction term (sex × survey time). The age-adjusted prevalence obesity estimate from the most recent data (2011 CHNS) was compared between men and women using the chi-square test. A two-tailed p-value <0.05 was considered statistically significant. In addition, comparisons of the prevalence estimates between Chinese adults in the 2011 survey and the U.S. population from the 2011–2012 National Health and Nutrition Examination Survey (NHANES) were conducted. Linear regression was applied to assess the trends in log-transformed BMI. To further examine trends in BMI, selected percentiles were graphed by sex and degree of urbanization.
Sensitivity analyses included analyzing the secular trend of obesity among Chinese adults from 1991 through 2011 based on the inclusion criteria.
Results
Pregnant (n=452) or lactating (n=440) women were excluded from data analysis. Additionally, participants with missing data (n=4,027), extreme height (n=75), or extreme BMI values of <15.0 or >40.0 (n=234) were also excluded. The remaining participants aged ≥20 years were 8,142 for 1991; 7,776 for 1993; 8,282 for 1997; 9,184 for 2000; 8,966 for 2004; 8,982 for 2006; 9,297 for 2009; and 12,249 for 2011. Sample sizes for analyses of the eight waves of the CHNS for 1991–2011 are presented in Appendix Table 1 (available online). Detailed information on the age-adjusted prevalence of obesity and of overweight and obesity combined for the overall sample and by age and sex from the 1991–2011 CHNS is shown in Table 1 according to the WGOC criteria and in Appendix Table 2 (available online) based on WHO recommendations.
Table 1.
Prevalence of Obesity (BMI ≥28 kg/m2) and of Overweight and Obesity Combined (BMI ≥24 kg/m2): CHNS 1991–2011
| Sex | Age/ORs | % (95% CI) | ||||||||
|---|---|---|---|---|---|---|---|---|---|---|
| 1991 | 1993 | 1997 | 2000 | 2004 | 2006 | 2009 | 2011 | p for Trendb | ||
| BMI ≥28a | ||||||||||
| All |
≥20 y |
3.51 (3.11, 3.91) |
3.50 (3.09, 3.91) |
5.54 (5.05, 6.04) |
7.44 (6.90, 7.97) |
8.59 (8.01, 9.17) |
8.87 (8.29, 9.46) |
10.2 (9.62, 10.9) |
11.8 (11.2, 12.4) |
|
| Age adjusted ≥20 yc | 3.75 (3.34, 4.16) |
3.56 (3.15, 3.97) |
5.43 (4.94, 5.92) |
7.24 (6.71, 7.77) |
7.98 (7.42, 8.54) |
8.28 (7.45, 9.11) |
9.82 (9.22, 10.4) |
11.3 (10.8, 11.9) |
<0.001 | |
| ORsd | ─ | 0.950 (0.800, 1.12) |
1.56 (1.33, 1.81) |
1.36 (1.20, 1.54) |
1.11 (0.990, 1.24) |
1.04 (0.940, 1.16) |
1.21 (1.09, 1.34) |
1.17 (1.07, 1.28) |
||
| ORse | ─ | 0.950 (0.800, 1.12) |
1.48 (1.27, 1.71) |
2.01 (1.75, 2.30) |
2.23 (1.94, 2.56) |
2.32 (2.02, 2.66) |
2.81 (2.46, 3.21) |
3.27 (2.88, 3.72) |
||
| Men |
≥20 y |
2.72 (2.21, 3.22) |
2.47 (1.98, 2.97) |
4.91 (4.25, 5.58) |
6.56 (5.83, 7.29) |
7.56 (6.76, 8.35) |
7.75 (6.95, 8.56) |
9.52 (8.66, 10.39) |
11.1 (10.3, 11.9) |
|
| Age adjusted ≥20 yc | 2.88 (2.36, 3.40) |
2.50 (2.00, 3.00) |
4.85 (4.19, 5.51) |
6.49 (5.74, 7.20) |
7.40 (6.62, 8.18) |
7.88 (7.07, 8.69) |
9.87 (8.99, 10.75) |
11.8 (10.8, 12.6) |
0.001 | |
| 20–39 y | 1.17 (0.69, 1.64) |
1.26 (0.74, 1.78) |
3.53 (2.66, 4.4) |
5.85 (4.74, 6.96) |
6.77 (5.38, 8.15) |
8.15 (6.54, 9.75) |
10.3 (8.53, 12.1) |
13.0 (11.2, 14.9) |
||
| 40–59 y | 3.49 (2.51, 4.47) |
2.95 (2.05, 3.85) |
5.11 (4.02, 6.20) |
6.63 (5.49, 7.78) |
8.02 (6.83, 9.21) |
7.97 (6.78, 9.15) |
10.5 (9.20, 11.9) |
11.9 (10.7, 13.1) |
||
| ≥60 y | 5.94 (4.08, 7.80) |
4.68 (3.07, 6.3) |
7.69 (5.79, 9.60) |
7.82 (6.02, 9.62) |
7.64 (6.00, 9.28) |
6.97 (5.47, 8.48) |
7.21 (5.79, 8.63) |
8.38 (7.07, 9.68) |
||
| ORsd | ─ | 0.860 (0.65, 1.13) |
1.98 (1.55, 2.55) |
1.36 (1.13, 1.64) |
1.15 (0.970, 1.36) |
1.07 (0.910, 1.26) |
1.28 (1.10, 1.49) |
1.22 (1.08, 1.39) |
||
| ORse | ─ | 0.860 (0.65, 1.13) |
1.71 (1.35, 2.16) |
2.33 (1.87, 2.91) |
2.68 (2.15, 3.34) |
2.87 (2.31, 3.57) |
3.67 (2.97, 4.53) |
4.49 (3.67, 5.50) |
||
| Women |
≥20 y |
4.26 (3.65, 4.87) |
4.46 (3.82, 5.1) |
6.14 (5.42, 6.87) |
8.25 (7.47, 9.03) |
9.53 (8.69, 10.37) |
9.86 (9.02, 10.7) |
10.9 (10.0, 11.8) |
12.4 (11.6, 13.2) |
|
| Age adjusted ≥20 yc | 4.55 (3.92, 5.18) |
4.50 (4.17, 4.83) |
5.96 (5.25, 6.67) |
7.91 (7.14, 8.68) |
8.52 (7.72, 9.32) |
8.64 (7.84, 9.44) |
9.73 (8.90, 10.6) |
11.0 (10.3, 11.8) |
<0.001 | |
| 20–39 y | 1.41 (0.90, 1.92) |
2.09 (0.430, 2.74) |
3.50 (2.62, 4.37) |
5.00 (3.99, 6.01) |
4.72 (3.62, 5.87) |
4.91 (3.71, 6.11) |
6.43 (5.00, 7.86) |
7.12 (5.83, 8.41) |
||
| 40–59 y | 7.03 (5.71, 8.35) |
6.37 (5.13, 7.61) |
7.11 (5.89, 8.34) |
9.71 (8.41, 11.0) |
10.6 (9.29, 11.9) |
10.8 (9.50, 12.0) |
12.4 (11.1, 13.8) |
14.0 (12.8, 15.3) |
||
| ≥60 y | 6.92 (5.02, 8.81) |
6.55 (4.72, 8.39) |
9.48 (7.5, 11.5) |
11.1 (9.17, 13.1) |
13.3 (11.3, 15.2) |
13.1 (11.3, 15.0) |
12.0 (10.3, 13.7) |
14.1 (12.5, 15.7) |
||
| ORsd | ─ | 0.990 (0.810, 1.22) |
1.34 (1.10, 1.63) |
1.36 (1.15, 1.60) |
1.08 (0.940, 1.26) |
1.02 (0.880, 1.17) |
1.14 (0.990, 1.31) |
1.15 (1.02, 1.30) |
||
| ORse | ─ | 0.990 (0.810, 1.22) |
1.33 (1.10, 1.61) |
1.80 (1.51, 2.16) |
1.96 (1.64, 2.34) |
1.99 (1.66, 2.37) |
2.26 (1.90, 2.69) |
2.59 (2.20, 3.06) |
||
| BMI ≥24 | ||||||||||
| All |
≥20 y |
19.9 (19.1, 20.8) |
21.9 (21.0, 22.78) |
26.9 (26.0, 27.9) |
33.1 (32.2, 34.1) |
36.5 (35.6, 37.6) |
37.8 (36.8, 38.8) |
40.3 (39.3, 41.3) |
45.0 (44.1, 45.8) |
|
| Age adjusted ≥20 yc | 20.5 (19.7, 21.4) |
22.1 (21.2, 23.0) |
26.7 (25.7, 27.6) |
32.5 (31.4, 33.5) |
34.8 (33.8, 35.8) |
35.8 (34.8, 36.8) |
38.2 (37.1, 39.3) |
42.3 (41.3, 43.4) |
<0.001 | |
| ORsd | ─ | 1.10 (1.02, 1.19) |
1.28 (1.19, 1.38) |
1.32 (1.24, 1.41) |
1.11 (1.04, 1.18) |
1.05 (0.980, 1.11) |
1.11 (1.04, 1.18) |
1.19 (1.12, 1.25) |
||
| ORse | ─ | 1.10 (1.02, 1.19) |
1.41 (1.31, 1.52) |
1.87 (1.74, 2.00) |
2.07 (1.93, 2.22) |
2.16 (2.02, 2.32) |
2.40 (2.24, 2.57) |
2.84 (2.66, 3.03) |
||
| Men |
≥20 y |
16.0 (14.9, 17.2) |
18.4 (17.1, 19.6) |
24.3 (23.0, 25.6) |
31.5 (30.1, 32.9) |
35.8 (34.4, 37.2) |
37.3 (35.9, 38.8) |
41.1 (39.7, 42.6) |
46.4 (45.1, 47.6) |
|
| Age adjusted ≥20 yc | 16.5 (15.4, 17.6) |
18.9 (17.3, 19.8) |
24.2 (22.9, 25.5) |
31.2 (29.7, 32.7) |
34.9 (33.5, 36.3) |
36.8 (35.3, 38.2) |
40.5 (38.8, 42.1) |
46.1 (44.5, 47.7) |
<0.001 | |
| 20–39 y | 12.3 (10.8, 13.7) |
13.6 (12.0, 15.3) |
19.8 (18.0, 21.7) |
27.4 (25.3, 29.5) |
31.0 (28.5, 33.6) |
34.1 (31.3, 36.9) |
37.1 (34.3, 40.0) |
44.1 (41.4, 46.8) |
||
| 40–59 y | 19.5 (17.4, 21.6) |
22.6 (20.4, 24.8) |
27.7 (25.5, 29.9) |
34.9 (32.7, 37.1) |
39.6 (37.5, 41.8) |
41.2 (39.0, 43.3) |
45.6 (43.5, 47.8) |
50.1 (48.3, 52.0) |
||
| ≥60 y | 20.4 (17.2, 23.6) |
22.2 (19.0, 25.4) |
27.3 (24.1, 30.5) |
32.4 (29.3, 35.6) |
34.3 (31.4, 37.3) |
33.6 (30.8, 36.4) |
37.2 (34.6, 39.9) |
42.1 (39.7, 44.4) |
||
| ORsd | ─ | 1.18 (1.05, 1.33) |
1.37 (1.23, 1.53) |
1.42 (1.29, 1.56) |
1.18 (1.08, 1.29) |
1.09 (0.990, 1.19) |
1.17 (1.07, 1.27) |
1.26 (1.16, 1.36) |
||
| ORse | ─ | 1.18 (1.05, 1.33) |
1.62 (1.45, 1.81) |
2.30 (2.07, 2.55) |
2.72 (2.44, 3.02) |
2.95 (2.66, 3.27) |
3.45 (3.11, 3.82) |
4.33 (3.92, 4.78) |
||
| Women |
≥20 y |
23.6 (22.3, 24.9) |
25.2 (23.8, 26.5) |
29.4 (28.1, 30.8) |
35.5 (34.2, 36.9) |
37.3 (35.9, 38.7) |
38.1 (36.8, 39.5) |
39.6 (38.3, 41.0) |
43.7 (42.5, 44.9) |
|
| Age adjusted ≥20 yc | 24.3 (23.0, 25.6) |
25.4 (24.0, 26.7) |
29.0 (27.6, 30.4) |
34.5 (33.0, 36.0) |
34.6 (33.3, 36.0) |
34.9 (33.6, 36.3) |
36.0 (34.5, 37.5) |
39.3 (37.9, 40.6) |
<0.001 | |
| 20–39 y | 16.9 (15.3, 18.5) |
17.7 (15.9, 19.4) |
22.1 (20.1, 24.1) |
25.2 (23.2, 27.2) |
24.1 (21.8, 26.4) |
24.5 (22.1, 26.9) |
25.5 (22.9, 28.0) |
26.3 (24.1, 28.6) |
||
| 40–59 y | 31.6 (28.8, 33.5) |
31.9 (29.5, 34.2) |
35.4 (33.1, 37.7) |
43.8 (41.7, 46.0) |
44.4 (42.3, 46.5) |
43.7 (41.7, 45.8) |
45.3 (43.2, 47.3) |
50.6 (48.9, 52.4) |
||
| ≥60 y | 27.7 (24.3, 31.0) |
30.3 (26.9, 33.8) |
32.1 (29.0, 35.3) |
37.2 (34.1, 40.2) |
39.5 (36.7, 42.4) |
41.5 (38.8, 44.3) |
41.8 (39.2, 44.4) |
46.5 (44.3, 48.8) |
||
| ORsd | ─ | 1.06 (0.960, 1.17) |
1.20 (1.09, 1.32) |
1.29 (1.18, 1.41) |
1.00 (0.920, 1.09) |
1.01 (0.930, 1.10) |
1.05 (0.970, 1.14]) |
1.15 (1.07, 1.24) |
||
| ORse | ─ | 1.06 (0.960, 1.17) |
1.27 (1.15, 1.40) |
1.64 (1.50, 1.80) |
1.65 (1.50, 1.81) |
1.67 (1.52, 1.83) |
1.75 (1.60, 1.92) |
2.02 (1.85, 2.20) |
||
Note: Boldface indicates statistical significance (p<0.001).
Calculated as weight in kilograms divided by height in meters squared.
Trends in the prevalence of obesity from 1991 to 2011 were assessed by linear-by-linear trend test.
Adjusted by the direct method to the year 2010 Census population using the age groups 20–39 years, 40–59 years, and 60 years or older.
Age-adjusted ORs based on previous year.
Age-adjusted ORs based on 1991 samples.
CHNS, China Health and Nutrition Survey.
According to WGOC criteria, the age-adjusted overall prevalence of obesity (BMI ≥28.0) approximately tripled from 3.75% (95% CI=3.44%, 4.16%) in 1991 to 11.3% (95% CI=10.8%, 11.9%) in 2011 (Table 1). In the analysis stratified by sex, the change in the age-adjusted prevalence of obesity was more striking among men than that among women (p<0.001), with an increase from 2.88% (95% CI=2.36%, 3.40%) to 11.8% (95% CI=10.8%, 12.6%) among men and from 4.55% (95% CI=3.92%, 5.18%) to 11.0% (95% CI=10.3%, 11.8%) among women. Although the prevalence among women was higher than that among men in the first six rounds of the CHNS, this trend began to reverse in the latest two rounds of the survey. In addition, the overall age-adjusted prevalence of overweight and obesity combined (BMI ≥24.0) doubled from 20.5% (95% CI=19.7%, 21.4%) in 1991 to 42.3% (95% CI=41.3%, 43.4%) in 2011. In the stratified analysis, the change in age-adjusted prevalence of overweight and obesity combined was also more pronounced among men (p<0.001), with an increase from 16.5% (95% CI=15.4%, 17.6%) to 46.1% (95% CI=44.5%, 47.7%) compared with an increase from 24.3% (95% CI=23.0%, 25.6%) to 39.3% (95% CI=37.9%, 40.6%) among women. There were constant increases in the age-adjusted prevalence of obesity overall and by sex, as well as that of overweight and obesity combined (p<0.001 for all trends) (Table 1). Similar trends for changes with a relatively lower prevalence of overweight and obesity were also observed based on WHO recommendations (p<0.001 for all trends) (Appendix Table 2, available online).
Results of the tests for trends in obesity (BMI ≥28.0) over the eight waves of the CHNS from 1991 through 2011, shown in Table 2, are expressed as age-adjusted annual change in OR, indicating the estimated increase per year in the odds of obesity prevalence. There were significant increases overall (OR=1.06, 95% CI=1.06, 1.07) and for both men (AOR=1.08, 95% CI=1.07, 1.09) and women (AOR=1.05, 95% CI=1.05, 1.06) during the 1991–2011 period. The trends of an estimated increase in OR were similar under the condition of WHO recommendations for obesity (BMI ≥30.0).
Table 2.
Estimated Annual Increase in the Odds of Obesity Prevalence by Sex: CHNS, 1991–2011
| Sex | AOR (95% CI) | p-Value |
|---|---|---|
| BMI ≥28a | ||
| Allb | 1.06 (1.06, 1.07) | <0.001 |
| Menb | 1.08 (1.07, 1.09) | <0.001 |
| Womenb | 1.05 (1.05, 1.06) | <0.001 |
| BMI ≥30 | ||
| Allb | 1.07 (1.06, 1.08) | <0.001 |
| Menb | 1.09 (1.08, 1.10) | <0.001 |
| Womenb | 1.05 (1.04, 1.06) | <0.001 |
Note: Boldface indicates statistical significance (p<0.001).
Calculated as weight in kilograms divided by height in meters squared.
Age adjusted by the direct method to the year 2010 Census population using the age groups of 20–39 years, 40–59 years, and 60 years or older.
AOR, annual change in OR; CHNS, China Health and Nutrition Survey.
In order to further disaggregate the period (1991–2011) effect, the age-specific (20 years, 30 years, and 40 years) prevalence of overweight and obesity in different periods (1991–2000, 2000–2011, and 1991–2011) were analyzed according to WGOC criteria (Figure 1). The combined prevalence of overweight and obesity increased at all three ages investigated during the three corresponding periods, with the highest increase (from 12.4% to 59.9%) in the men aged 40 years in 1991–2011 (Figure 1A). An equivalent effect was observed in women aged 30 years (from 12.9% to 32.6%, Figure 1B). When WHO recommendations were used for analysis, similar results were obtained (Appendix Figure 1, available online).
Figure 1.

Age-adjusted prevalence of obesity and overweight in men and women in 20-, 30- and 40-year old age groups over the period of 1991–2000, 2000–2011, and 1991–2011 according to the criteria suggested by the Working Group on Obesity in China.
The most recent data from the 2011 CHNS showed further increases in overweight and obesity prevalence for both men and women in all age groups. In order to explore the difference in obesity between Chinese and American adults, estimates of the prevalence of obesity between Chinese adults (2011 CHNS) and the U.S. population (NHANES 2011–2012) aged ≥20 years were compared according to WGOC criteria (Figure 2A and B). Both the estimates of the age-adjusted prevalence of obesity and overweight and obesity combined among Chinese adults (BMI ≥28.0 and BMI ≥24.0) were significantly lower than those of the U.S. population (BMI ≥30.0 and BMI ≥25.0) (all p<0.05) (Figure 2A). In addition, the ORs for obesity for the Chinese (BMI 28.0) versus U.S. population (BMI ≥30.0) were analyzed, with an OR of 0.32 (95% CI=0.30, 0.35) overall, 0.33 (95% CI=0.29, 0.37) in men, and 0.32 (95% CI=0.29, 0.36) in women (Figure 2B). The OR of overweight and obesity combined (BMI ≥24.0 and BMI ≥25.0) was 0.45 (95% CI=0.42, 0.48) overall, 0.42 (95% CI=0.31, 0.47) in men, and 0.48 (95% CI=0.44, 0.52) in women (Figure 2B). Findings based on WHO recommendations were consistent with these results (all p<0.05) (Figure 2C and D).
Figure 2.
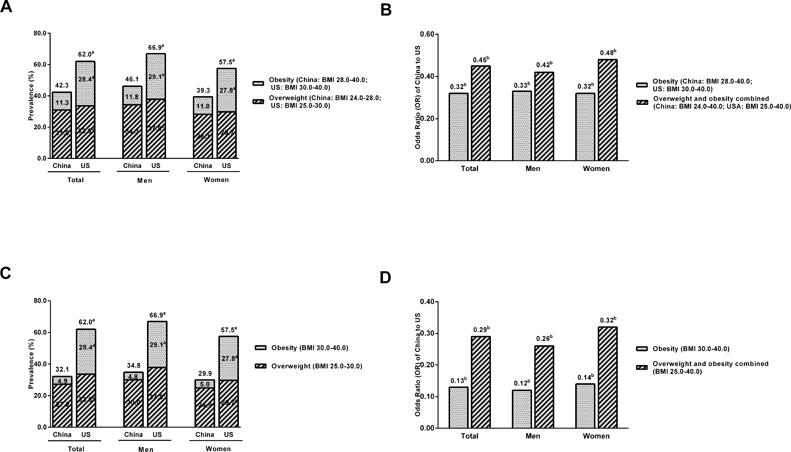
Comparison of the age-adjusted prevalence of obesity and overweight between Chinese (The China Health and Nutrition Survey in 2011) and the U.S. population (The National Health and Nutrition Examination Survey during 2011‒2012), as well as the OR of obesity and overweight status of Chinese to the U.S. *p<0.05.
In the 2011 survey, the age-adjusted mean and median BMI values were 23.8 (95% CI=23.7, 23.9) and 23.7 (interquartile range, 21.4–26.0) for men, and 23.4 (95% CI=23.2, 23.5) and 23.4 (interquartile range, 21.2–26.0) for women, respectively. Tests for trends in log-transformed mean BMI over the 20-year period from 1991 through 2011 showed significant increases in both men (p<0.01) and women (p<0.01). Trends in BMI were similar to obesity trends. Notably, the increase in the estimated median BMI was much higher in men (2.6) than in women (1.9) (p<0.05). To further describe changes in the distribution of BMI by sex and region (urban and rural), we calculated selected percentiles, with results shown graphically in Appendix Figures 2–4 (available online). For both men and women, the estimated median BMI (50th percentile) was much higher in 2011 than in 1991 within both regions. In each survey, the median BMI in urban areas was higher than that in rural areas in both men and women from 1991 through 2011; however, the increases in the median BMI in rural areas were relatively higher. The changes in the BMI distribution by age group and region (urban and rural) are shown in Appendix Figures 5–7 (available online).
We conducted sensitivity analyses for the secular trend of obesity among Chinese adults from 1991 through 2011 based on the inclusion criteria. No significant differences were observed (data not shown). These analyses suggested that the prevalence of obesity among both men and women increased significantly from 1991 through 2011.
Discussion
The present data show striking increases in the prevalence of BMI-defined obesity and overweight in adults in China over the 20-year period from 1991 through 2011 for both men and women. Remarkably, both the prevalence of obesity and the combined prevalence of overweight and obesity increased more rapidly among men than women. Meanwhile, there was a significant rising tendency in log-transformed mean BMI from 1991 through 2011 both for men and women. Notably, the changes of BMI in men were particularly pronounced compared with those in women.
Because of differences in sampling, study design, and cut off points for obesity and overweight status, it is challenging to make international comparisons of obesity and BMI. However, for estimates based on measured data, the prevalence of obesity among the Chinese population is significantly lower compared with the U.S. population, but the prevalence of overweight among the Chinese population is much closer to that among the U.S. population.19 Although the obesity prevalence does not seem to be outstanding compared with that of the U.S., the net population of obesity among the Chinese is nearly the highest in the world.20 NHANES data for the U.S. population showed that it took almost 40 years for the obesity prevalence to reach a stable state, covering the 1960–2000 period.19,21 If the prevalence of obesity among the Chinese population reaches a stable status as in the U.S. population, it will continue to increase over the next few years. In other words, if the increase in obesity continues without any effective interventions, China will follow in the footsteps of the U.S. into an obesity crisis.19,22
This study indicates that increases in body weight are continuing, especially among men, which is in accordance with previous studies.9,10,23–25 However, Wang and colleagues9 only focused on analyzing participants aged 20–45 years from 1989 to 2000. As the population in our analysis was aged ≥20 years data from 1991 through 2011, our study is more representative of the current population. Additionally, Wang et al. mainly reported trends in the distribution of BMI, but our study is more comprehensive as it includes both the prevalence of obesity and trends in the BMI distribution. Further, people in China, as well as several other Asian Pacific populations, have a higher risk for obesity-related diseases at a lower BMI than Caucasians,18,26–29 thus our analysis provides estimates of prevalence based on the lower BMI cut off points.18 The findings of an elevated prevalence of obesity and overweight are consistent with those from previous studies on obesity defined by BMI with a more rigorous cut off point.9,24,25,30
In this study, a dramatic increase in the prevalence of overweight and obesity was observed among Chinese adults from 1991 through 2011. This increase occurred among men and women in all studied age groups. The presented estimates offer a realistic picture of overweight and obesity prevalence in China, which is helpful for predicting trends in their changes. In past three decades, peoples’ lifestyles have changed greatly in China. The increased use of motorized transportation,31 consumption of high-fat food, and greater TV viewing time32 have been considered contributors to the increased obesity prevalence. Given the current prevalence of overweight, the large population, and other chronic diseases,33–36 China is facing the consequences of obesity-related health problems.37–41 The magnitude of the increases in the prevalence of overweight and obesity foretell a substantial increase in chronic diseases in the next several decades. These data call for immediate measures of weight control and prevention programs for overweight and obesity among Chinese adults to prevent chronic disease epidemics and deleterious obesity-related health outcomes.
Limitations and Strengths
In past three decades, increasingly more people have moved from rural areas to cities in China. We included data from participants from three large cities to mirror the changes in urbanization. More than 20 years of coverage enables us to study the impact of time on the prevalence of overweight and obesity. The analysis comparing the prevalence of overweight and obesity in China and the U.S. will help us understand the differences between developing and developed countries. There are limitations in this study. The studied population was from only a portion of China, thus caution should be taken when generalizing the results and conclusion as a reflection the national condition. Risk factors and their impact on the increase of overweight and obesity should be analyzed in a future study.
Conclusions
The prevalence of overweight and obesity among both Chinese men and women increased significantly from 1991 through 2011. These estimates suggest that the increases in body weight are continuing, particularly among men.
Supplementary Material
Acknowledgments
This research uses data from China Health and Nutrition Survey (CHNS). We thank the National Institute of Nutrition and Food Safety, China Center for Disease Control and Prevention, Carolina Population Center (5 R24 HD050924), University of North Carolina at Chapel Hill, NIH (R01-HD30880, DK056350, R24 HD050924, and R01-HD38700), and Fogarty International Center, NIH for financial support for the CHNS data collection and analysis files from 1989 to 2011 and future surveys, and the China-Japan Friendship Hospital, Ministry of Health for support for CHNS 2009.
Footnotes
The first two authors should be regarded as joint first authors.
No financial disclosures were reported by the authors of this paper.
References
- 1.Welty TK. Health implications of obesity in American Indians and Alaska Natives. Am J Clin Nutr. 1991;53(6 suppl):1616S–1620S. doi: 10.1093/ajcn/53.6.1616S. [DOI] [PubMed] [Google Scholar]
- 2.Must A, Spadano J, Coakley EH, Field AE, Colditz G, Dietz WH. The disease burden associated with overweight and obesity. J Am Med Assoc. 1999;282(16):1523–1529. doi: 10.1001/jama.282.16.1523. http://dx.doi.org/10.1001/jama.282.16.1523. [DOI] [PubMed] [Google Scholar]
- 3.Lee ZS, Critchley JA, Chan JC, et al. Obesity is the key determinant of cardiovascular risk factors in the Hong Kong Chinese population: cross-sectional clinic-based study. Hong Kong Med J. 2000;6(1):13–23. [PubMed] [Google Scholar]
- 4.Hu FB, Wang B, Chen C, et al. Body mass index and cardiovascular risk factors in a rural Chinese population. Am J Epidemiol. 2000;151(1):88–97. doi: 10.1093/oxfordjournals.aje.a010127. http://dx.doi.org/10.1093/oxfordjournals.aje.a010127. [DOI] [PubMed] [Google Scholar]
- 5.Stoll BA. Adiposity as a risk determinant for postmenopausal breast cancer. Int J Obes Relat Metab Disord. 2000;24(5):527–533. doi: 10.1038/sj.ijo.0801247. http://dx.doi.org/10.1038/sj.ijo.0801247. [DOI] [PubMed] [Google Scholar]
- 6.Ahn S, Zhao H, Smith ML, Ory MG, Phillips CD. BMI and lifestyle changes as correlates to changes in self-reported diagnosis of hypertension among older Chinese adults. J Am Soc Hypertens. 2011;5(1):21–30. doi: 10.1016/j.jash.2010.12.001. http://dx.doi.org/10.1016/j.jash.2010.12.001. [DOI] [PubMed] [Google Scholar]
- 7.Bell AC, Ge K, Popkin BM. Weight gain and its predictors in Chinese adults. Int J Obes Relat Metab Disord. 2001;25(7):1079–1086. doi: 10.1038/sj.ijo.0801651. http://dx.doi.org/10.1038/sj.ijo.0801651. [DOI] [PubMed] [Google Scholar]
- 8.Du S, Lu B, Zhai F, Popkin BM. A new stage of the nutrition transition in China. Public Health Nutr. 2002;5(1A):169–174. doi: 10.1079/PHN2001290. http://dx.doi.org/10.1079/PHN2001290. [DOI] [PubMed] [Google Scholar]
- 9.Wang H, Du S, Zhai F, Popkin BM. Trends in the distribution of body mass index among Chinese adults, aged 20–45 years (1989–2000) Int J Obes (Lond) 2007;31(2):272–278. doi: 10.1038/sj.ijo.0803416. http://dx.doi.org/10.1038/sj.ijo.0803416. [DOI] [PubMed] [Google Scholar]
- 10.Gu DF, Huang GY, Wu XG, Duan XF. Relationship between body mass index and major cardiovascular diseases in Chinese population. Nat l Med J China. 2002;15:13–16. [PubMed] [Google Scholar]
- 11.Du T, Sun X, Yin P, Huo R, Ni C, Yu X. Increasing trends in central obesity among Chinese adults with normal body mass index, 1993–2009. BMC Public Health. 2013;13:327. doi: 10.1186/1471-2458-13-327. http://dx.doi.org/10.1186/1471-2458-13-327. [DOI] [PMC free article] [PubMed] [Google Scholar]
- 12.Wang H, Zhai F, Du SF, Wang ZH, He YN, Yu WT. Trend of distribution of body mass index among Chinese adults in some provinces from 1989 to 2000. Wei Sheng Yan Jiu. 2006;6:794–797. [PubMed] [Google Scholar]
- 13.Zhang B, Zhai FY, Du SF, Popkin BM. The china health and nutrition survey, 1989–2011. Obes Rev. 2014;15(suppl 1):2–7. doi: 10.1111/obr.12119. http://dx.doi.org/10.1111/obr.12119. [DOI] [PMC free article] [PubMed] [Google Scholar]
- 14.CHNS. China Health and Nutrition Survey. www.cpc.unc.edu/projects/china. Accessed on 10/12/2013.
- 15.Popkin BM, Du S, Zhai F, Zhang B. Cohort Profile: The China Health and Nutrition Survey–monitoring and understanding socio-economic and health change in China, 1989–2011. Int J Epidemiol. 2010;39(6):1435–1440. doi: 10.1093/ije/dyp322. http://dx.doi.org/10.1093/ije/dyp322. [DOI] [PMC free article] [PubMed] [Google Scholar]
- 16.WHO Expert Committee on Physical Status. Physical Status: The Use and Interpretation of Anthropometry: Report of a WHO Expert Committee. Geneva: World Health Organization; 1995. (WHO Technical Report Series No. 854). [PubMed] [Google Scholar]
- 17.Chobanian AV, Bakris GL, Black HR, et al. The Seventh Report of the Joint National Committee on Prevention, Detection, Evaluation, and Treatment of High Blood Pressure: the JNC 7 report. J Am Med Assoc. 2003;289(19):2560–2572. doi: 10.1001/jama.289.19.2560. http://dx.doi.org/10.1001/jama.289.19.2560. [DOI] [PubMed] [Google Scholar]
- 18.Zhou BF. Predictive values of body mass index and waist circumference for risk factors of certain related diseases in Chinese adults─study on optimal cut-off points of body mass index and waist circumference in Chinese adults. Biomed Environ Sci. 2002;15(1):83–96. [PubMed] [Google Scholar]
- 19.Flegal KM, Carroll MD, Kit BK, Ogden CL. Prevalence of obesity and trends in the distribution of body mass index among U.S. adults, 1999–2010. J Am Med Assoc. 2012;307(5):491–497. doi: 10.1001/jama.2012.39. http://dx.doi.org/10.1001/jama.2012.39. [DOI] [PubMed] [Google Scholar]
- 20.Ni GH, Zhang J, Zheng FT. The status and trend of obesity in China. Food Nutr China. 2013;10:70–74. [Google Scholar]
- 21.Flegal KM, Carroll MD, Ogden CL, Johnson CL. Prevalence and trends in obesity among U.S. adults, 1999–2000. J Am Med Assoc. 2002;288(14):1723–1727. doi: 10.1001/jama.288.14.1723. http://dx.doi.org/10.1001/jama.288.14.1723. [DOI] [PubMed] [Google Scholar]
- 22.Ogden CL, Carroll MD, Curtin LR, McDowell MA, Tabak CJ, Flegal KM. Prevalence of overweight and obesity in the United States, 1999–2004. J Am Med Assoc. 2006;295(13):1549–1555. doi: 10.1001/jama.295.13.1549. http://dx.doi.org/10.1001/jama.295.13.1549. [DOI] [PubMed] [Google Scholar]
- 23.Xi B, Liang Y, He T, et al. Secular trends in the prevalence of general and abdominal obesity among Chinese adults, 1993–2009. Obes Rev. 2012;13(3):287–296. doi: 10.1111/j.1467-789X.2011.00944.x. http://dx.doi.org/10.1111/j.1467-789X.2011.00944.x. [DOI] [PMC free article] [PubMed] [Google Scholar]
- 24.Wildman RP, Gu D, Muntner P, et al. Trends in overweight and obesity in Chinese adults: between 1991 and 1999–2000. Obesity (Silver Spring) 2008;16(6):1448–1453. doi: 10.1038/oby.2008.208. http://dx.doi.org/10.1038/oby.2008.208. [DOI] [PubMed] [Google Scholar]
- 25.Dearth-Wesley T, Wang H, Popkin BM. Under- and overnutrition dynamics in Chinese children and adults (1991–2004) Eur J Clin Nutr. 2008;62(11):1302–1307. doi: 10.1038/sj.ejcn.1602853. http://dx.doi.org/10.1038/sj.ejcn.1602853. [DOI] [PubMed] [Google Scholar]
- 26.Deurenberg-Yap M, Deurenberg P. Is a re-evaluation of WHO body mass index cut-off values needed? The case of Asians in Singapore. Nutr Rev. 2003;61(5 Pt 2):S80–S87. doi: 10.1301/nr.2003.may.S80-S87. http://dx.doi.org/10.1301/nr.2003.may.S80-S87. [DOI] [PubMed] [Google Scholar]
- 27.Misra A. Revisions of cutoffs of body mass index to define overweight and obesity are needed for the Asian-ethnic groups. Int J Obes Relat Metab Disord. 2003;27(11):1294–1296. doi: 10.1038/sj.ijo.0802412. http://dx.doi.org/10.1038/sj.ijo.0802412. [DOI] [PubMed] [Google Scholar]
- 28.WHO Expert Consultation. Appropriate body-mass index for Asian populations and its implications for policy and intervention strategies. Lancet. 2004;363(9403):157–163. doi: 10.1016/S0140-6736(03)15268-3. http://dx.doi.org/10.1016/S0140-6736(03)15268-3. [DOI] [PubMed] [Google Scholar]
- 29.Weisell RC. Body mass index as an indicator of obesity. Asia Pac J Clin Nutr. 2002;11(suppl 8):S681–S684. http://dx.doi.org/10.1046/j.1440-6047.11.s8.5.x. [Google Scholar]
- 30.Jones-Smith JC, Gordon-Larsen P, Siddiqi A, Popkin BM. Emerging disparities in overweight by educational attainment in Chinese adults (1989–2006) Int J Obes (Lond) 2012;36(6):866–875. doi: 10.1038/ijo.2011.134. http://dx.doi.org/10.1038/ijo.2011.134. [DOI] [PMC free article] [PubMed] [Google Scholar]
- 31.Bell AC, Ge K, Popkin BM. The road to obesity or the path to prevention: motorized transportation and obesity in China. Obes Res. 2002;10(4):277–283. doi: 10.1038/oby.2002.38. http://dx.doi.org/10.1038/oby.2002.38. [DOI] [PubMed] [Google Scholar]
- 32.Parvanta SA, Brown JD, Du S, Zimmer CR, Zhao X, Zhai F. Television use and snacking behaviors among children and adolescents in China. J Adolesc Health. 2010;46(4):339–345. doi: 10.1016/j.jadohealth.2009.08.002. http://dx.doi.org/10.1016/j.jadohealth.2009.08.002. [DOI] [PMC free article] [PubMed] [Google Scholar]
- 33.Haghighatdoost F, Sarrafzadegan N, Mohammadifard N, Asgary S, Boshtam M, Azadbakht L. Assessing body shape index as a risk predictor for cardiovascular diseases and metabolic syndrome among Iranian adults. Nutrition. 2014;30(6):636–644. doi: 10.1016/j.nut.2013.10.021. http://dx.doi.org/10.1016/j.nut.2013.10.021. [DOI] [PubMed] [Google Scholar]
- 34.Zhao W, Zhai Y, Hu J, et al. Economic burden of obesity-related chronic diseases in Mainland China. Obes Rev. 2008;9(suppl 1):62–67. doi: 10.1111/j.1467-789X.2007.00440.x. http://dx.doi.org/10.1111/j.1467-789X.2007.00440.x. [DOI] [PubMed] [Google Scholar]
- 35.Hu Y, He L, Wu Y, Ma G, Li L. Familial correlation and aggregation of body mass index and blood pressure in Chinese Han population. BMC Public Health. 2013;13(1):686. doi: 10.1186/1471-2458-13-686. http://dx.doi.org/10.1186/1471-2458-13-686. [DOI] [PMC free article] [PubMed] [Google Scholar]
- 36.Hossain P, Kawar B, El Nahas M. Obesity and diabetes in the developing world─a growing challenge. N Engl J Med. 2007;356(3):213–215. doi: 10.1056/NEJMp068177. http://dx.doi.org/10.1056/NEJMp068177. [DOI] [PubMed] [Google Scholar]
- 37.Liang J, Matheson BE, Kaye WH, Boutelle KN. Neurocognitive correlates of obesity and obesity-related behaviors in children and adolescents. Int J Obes (Lond) 2014;38(4):494–506. doi: 10.1038/ijo.2013.142. http://dx.doi.org/10.1038/ijo.2013.142. [DOI] [PMC free article] [PubMed] [Google Scholar]
- 38.Reiter RJ, Tan DX, Korkmaz A, Ma S. Obesity and metabolic syndrome: association with chronodisruption, sleep deprivation, and melatonin suppression. Ann Med. 2012;44(6):564–577. doi: 10.3109/07853890.2011.586365. http://dx.doi.org/10.3109/07853890.2011.586365. [DOI] [PubMed] [Google Scholar]
- 39.Kim CH, Park HS, Park M, Kim H, Kim C. Optimal cutoffs of percentage body fat for predicting obesity-related cardiovascular disease risk factors in Korean adults. Am J Clin Nutr. 2011;94(1):34–39. doi: 10.3945/ajcn.110.001867. http://dx.doi.org/10.3945/ajcn.110.001867. [DOI] [PubMed] [Google Scholar]
- 40.Popkin BM. Is the obesity epidemic a national security issue around the globe? Curr Opin Endocrinol Diabetes Obes. 2011;18(5):328–331. doi: 10.1097/MED.0b013e3283471c74. http://dx.doi.org/10.1097/MED.0b013e3283471c74. [DOI] [PMC free article] [PubMed] [Google Scholar]
- 41.McAtee M, Personett RJ. Obesity-related risks and prevention strategies for critically ill adults. Crit Care Nurs Clin North Am. 2009;21(3):391–401. vii. doi: 10.1016/j.ccell.2009.07.006. http://dx.doi.org/10.1016/j.ccell.2009.07.006. [DOI] [PubMed] [Google Scholar]
Associated Data
This section collects any data citations, data availability statements, or supplementary materials included in this article.