Abstract
The population genetic study of divergence is often done using a Bayesian genealogy sampler, like those implemented in IMa2 and related programs, and these analyses frequently include a likelihood-ratio test of the null hypothesis of no migration between populations. Cruickshank and Hahn (2014, Molecular Ecology, 23, 3133–3157) recently reported a high rate of false positive test results with IMa2 for data simulated with small numbers of loci under models with no migration and recent splitting times. We confirm these findings and discover that they are caused by a failure of the assumptions underlying likelihood ratio tests that arises when using marginal likelihoods for a subset of model parameters. We also show that for small data sets, with little divergence between samples from two populations, an excellent fit can often be found by a model with a low migration rate and recent splitting time and a model with a high migration rate and a deep splitting time.
Keywords: Isolation with Migration, divergence, gene flow, false positive
Introduction
Isolation with Migration (IM) models are widely used in the genetic study of divergence precisely because they incorporate the two main demographic factors thought to contribute to divergence. These are the separation of populations at some time (larger times are associated with more divergence) and gene migration (higher rates are associated with less divergence). Investigators are also often interested in testing the null hypothesis that the migration rate between diverged populations is zero. A statistical conclusion of a non-zero migration rate can be of considerable interest as it may be taken as indirect evidence that natural selection is contributing to the divergence process (Pinho & Hey 2010).
Recently Cruikshank and Hahn (2014), hereafter C&H, in a paper on the pitfalls of interpreting the causes of variation in a genome scan, reported that the widely used IMa2 program (Hey 2010) returned high false positive rates for tests of gene flow under some circumstances.
IMa2 is descended from a method developed by Nielsen and Wakeley (2001) for estimating the parameters of an IM model using the Markov chain Monte Carlo (MCMC) approach of Wilson and Balding (1998) in which both genealogies and demographic model parameters are included in the state space of the simulation. Although the method is Bayesian, in the special case of a uniform prior distribution the posterior probabilities of model parameters are proportional to the likelihood, and the original method and subsequent related methods have made use of this for the purpose of likelihood ratio tests. Specifically Nielsen and Wakeley (2001) proposed a log likelihood ratio (LLR) test of the null hypothesis that the migration rate is equal to zero, and this test is included in IMa2 and was used by C&H. The performance of the IMa2 program (and its predecessors) has been examined and been found to provide generally accurate estimates, particularly when the underlying assumptions of the method apply (Becquet & Przeworski 2009; Hey 2010; Hey & Nielsen 2004; Hey & Nielsen 2007; Naduvilezhath et al. 2011; Strasburg & Rieseberg 2010), however performance had not been well examined for models that lead to low divergence.
C&H simulated data sets with no migration and with varying numbers of loci and varying times of population isolation, and found that the rate of rejection of a zero migration rate was substantially higher than the expected frequency of false positives (i.e. 0.05) for data sets with small numbers of loci (<=10) and recent divergence times (< Ne generations, where Ne is the effective population size of each of the populations). Using the protocol described by C&H for simulating data sets, as well as details on the prior distributions which were provided upon request, we observed the same high false positive rates. Importantly, under the parameters ranges studied by C&H, we observed high false positive rates using both the original test of Nielsen and Wakeley (2001), and the tests proposed by Hey and Nielsen (2007) that are based on the join distribution of population size and migration rate parameters.
In this paper we reproduce by simulation the false positive results reported by C&H, and we take a detailed look to uncover some of the likely causes. We also explore more generally the difficulty of working with small data sets that show low divergence.
Methods
Working with a simplified model
Typically an IM model has six parameters, including population mutation rates for two sampled populations and their ancestor (θ1, θ2 and θA), migration rates in each direction (m1→2 and m2→1), and a splitting time t. To simplify the analysis and presentation we focus here on a reduced IM model in which all three populations (both descendant populations and the ancestral population) have the same population size, and in which the migration rates in both directions are equal. This model has just three parameters: a population size, θ, a migration rate, m, and a splitting time, t.
Under the method of Nielsen and Wakeley (2001), it is possible to approximate a distribution that is proportional to the likelihood for a data set X for any particular model parameter by constructing a histogram of values of that parameter that are sampled from an MCMC simulation. In the case of, m, Nielsen and Wakeley proposed that the estimate of the likelihood, p(X|m), be used to conduct a likelihood ratio test of the null hypothesis that the migration rate is zero. For this type of test, with a parameter fixed at a boundary value, the test statistic, Λ = −2 log(Lmax(X|m = 0)/Lmax(X|m)), has an asymptotic distribution that takes a value of 0 with probability 0.5 and a value from the distribution with probability 0.5 (Chernoff 1954).
With the development of IMa and IMa2 it became possible to conduct likelihood ratio tests on joint distributions for population size and migration parameters (θ and m), with a likelihood ratio test value of Λ = −2 log(Lmax(X|θ, m = 0)/Lmax(X|θ, m)). However these tests, like those under the original method of Nielsen and Wakeley, use densities that are not full joint distributions, but rather use marginal densities found by integrating out t. All of these tests, including those using IMa and IMa2 and the original tests of Nielsen and Wakeley (2001) as implemented in the IM program (Hey & Nielsen 2004), exhibit high false positive rates for migration with small data sets when the true model has a small value for t.
To see how the use of marginal densities may contribute to the high false positive rates, we used the original IM program to generate full joint density estimates (i.e. three dimensional histograms) in order to approximate a test value that does not require integration over any model parameters, i.e. Λ = −2log(Lmax(X|t, θ, m = 0)/Lmax(X|t, θ, m)).
Simulations
One hundred data sets were simulated using the ms program (Hudson 2002), each with two loci, and with parameter values: θ = 4Nu = 5, m = 0, t = 0.5 (following the parameterization as outlined in Hey & Nielsen (2004)). These values were suggested by T. Cruickshank (pers. comm.) and are representative of the circumstances that cause a high false positive rate. Each data set was analyzed using the IM program under a three parameter model. A large sample of parameter values were collected so as to well populate a histogram in 3 dimensions with 200 bins on each axis. These runs were done with an upper bound of 10 for each of the three parameters, and fifty Metropolis-Coupled chains were used to help ensure good mixing of the Markov chain simulation. Additional simulations were done using ms for estimating the allele frequency spectrum (AFS) and for estimating the distribution of Φst, an Fst analog for DNA sequence data (Excoffier et al. 1992). For Φst calculations the sequences for each individual gene copy were concatenated across loci to form a single sequence for each.
Results and Discussion
The circumstances under which high false positive rates for tests of migration occur are those in which: (1) the data set, in terms of numbers of loci and numbers of gene copies per locus, is small; and (2) the true demographic model is one that generates very little signal of divergence in the data (Cruickshank & Hahn 2014). These circumstances, denoted here as Small Data, Low Divergence (SDLD), present several challenges for Isolation with migration analyses.
Estimator Bias
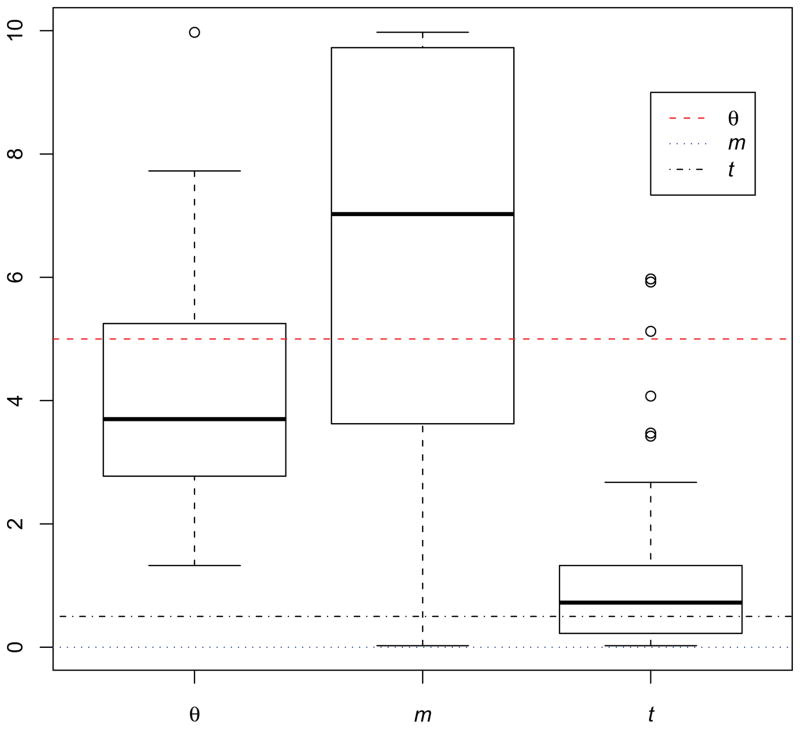
The means of the parameter estimates from 100 simulated data sets were θ̄ = 4.19, m̄ = 6.3 and t̄ = 1.1, which can be compared to the true values: θ = 5, m = 0 and t = 0.5. The ranges of values for the MLEs for each of the parameters are shown in Figure 1. The distributions of estimates for each parameter showed a wide variance, however in the case of m, the estimator appears to be strongly biased. Only 14 of the 100 data sets returned an estimated value in the lowest bin of the histogram (corresponding to m̄ = 0.025), and the large majority of the estimates where far from the true value.
Figure 1.
Box plots of estimates of θ, m and t for 100 simulated data sets. In each panel the boxed area includes the interquartile range (IQR) from the first to the third quartiles, with the black thick line showing the median value. Whiskers indicate 1.5 IQR away from either the lower and upper quantiles, with outliers shown using circles. Dotted colored lines show the true values used for the simulations.
False Positive Tests Resulting from Marginal Densities
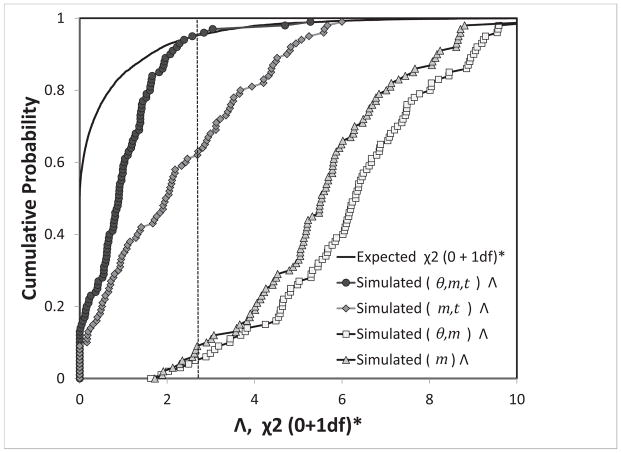
Figure 2 shows the cumulative distribution of likelihood ratio statistic Λ for 100 data sets for the full joint density, as well as for the marginal densities when t and θ, or both, are integrated out. Also shown is the expected asymptotic distribution for the test statistic. Under this distribution the 95% cutoff value (i.e. the value above which the cumulative probability is 0.05) is 2.71.
Figure 2.
The cumulative distribution of the likelihood ratio statistic. Shown are the theoretical expectation for the case with one model parameter fixed at a specific value (i.e. m = 0), and values estimated from histograms for 100 data sets under a three parameter model, as described in the text. Values of the cumulative distribution of Λ are shown for the full joint likelihood surface, and for marginal distributions where one or two model parameters are integrated out. The critical value for p = 0.05 is 2.71, and is shown as a vertical dotted line.
For both the 1- and 2- dimensional marginal densities, the distribution for Λ shows much less skew, and is shifted far to the right, relative to the expected distribution. Particularly when t is integrated out, the large majority of simulations result in a test value that would reject the null model of no migration. However for the full joint distribution, the distribution is much closer to the expected distribution, particularly in the upper tail, and the overall rate of rejection of the null model was 4 out of 100, i.e. quite close the expected number of 5 for the target false positive rate of 0.05.
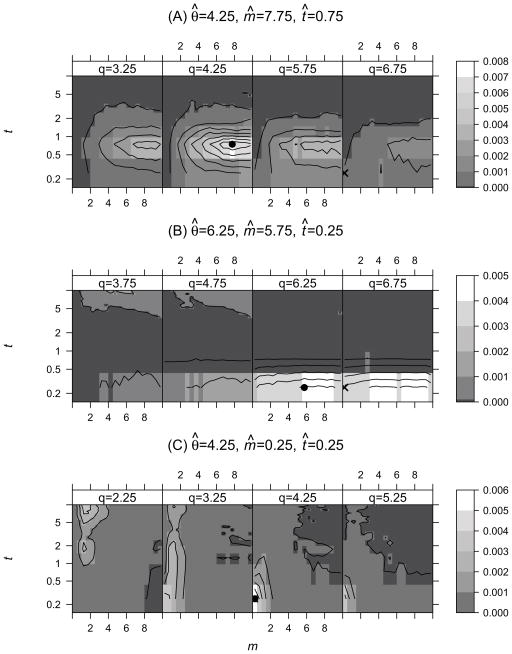
To help envision the actual shape of these joint densities, contour plots for three representative data sets are shown in Figure 3. Panel A shows a case when the test using the full model {θ, m, t} rejected the null hypothesis m = 0, and the MLEs under the two models differed considerably. Panels B and C show cases when the null model was not rejected. For tests based on marginal distributions {θ, m}, {m, t} and {m}, all three data sets shown in Figure 3 rejected the null hypothesis of no migration.
Figure 3.
Contour plots of p(θ, m, t|X) (proportional to the likelihood) for three representative data sets, with variation along the axis for θ shown as a series of four panels, each of which shows densities over m and t for a given value of θ. The Maximum likelihood estimate (MLE) under the null hypothesis (m = 0) is marked as × and the MLE under the alternative hypothesis is marked as ●. (A) A case where the null hypothesis was rejected (Λ = 5.27) and the MLEs under the two models differ considerably for all three parameters. (B) The MLE under the alternative model has a high estimate of the migration rate (m̄ = 5.75), however the null model is not rejected (Λ = 0.25). (C) The MLEs are the same for the two models (Λ = 0) and the null model is not rejected.
In theory the density of the likelihood ratio statistic will approach the asymptotic distribution when the null model is true and the data set consists of many independent and identically distributed (IID) values (Wilks 1938). In the case of a data set of multiple DNA sequences from a single locus, the IID assumption is not met because the sequences share an underlying genealogical history. However data sets from multiple unlinked loci are IID, and it has been shown for some models with six loci that the distribution of the likelihood ratio statistic does converge to the expected chi-square distribution when using a marginal density (Hey & Nielsen 2007). The fact that marginal likelihood surfaces present distributions that are far from the asymptotic distribution (Figure 2) suggests that there are strong nonlinear correlations in the joint surface (Figure 3). In addition the act of integrating over one or more parameters, to generate a marginal likelihood surface, will cause the data from different unlinked loci to not make independent contributions to the likelihood surface, in violation of the IID assumption of likelihood ratio tests.
Very different models can give rise to data showing low divergence
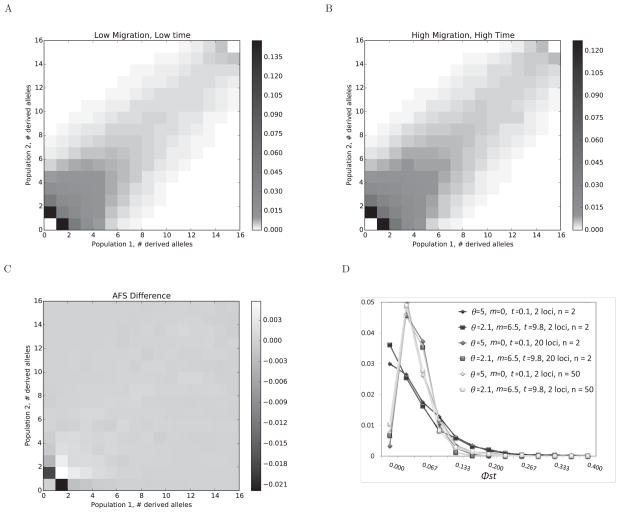
When the true migration rates are at or near zero and the splitting time is recent, the actual divergence between the samples from two populations is expected to be slight. To visualize the patterns of divergence that arise under the different kinds of models estimated in the SDLD context, we calculated widely used summaries of variation and divergence for a representative data set from among those used to generated Figures 1–3, for which the true values were: θ = 5, m = 0, t = 0.5. The selected data set exhibited a false positive likelihood ratio test for migration in marginal models and had an estimated model far from the true value: θ̂ = 2.1, m̂ = 6.5, t̂ = 9.8. Figure 4A shows the expected 2-dimensional AFS simulated under the true parameter values and Figure 4B shows the expected AFS for the estimated parameters. Figure 4C shows the difference between the two AFSs, which are very slight except for the frequency classes for a single sampled derived allele in one of the populations.
Figure 4.
Summary statistics for a data set that generates false positive results for tests of zero migration. A. The two population AFS based on 10,000 independent data sets, simulated for the true values: = 5, m = 0, t = 0.1. B. Simulated AFS under the estimated values: θ̂ = 2.1, m̂ = 6.5, t̂ = 9.8. C. The difference between the two AFSs. D. Histograms of Φst values for 1000 data sets simulated under true and estimated parameter sets for 2 or 20 loci, and for 15 or 50 gene copies sampled per population.
We also estimated divergence using Φst (Excoffier et al. 1992) for data sets simulated under these two parameters sets. Figure 4D shows the histograms for 10,000 simulated data sets of two loci and of 20 loci, each for 15 gene copies (n=15) per population, and for two loci with n=50 per population. In the case of two loci and n=15, the most common Φst value is zero for both parameter sets (low migration and small divergence time, and high migration and large divergence time) indicating that by chance data sets of this size under these models often show no sign of divergence by this measure. In fact for the particular data set used to generate the estimated parameter values for this figure, Φst=0. For data sets of 20 loci, or for data sets of 2 loci but with 50 gene copies per population, the distributions were very similar, with positive modal values for Φst.
Challenges of model estimation with SDLD data
SDLD data present a number of challenges when trying to estimate parameters and conduct likelihood ratio tests. The primary difficulty is that because both migration and splitting time are low, the actual signal in the data used to discern m and t is expected to be small. Furthermore because the data set is small, the data can easily, by chance, show little or no sign of divergence. A second set of challenges arise because of the failures of the assumptions of likelihood ratio tests, as shown in Figures 2 and 3. An additional difficulty, not explored here but that deserves mention, is that the likelihood surfaces that arise with these data can present challenges in finding the highest point in the surface. When a data set is quite small, and the prior distribution is broad and flat, the data does not dominate the prior and the state space of the MCMC simulation is explored relatively uniformly. The effect of this under MCMC is that the simulation must explore the entire state space relatively evenly, and because the genealogies in the MCMC simulation change slowly, the time needed to obtain a large sample of nearly independent samples from the state space can be very great. Thus even though the data set is small, the combination of low divergence and very wide priors creates a challenging mixing problem for an MCMC-based genealogy sampler. Investigators who do not realize this may inadvertently use too short a burning-in period, or an insufficiently short sampling run, and take a poor sample. And that sample may in turn not be sufficient to approximate the true posterior density, leading to false conclusions.
Recommendations
Investigators working with a small number of loci and data that shows little divergence (e.g. estimates of Fst at or near zero) can expect a high rate of false positives when conducting likelihood ratio tests using marginal distributions. Importantly the SDLD context is also one in which even accurate tests of migration are expected to have little statistical power.
The ideal solution to the problem that arises with marginal distributions is to use the joint distribution for all model parameters, including population sizes, migration rates and splitting time. For this study this was feasible because we used a reduced three parameter model, however a full IM model with six parameters, is much harder to put to the test because of the need for much larger samples (i.e. as needed to fill a histogram in six dimensions).
Acknowledgments
This research was supported by NIH grant R01GM078204 to JH.
Footnotes
Data Accessibility:
Simulated data sets and files output by the IM program: Dryad doi:10.5061/dryad.ts3t7
References
- Becquet C, Przeworski M. Learning about modes of speciation by computational approaches. Evolution. 2009;63:2547–2562. doi: 10.1111/j.1558-5646.2009.00662.x. [DOI] [PubMed] [Google Scholar]
- Chernoff H. On the distribution of the likelihood ratio. The Annals of Mathematical Statistics. 1954;25:573–578. [Google Scholar]
- Cruickshank TE, Hahn MW. Reanalysis suggests that genomic islands of speciation are due to reduced diversity, not reduced gene flow. Molecular Ecology. 2014;23:3133–3157. doi: 10.1111/mec.12796. [DOI] [PubMed] [Google Scholar]
- Excoffier L, Smouse PE, Quattro JM. Analysis of molecular variance inferred from metric distances among DNA haplotypes: applications to human mitochondiral DNA restriction data. Genetics. 1992;131:479–491. doi: 10.1093/genetics/131.2.479. [DOI] [PMC free article] [PubMed] [Google Scholar]
- Hey J. Isolation with Migration Models for More Than Two Populations. Mol Biol Evol. 2010;27:905–920. doi: 10.1093/molbev/msp296. [DOI] [PMC free article] [PubMed] [Google Scholar]
- Hey J, Nielsen R. Multilocus methods for estimating population sizes, migration rates and divergence time, with applications to the divergence of Drosophila pseudoobscura and D. persimilis. Genetics. 2004;167:747–760. doi: 10.1534/genetics.103.024182. [DOI] [PMC free article] [PubMed] [Google Scholar]
- Hey J, Nielsen R. Integration within the Felsenstein equation for improved Markov chain Monte Carlo methods in population genetics. Proceedings of the National Academy of Sciences of the United States of America. 2007;104:2785–2790. doi: 10.1073/pnas.0611164104. [DOI] [PMC free article] [PubMed] [Google Scholar]
- Hudson RR. Generating samples under a Wright-Fisher neutral model of genetic variation. Bioinformatics. 2002;18:337–338. doi: 10.1093/bioinformatics/18.2.337. [DOI] [PubMed] [Google Scholar]
- Naduvilezhath L, Rose LE, Metzler D. Jaatha: a fast composite-likelihood approach to estimate demographic parameters. Molecular Ecology. 2011;20:2709–2723. doi: 10.1111/j.1365-294X.2011.05131.x. [DOI] [PubMed] [Google Scholar]
- Nielsen R, Wakeley J. Distinguishing migration from isolation. A Markov chain Monte Carlo approach. Genetics. 2001;158:885–896. doi: 10.1093/genetics/158.2.885. [DOI] [PMC free article] [PubMed] [Google Scholar]
- Pinho C, Hey J. Divergence with Gene Flow: Models and Data. Annual Review of Ecology, Evolution, and Systematics. 2010;41:215–230. [Google Scholar]
- Strasburg JL, Rieseberg LH. How Robust Are “Isolation with Migration” Analyses to Violations of the IM Model? A Simulation Study. Mol Biol Evol. 2010;27:297–310. doi: 10.1093/molbev/msp233. [DOI] [PMC free article] [PubMed] [Google Scholar]
- Wilks SS. The large-sample distribution of the likelihood ratio for testing composite hypotheses. The Annals of Mathematical Statistics. 1938;9:60–62. [Google Scholar]
- Wilson IJ, Balding DJ. Genealogical inference from microsatellite data. Genetics. 1998;150:499–510. doi: 10.1093/genetics/150.1.499. [DOI] [PMC free article] [PubMed] [Google Scholar]


