

Abstract
Background
The benefits of healthy habits are well-established, but it is unclear whether making health behavior changes as an adult can still alter coronary artery disease risk.
Methods and Results
The Coronary Artery Risk Development in Young Adults (CARDIA) prospective cohort study (n = 3538) assessed 5 healthy lifestyle factors (HLFs) among young adults between ages 18–30 (Year 0 baseline) and 20 years later (Year 20): not overweight/obese, low alcohol intake, healthy diet, physically active, nonsmoker. We tested whether change from Year 0 to 20 in a continuous composite HLF score (HLF change; range: −5 to +5) is associated with subclinical atherosclerosis [coronary artery calcification (CAC) and carotid intima-media thickness (IMT)] at Year 20, after adjustment for demographics, medications, and baseline HLFs. By Year 20, 25·3% of the sample improved (HLF change ≥ +1); 40·4% deteriorated (had fewer HLFs); 34·4% stayed the same; 19·2% had CAC (>0). Each increase in HLFs was associated with reduced odds of detectable CAC (OR = .85, 95% CI: .74 – .98) and lower IMT (carotid bulb β = −.024, p = 0.001), and each decrease in HLFs was predictive to a similar degree of greater odds of CAC (OR = 1.17, 95% CI: 1.02 – 1.33) and greater IMT (β = +.020, p < 0.01).
Conclusions
Healthy lifestyle changes during young adulthood are associated with decreased, and unhealthy lifestyle changes with increased risk for subclinical atherosclerosis in middle age.
Keywords: epidemiology, follow-up studies, risk factors, prevention, behavior modification
Introduction
Coronary heart disease (CHD) is the leading cause of mortality1–3,4 and behavioral risk factors heighten the odds of developing CHD.5–8 Cigarette smoking, poor quality diet, physical inactivity, excessive alcohol consumption, and obesity all are major preventable causes of CHD and premature mortality.5–8
Substantial epidemiological evidence associates the sustained presence of healthy lifestyle factors with reduced risk of myocardial infarction (MI) and CHD mortality.9–12 Consequently, many advocate a public health policy of primordial prevention that preserves low risk from youth onward by preventing the development of risk factors.13–15 However, the population prevalence of a behavioral low risk profile is extremely low.11, 16 Behavioral Risk Factor Surveillance data show that only 5% of adults meet heart-healthy standards for all of three healthy behaviors: physical activity, fruit and vegetable consumption, and nonsmoking.16 The fact that most people reach young adulthood with at least one unhealthy behavior makes it essential to learn whether lifestyle changes in adulthood may still affect cardiovascular health.
We used data from the Coronary Artery Risk Development in Young Adults (CARDIA) study to determine whether health behavior changes made earlier in adulthood are associated with the burden and extent of subclinical atherosclerosis in middle age. We predicted that changes in healthy lifestyle behaviors would be related to the odds of coronary artery calcium (CAC) and carotid artery intima-media thickness (IMT), both markers of subclinical cardiovascular disease that predict future cardiovascular events.17, 18
Methods
Cohort Description and Selection
CARDIA, a longitudinal investigation of cardiovascular disease risk factors in a young adult population, has been described in detail elsewhere.19 The cohort of 5,115 adults (51% of eligible persons contacted) was recruited from four metropolitan areas in the U.S. (Birmingham, Alabama; Chicago, Illinois; Minneapolis, Minnesota; and Oakland, California). Participants, between ages 18 to 30 at Year 0 (1985–1986), were reexamined at Years 2 (1987–88), 5 (1990–91), 7 (1992–93), 10 (1995–96), 15 (2000–01), and 20 (2005–06) with follow-up rates examined of 91%, 86%, 81%, 79%, 74%, and 72% respectively. Follow-up rates for vital status are >90% in each year. Institutional review boards at each site approved the protocol and all participants provided informed consent.
Study Sample
Those who were not examined at Year 20 were excluded. Of the 3549 participants examined at Years 0 and 20, we excluded: an individual who underwent gender reassignment (n=1) and women pregnant at Year 0 (n=4) or Year 20 (n=6) leaving 3538 participants for the primary analysis. The sample included 646 black men, 1000 black women, 889 white men, and 1003 white women.
Assessment of Demographic and Healthy Lifestyle Factors
Participants fasted for 12 hours and avoided smoking and heavy physical activity for 2 hours before each clinical exam. Three seated blood pressure (BP) measurements were obtained with random-zero sphygmomanometer; the average of the 2nd and 3rd readings was used. Serum total cholesterol was determined by enzymatic procedures using the ABA Biochromatic instrument.20 Body weight was measured to the nearest 0.2 lb, with participants wearing light clothing and no shoes. Height was measured without shoes to the nearest 0.5 cm. Body mass index (BMI) was computed as weight in kilograms divided by height in meters squared (kg/m2). Age, sex, race, education, and medical information (current treatment and history) were ascertained through questionnaires. At Y0, participants brought in a list of all medications used; at Y20 they physically brought in their medications. Moderate and vigorous physical activity over the previous 12 months21 and cigarette smoking were assessed by validated interviewer-administered questionnaires. “Current smoking” was defined as smoking at least 5 cigarettes per week almost every week. Weekly alcohol (beer, wine, and liquor) intake, assessed by questionnaire, was converted to milliliters of alcohol per day.22
Diet history was obtained at Years 0 and 20 using the validated23 CARDIA Diet History, an interviewer-administered quantitative food frequency questionnaire.24, Approximately 700 food items were used to develop a dietary assessment tool suitable for various populations and ethnic groups.23, 24 Participants were asked to recall their usual dietary intake for the previous 28 days and report the frequency, amount, and method of food preparation.
Definition of Healthy Lifestyle Factor Scores
The 5 HLFs measured at Years 0 and 20 were: 1) not currently smoking cigarettes; 2) average physical activity ≥60th percentile at Year 0 by race and sex);11 3) BMI <25.0 kg/m2; 4) alcohol intake ≤15 g/day (women) or ≤30 g/day (men); and 5) healthy diet reflecting low daily intake of saturated fatty acids and high intake of potassium, calcium, and fiber. For the dietary assessment, participants were assigned a score of 1 to 5 according to a race-sex-specific quintile of each of the four nutrients, with 5 representing the more favorable quintile. The four scores were summed, and a score ≥ 60th percentile at Year 0 by race and sex was considered to be a healthy diet. A Healthy Lifestyle Factor (HLF) score (range: 0 to 5), summing the number of HLFs present, was computed for each participant at Years 0 and 20, following the method used by Liu et al.25 We also calculated a score representing change in HLF from Year 0 to Year 20 (HLF change; range: −5 to +5).
Measurement of Coronary Artery Calcium (CAC) and Carotid Intima–Media Thickness (IMT)
CAC was measured at Year 20 by computed tomography (CT) of the chest.11, 26 Electron beam CT and multidetector CT scanners were used to obtain 40 contiguous 2.5–3-mm-thick transverse images from the root of the aorta to the apex of the heart in 2 sequential scans. Participants were scanned over a hydroxylapatite phantom to allow monitoring of image brightness and noise and adjust for scanner differences. Data from both scans were transmitted electronically to the CARDIA CT Reading Center. A calcium score in Agatston units was calculated for each calcified lesion and the scores were summed across all lesions within a given artery and across all arteries (left anterior descending, left main, circumflex, and right coronary) to obtain the total calcium score for the participant. Because CAC is uncommon before midlife,27, 28 detectable CAC (>0) was used as an outcome.
High-resolution B-mode ultrasound was used to acquire a longitudinal image of the common carotid, two of the carotid artery bulb, and two of the internal carotid artery above the bulb on the right and left sides.29 Measurements of the maximal carotid IMT were made at a central reading center by readers blinded to all clinical information. The maximum IMT of the common carotid was defined as the mean of the carotid IMT of the near and far wall on both the left and right sides, with 1 to 4 measurements available for the common carotid and 1 to 8 for the carotid artery bulb and internal carotid artery. Carotid IMT was analyzed as a continuous measure.
Statistical Analyses
Multiple Imputation of Missing Data
Most variables used in our analyses had less than 2% missingness, and the percent missing of our primary outcomes ranged from 8%–14%. Even though the fraction of missing values in our data set was relatively small, a complete-case analysis resulted in discarding 1270 observations. Compared with participants who had no missing values at year 20, those with missing values were somewhat younger and less educated (both by 10 months) and were more likely to be Black, male, and smokers. To prevent reducing generalizability by discarding those with incomplete data, we imputed missing values in the primary cohort of 3538 using the sequential regression imputation approach30 implemented in IVEware (software from the Survey Research Center, Institute for Social research, University of Michigan). Five datasets were generated using data from all 7 exams, resulting in complete Year 0 and Year 20 data for the sample of N = 3538. Each completed data set was analyzed separately and results were combined using Rubin’s rules.31
Sensitivity Analyses
A complete case analysis excluded participants with missing values on any variable in our model, resulting in an analysis of 2268 cases. Additional sensitivity analyses included baseline education, a potential confounder, in both the models that used imputed data and those based on the sample of 2268 with complete data.
Primary Analyses
Baseline (Year 0) characteristics were calculated for the six HLF groups (HLF 0 through 5), and trends across the groups were tested using linear or logistic regression. We used logistic regression to estimate the odds of CAC (>0) and linear regression to estimate carotid IMT expressed as a continuous variable at Year 20. All models included age, sex, and race, Year 0 HLF score and HLF change score (Y20 HLFs – Y0 HLFs). All analyses were conducted with SAS statistical software version 9.2.
Results
Sample Demographics
TABLE 1 shows baseline (Year 0) characteristics as a function of number of healthy lifestyle factors. Supplementary Table 1 compares the baseline characteristics of those included in the analysis to those who were not included. HLFs were inversely related to total cholesterol, blood pressure, BMI, triglycerides, lipids, and fasting glucose. The sample (N = 3538) included approximately equal proportions of men and women, and black and white participants. Mean age at Year 0 was 25.1 years (SD = 3.6) and mean education 14.0 years (SD=2.2). The modal number of HLFs was three (36% of the sample); only 8% had all five HLFs at Year 0.
Table 1.
Baseline Characteristics of CARDIA Participants by Number of Healthy Lifestyle Factors at Year 0
| # HLFs at Y01 | 5 | 4 | 3 | 2 | 1 | 0 | p-value |
|---|---|---|---|---|---|---|---|
| # of people | 283 | 826 | 1278 | 882 | 238 | 31 | |
| % | 8 | 23 | 36 | 25 | 7 | 1 | |
| Women (%) | 59 | 58 | 56 | 56 | 55 | 45 | .18a |
| Black (%) | 41 | 43 | 45 | 51 | 53 | 48 | <.0001a |
| Total Chol. | 171 | 175 | 176 | 181 | 184 | 179 | <.0001b |
| DBP (mmHg) | 67 | 69 | 68 | 69 | 70 | 71 | <0.01b |
| SBP (mmHg) | 108 | 109 | 110 | 111 | 113 | 116 | <.0001b |
| BMI | 22 | 23 | 24 | 27 | 28 | 27 | <.0001b |
| Triglycerides (mg/DL) | 59 | 66 | 69 | 80 | 94 | 123 | <.0001b |
| HDL (mg/DL) | 56 | 55 | 54 | 51 | 50 | 52 | <.0001b |
| LDL (mg/DL) | 103 | 107 | 109 | 114 | 116 | 102 | <.0001b |
| Glucose (mg/DL) | 81 | 82 | 82 | 83 | 84 | 85 | .0001b |
| Diabetes (%) | 0.4% | 0.2% | 0.3% | 0.7% | 2.0% | 0% | 0.01a |
HLF: healthy lifestyle factor; Y0: Year 0
Logistic regression;
Linear regression.
HLF Change and Coronary Artery Calcium (CAC)
At year 20, 19.2% of the sample had CAC>0 (13.3% CAC: 1–100; 3.4% CAC: 101–400; 2.5% CAC>400). TABLE 2 reports results of the logistic regression model estimating the odds of having CAC at Year 20. In addition to Y0 HLF score, the following variables were included as covariates: age, sex, race, education, and use of hypertension, cholesterol lowering, or diabetes medication. Results indicate that being older, male, white, less educated, using hypertension or cholesterol lowering medication, or having fewer HLFs at baseline were all associated with greater odds of having CAC at Year 20. Importantly, after adjustment for these factors, a change in HLF was associated with significantly altered odds of having CAC at Year 20, OR = .85 (95% CI: .77 – .94). A 1-HLF increase was associated with a 15% reduction in odds of detectable CAC. The relation between HLF change and odds of detectable CAC was graded: those with a greater increase in HLFs had a proportionally lower prevalence of CAC; those with a greater decrease in HLFs had proportionally higher prevalence of CAC and greater odds of CAC (see FIGURE 1). The pattern of results was consistent when models were run using non-imputed data (Supplementary Table 2)
Table 2.
Healthy Lifestyle Factor (HLF) Change Score Predicting Detectable CAC at Y20a
| Variable | OR | Lower CI | Upper CI | p-value |
|---|---|---|---|---|
| Age (years) | 1.11 | 1.08 | 1.15 | <.0001 |
| Male | 3.25 | 2.66 | 3.96 | <.0001 |
| Black | .73 | .59 | .90 | .004 |
| Education | .94 | .91 | .98 | .004 |
| Hypertension medication | 1.78 | 1.41 | 2.27 | <.0001 |
| Cholesterol lowering medication | 1.93 | 1.43 | 2.61 | <.0001 |
| Diabetes medication | 1.31 | .88 | 1.96 | .19 |
| Y0 HLF score | .74 | .66 | .84 | <.0001 |
| HLF change (Y20-Y0) | .85 | .77 | .94 | .00 |
Covariates included in the model were Age, Sex, Race, maximum attained education, HLF score at Year 0, and hypertension medication, cholesterol lowering medication, and diabetes medication at Year 20.
Results are based on analyses combined across 5 multiply imputed data sets.
Figure 1.

Graded relationship observed between HLF change (from Year 0 to Year 20) and incidence of CAC at Year 20. Green shows those who increased HLFs. Gray shows those whose HLFs stayed the same. Red shows those who decreased HLFs. Checked section signifies CAC between 1–100; Dotted section signifies CAC >100. Adjusted for age, race, sex, and baseline number of HLFs; based on imputed data.
Assessment of HLF change in these models assumes a uniform linear effect for both healthy (positive) and unhealthy (negative) changes in lifestyle. To test this assumption, we also ran the above model with number of healthy and unhealthy HLF changes entered as independent variables. The results confirmed a uniform linear effect: each additional healthy HLF change reduced the odds of detectable CAC (OR = .85, 95% CI: .74 – .98) and each additional unhealthy HLF change increased the odds of detectable CAC (OR = 1.17, 95% CI: 1.02 – 1.33) Note that the effect associated with healthy change was nearly identical in magnitude (OR = 1/.85 = 1.18) to that associated with unhealthy change (OR = 1.17).
HLF Change and Carotid Intima-media Thickening (IMT)
At year 20, 6.8% of the sample had common carotid IMT>1; 45.5% had carotid bulb IMT >1; 12.3% had internal carotid >1%. Linear regression adjusting for age, sex, race, education, use of hypertension, cholesterol lowering, or diabetes medication, and Year 0 HLF score, showed that an increase in HLFs was associated with lower carotid IMT at Year 20: common carotid IMT, β = −.008, p = .001; carotid bulb IMT, β = −.022, p < 0.0001; internal carotid IMT, β = −.014, p = 0.002. (See TABLE 3). The pattern of results was consistent when models were run using non-imputed data. (Supplementary Table 3)
Table 3.
Healthy Lifestyle Factor (HLF) Change Score Predicting Carotid IMT at Y20a
| Common IMT | Bulb IMT | Internal IMT | |||||||
|---|---|---|---|---|---|---|---|---|---|
| Variable | Regression Coefficient | SE | p-value | Regression Coefficient | SE | p-value | Regression Coefficient | SE | p-value |
| Age (years) | 0.008 | 0.001 | <0.0001 | 0.011 | 0.001 | <0.0001 | 0.007 | 0.001 | <0.0001 |
| Male | 0.048 | 0.004 | <0.0001 | 0.094 | 0.009 | <0.0001 | 0.051 | 0.008 | <0.0001 |
| Black | 0.062 | 0.005 | <0.001 | 0.000 | 0.010 | 0.97 | 0.011 | 0.008 | <0.17 |
| Education (years) | -0.002 | 0.001 | 0.07 | −0.009 | 0.002 | <0.0001 | −0.004 | 0.002 | 0.01 |
| Hypertension medication* | 0.030 | 0.006 | <0.0001 | 0.058 | 0.015 | 0.0001 | 0.039 | 0.010 | 0.0002 |
| Cholesterol medication* | 0.015 | 0.009 | 0.09 | −0.002 | 0.018 | 0.91 | 0.022 | 0.013 | 0.09 |
| Diabetes medication* | 0.037 | 0.011 | 0.001 | 0.071 | 0.025 | 0.005 | 0.015 | 0.020 | 0.45 |
| Y0 HLF score | −0.016 | 0.002 | <0.0001 | −0.025 | 0.006 | <0.0001 | −0.022 | 0.004 | <0.0001 |
| HLF change (Y20-Y0) | −0.008 | 0.002 | 0.0009 | −0.022 | 0.005 | <0.0001 | −0.014 | 0.004 | 0.002 |
Covariates included in the model were Age, Sex, Race, maximum attained education, HLF score at Year 0, and hypertension medication, cholesterol lowering medication, and diabetes medication at Year 20. Results are based on analyses combined across 5 multiply imputed data sets.
We next ran the above model with number of healthy and unhealthy HLF changes entered as independent covariates. Results confirmed a uniform linear effect, such that healthy HLF change predicted significantly lower carotid IMT at Year 20 on two of the three indicators: common carotid IMT, β = −.005, p = .12; carotid bulb IMT, β = −.024, p = 0.001; internal carotid IMT, β = −.015, p < 0.01. Conversely, negative HLF change predicted significantly higher carotid IMT at Year 20 on all three indicators: common carotid IMT, β = +.009, p = .001; carotid bulb IMT, β = +.020, p < 0.01; internal carotid IMT, β = +.012, p < 0.05. Note that effects associated with healthy lifestyle change were nearly identical in magnitude to those associated with unhealthy change. Figure 2 shows the graded relationship between HLF change from Year 0 to Year 20 and incidence of Bulb IMT above the 80th percentile at Year 20.
Figure 2.
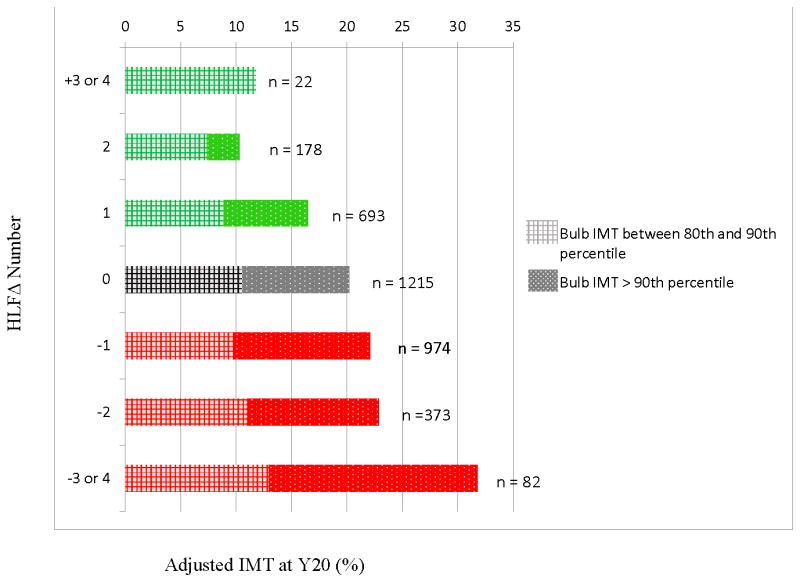
Graded relationship observed between HLF change (from Year 0 to Year 20) and incidence of Bulb IMT above the 80th percentile at Year 20. Green shows those who increased HLFs. Gray shows those whose HLFs stayed the same. Red shows those who decreased HLFs. Checked section signifies bulb IMT between 80th – 90th percentile. Dotted section signifies IMT >90th percentile. Adjusted for age, race, sex, and baseline number of HLFs; based on imputed data.
Individual HLFs
We also ran separate models predicting Year 20 CAC > 0 and IMT in the top 80% for each individual HLF where the HLF was treated either as a continuous variable (Table 4) or as a categorical variable (Supplementary Tables 4–7). Heavier smoking at Year 0 predicted increased odds of having CAC or IMT at Year 20, and achieving or maintaining nonsmoking was associated with reduced odds. Having a higher BMI at Year 0 predicted increased odds of having CAC and IMT at Year 20. Maintaining a non-overweight body weight was associated with reduced odds of CAC and IMT, and gaining more weight gain was associated with increased odds of having common and internal IMT in the top 80%. Neither baseline nor change in physical activity and alcohol intake were significantly associated with CAC or IMT, and healthy change in diet was only associated with reduced odds of having Year 20 bulb IMT in the top 80%.
Table 4.
Odds ratios*, 95% CI, and p-values for continuous measures of Healthy Lifestyle Factor components predicting Year 20 CAC and Carotid IMT.
| HLF component | Variable | CAC > 0 | Common IMT, top 80% | Bulb IMT, top 80% | Internal IMT, top 80% |
|---|---|---|---|---|---|
| Smoking | |||||
| Y0 Cigarettes/d | 1.04 (1.02, 1.05), <0.0001 | 1.02 (1.01, 1.04), 0.004 | 1.02 (1.01, 1.04), 0.002 | 1.01 (1.00, 1.03), 0.05 | |
| Y20-Y0 cigarettes/d | 1.01 (0.99, 1.03), 0.18 | 1.01 (1.00, 1.03), 0.14 | 1.02 (1.00, 1.03), 0.02 | 1.00 (0.98, 1.02), 0.76 | |
| High physical activity | |||||
| Y0 PA score (per 100 PA units) | 1.00 (0.96, 1.04), 0.86 | 0.98 (0.94, 1.02), 0.33 | 0.99 (0.96, 1.03), 0.78 | 0.97 (0.93, 1.01), 0.15 | |
| Y20-Y0 PA change (per 100 PA units) | 0.99 (0.95, 1.02), 0.43 | 0.99 (0.96, 1.03), 0.73 | 0.99 (0.95, 1.02), 0.44 | 0.96 (0.92, 1.00), 0.04 | |
| BMI | |||||
| Y0 BMI | 1.05 (1.03, 1.08), <0.0001 | 1.10 (1.08, 1.12), <0.0001 | 1.04 (1.02, 1.06), 0.0002 | 1.06 (1.04, 1.07), <0.0001 | |
| Y20-Y0 BMI | 1.01 (0.99, 1.03), 0.50 | 1.03 (1.01, 1.05), 0.003 | 0.99 (0.97, 1.01), 0.41 | 1.02 (1.01, 1.04), 0.006 | |
| Alcohol | |||||
| Y0 alcohol (per 10 g) | 1.05 (1.00, 1.11), 0.06 | 0.97 (0.91, 1.02), 0.22 | 1.01 (0.95, 1.06), 0.82 | 0.96 (0.91, 1.02), 0.24 | |
| Y20-Y0 alcohol (per 10 g) | 1.03 (0.99, 1.07), 0.15 | 0.96 (0.92, 1.01), 0.15 | 1.01 (0.96, 1.05), 0.80 | 1.01 (0.96, 1.06), 0.77 | |
| Healthy diet | |||||
| Y0 diet score | 1.01 (0.96, 1.06), 0.68 | 1.02 (0.97, 1.06), 0.50 | 0.96 (0.92, 1.00) 0.07 | 0.98 (0.94, 1.03), 0.44 | |
| Y20-Y0 diet score | 1.01 (0.96, 1.07), 0.62 | 1.01 (0.97, 1.05), 0.59 | 0.95 (0.92, 0.99), 0.02 | 1.02 (0.98, 1.06), 0.36 |
adjusted for age, sex, race, maximum attained education, Y20 hypertension medication, Y20 cholesterol lowering medication, and Y20 diabetes medication.
To learn whether any single HLF accounted for the associations between the combined HLF change score and Year 20 CAC and IMT, we removed each HLF one at a time and reexamined these associations (Table 5). The residual composite HLF change score remained significantly associated with Year 20 CAC and IMT.
Table 5.
Odds ratio* (p-value) for HLF change score when 1 HL factor is omitted
| CAC > 0 | Bulb IMT, top | |
|---|---|---|
| Omitted HL factor | OR (p-value) | OR (p-value) |
| Not smoking | 0.88 (0.02) | 0.87 (0.01) |
| High physical activity | 0.84 (0.003) | 0.78 (<0.0001) |
| BMI < 25.0 | 0.82 (0.0002) | 0.85 (0.002) |
| Low alcohol | 0.82 (0.0004) | 0.81 (<0.0001) |
| Healthy diet | 0.76 (<0.0001) | 0.79 (<0.0001) |
adjusted for age, race, sex, and 4 indicator variables representing the 5 possible baseline HLF scores (0, 1, 2, 3, or 4)
Discussion
Change in Healthy Lifestyle Factors from young adulthood to middle age is significantly associated with the presence and extent of subclinical atherosclerosis measured after 20 years of follow-up. The association held after adjustment for demographics, medications, and the baseline number of HLFs in young adulthood. The effect also was evident for two indicators of subclinical disease: CAC and carotid IMT, both predictive of future coronary events.17, 18 Further, the relation between HLF change and subclinical atherosclerosis was graded, such that adding HLFs was associated with improved CAC and IMT outcomes, whereas reducing HLFs was associated with poorer outcomes.
Associations between health behaviors and subclinical atherosclerosis may shed light on pathways toward the development of CHD, coronary events, and mortality. HLFs, assessed at a single time point, have been predictive of cardiovascular and all-cause mortality in several studies.10, 32–34 Individual HLFs (BMI, smoking, alcohol consumption, poor diet and physical inactivity) are also associated with CAC and/or IMT.35–38 Using the same combined HLF score as this study, Liu and colleagues found that having more HLFs in young adulthood was associated with having a low cardiovascular disease risk profile in middle age (i.e., untreated cholesterol <200 mg/dL, untreated blood pressure <120/<80 mm Hg, no history of diabetes mellitus or myocardial infarction).25
The stark reality, however, is that few adults have multiple HLFs. Indeed, our observation that only 10% of the young adults in our sample had all 5 HLFs is consistent with earlier estimates.39 In terms of individual health behaviors, fewer than 25% of U.S. adults meet dietary guidelines9 and 25% report no leisure time physical activity.10 Presently, 21% of adults in the U.S.40 report cigarette smoking.41 Suboptimal diet and a sedentary behavior pattern are pervasive, and risk behaviors tend to cluster11–13, 16 heightening disease risk.17 The fact that most people reach young adulthood already having acquired at least one unhealthy behavior raises a pressing question for clinical practice policy: does healthy lifestyle change in adulthood actually reduce the risk of cardiovascular disease? If poor health habits acquired by early adulthood have already done their damage, subsequent intervention to promote healthy lifestyle change might be futile.
Only a few studies have prospectively examined whether change in HLFs during adulthood is related to cardiovascular morbidity and mortality or to early markers of coronary disease. The Atherosclerosis Risk in Communities Study (ARIC) study found fewer cardiovascular events and lower all-cause mortality among those who adopted a healthy lifestyle in middle age.42 Hu et al. found that reduced smoking and improved diet explained a significant portion of the decline in coronary disease incidence in the Nurses’ Health Study cohort, whereas increased obesity apparently slowed the decline.43 Gregg et al. found decreased all-cause and cardiovascular mortality among elderly women who increased physical activity.44 Quitting smoking during young and middle adulthood has been associated with diminished incidence of CAC,45 and increased obesity has been linked to increased incidence of CAC46 and IMT.47 In the only prior study to relate naturalistic, bidirectional change in a healthy lifestyle factor to measures of atherosclerosis, Buscemi et al.46 observed that carotid IMT decreased among those who lost weight and increased for those who gained weight over a 10 year period. In a clinical trial, Ornish and colleagues randomized adults with bioverified coronary artery disease (CAD) to either intensive lifestyle intervention (low-fat vegetarian diet, stopping smoking, stress management training, and moderate exercise), as compared to usual care control. The investigators observed decreased stenosis and fewer cardiac events over a 5 year follow up period among treated participants, versus increased stenosis and events for controls.48–50 The present results are consistent with prior findings and suggest that, even after reaching young adulthood, making changes in lifestyle behaviors can still impact the odds of coronary atherosclerosis. The graded, linear association we observed between changes in HLFs and presence and extent of subclinical disease suggests that making healthy lifestyle changes during early or midlife might be able to reverse or change the natural progression of CAD. Making changes in smoking and body weight appears to have greatest impact, and changing other HLFs including physical activity, diet and alcohol intake combines in a graded manner to affect the odds of subclinical atherosclerosis in midlife. It is encouraging to note that the healthy behavior changes that participants made naturally and that were associated with reduced odds of CAC and IMT were much less extreme and demanding than those required by the Ornish program.
Our findings give grounds for optimism to the vast majority of adults who have already acquired behavioral risk factors for chronic disease by young adulthood. More than 25% of our sample spontaneously made healthy lifestyle changes that were associated with lowered odds of subclinical atherosclerosis. The proportion of adults that makes healthy lifestyle changes can very likely be increased by implementing health care reimbursement for behavior change interventions or other health promotion policies. At the same time, our findings also convey a cautionary note to those who reach young adulthood free of lifestyle risk factors. Those individuals were not necessarily free of cardiovascular risk 20 years later, indicating that primordial prevention is not a panacea. Rather, the tendency to adopt unhealthy lifestyles after young adulthood was substantial, greater than the tendency to acquire healthier habits, and associated to the same degree with altered odds of developing CAC and IMT. These observations suggest that health behavior changes in adulthood, whether positive or negative, continue to have important consequences for later health outcomes.
A strength of our study is the relatively young age of our large biracial cohort (N = 3538; mean age 25.1 years at Year 0), and the excellent retention through 20 year follow-up. The finding of a robust, bidirectional, graded effect of healthy lifestyle change across both markers of subclinical disease (CAC and IMT) also is a major strength. The results lend weight to the recommendation that counseling for healthy lifestyle change is clinically indicated both to promote change from unhealthy to healthy lifestyle and to prevent loss of existing healthy habits.47
Conclusion
Independent of the healthy lifestyle profile present in young adulthood, making subsequent changes in health behaviors is linked to alterations in the burden of subclinical atherosclerosis in middle age. Adopting a healthier lifestyle during early or midlife may reduce the risk of developing CAD; conversely discontinuing healthy behaviors may increase risk. Promotion of healthy lifestyles is essential, not only primordially at early stages of life, but also among adults to control and potentially even reverse the natural progression of CAD.
Supplementary Material
Acknowledgments
Author contributions: Study concept and design: Spring, Moller, Siddique, and Liu. Acquisition of data: Colangelo. Analysis and interpretation of data: Colangelo, Siddique. Drafting of the manuscript: Moller, Spring, Roehrig. Critical revision of the manuscript for important intellectual content: Daviglus, Polak, Reis, Sidney, Liu. Statistical expertise: Colangelo, Siddique, Liu. Obtained funding: Liu, Daviglus, Reis, Sidney. Administrative, technical, or material support: Colangelo. Study supervision: Spring.
Funding Sources: This research was funded by contracts N01-HC-48047 through 48050 and N01-HC-95095 from the National Heart, Lung, and Blood Institute, National Institutes of Health, by HL075451 to Dr. Spring, and by CA154862 to Dr. Siddique.
Footnotes
Conflict of Interest Disclosures: None.
References
- 1.Xu J, Kochanek KD, Murphy SL, Tejada-Vera B. Deaths: Final data for 2007. Natl Vital Stat Rep. 2010;58 Retrieved from: http://www.cdc.gov/nchs/data/nvsr/nvsr58_19.pdf. [PubMed] [Google Scholar]
- 2.Lloyd-Jones DM, Hong Y, Labarthe D, Mozaffarian D, Appel LJ, Van Horn L, Greenlund K, Daniels S, Nichol G, Tomaselli GF, Arnett DK, Fonarow GC, Ho PM, Lauer MS, Masoudi FA, Robertson RM, Roger V, Schwamm LH, Sorlie P, Yancy CW, Rosamond WD American Heart Association Strategic Planning Task F, Statistics C. Defining and setting national goals for cardiovascular health promotion and disease reduction: The american heart association's strategic impact goal through 2020 and beyond. Circulation. 2010;121:586–613. doi: 10.1161/CIRCULATIONAHA.109.192703. [DOI] [PubMed] [Google Scholar]
- 3.Lloyd-Jones D, Adams R, Carnethon M, De Simone G, Ferguson TB, Flegal K, Ford E, Furie K, Go A, Greenlund K, Haase N, Hailpern S, Ho M, Howard V, Kissela B, Kittner S, Lackland D, Lisabeth L, Marelli A, McDermott M, Meigs J, Mozaffarian D, Nichol G, O'Donnell C, Roger V, Rosamond W, Sacco R, Sorlie P, Stafford R, Steinberger J, Thom T, Wasserthiel-Smoller S, Wong N, Wylie-Rosett J, Hong Y American Heart Association Statistics C, Stroke Statistics S. Heart disease and stroke statistics--2009 update: A report from the american heart association statistics committee and stroke statistics subcommittee. Circulation. 2009;119:480–486. doi: 10.1161/CIRCULATIONAHA.108.191259. [DOI] [PubMed] [Google Scholar]
- 4.Scarborough P, Bhatnagar P, Wickramasinghe K. Coronary heart disease statistics. Vol. 2010 British Heart Foundation; 2010. [Google Scholar]
- 5.World Health Organization., Public Health Agency of Canada. Preventing chronic diseases : A vital investment. Geneva; Ottawa: World Health Organization; Public Health Agency of Canada; 2005. [Google Scholar]
- 6.Danaei G, Ding EL, Mozaffarian D, Taylor B, Rehm J, Murray CJ, Ezzati M. The preventable causes of death in the united states: Comparative risk assessment of dietary, lifestyle, and metabolic risk factors. PLoS Med. 2009;6:e1000058. doi: 10.1371/journal.pmed.1000058. [DOI] [PMC free article] [PubMed] [Google Scholar]
- 7.Folsom AR, Yatsuya H, Nettleton JA, Lutsey PL, Cushman M, Rosamond WD, Investigators AS. Community prevalence of ideal cardiovascular health, by the american heart association definition, and relationship with cardiovascular disease incidence. J Am Coll Cardiol. 2011;57:1690–1696. doi: 10.1016/j.jacc.2010.11.041. [DOI] [PMC free article] [PubMed] [Google Scholar]
- 8.United States. Dept. of Health and Human Services. Healthy people 2010 : Understanding and improving health. Boston: Jones and Bartlett Publishers; 2001. [Google Scholar]
- 9.Khaw KT, Wareham N, Bingham S, Welch A, Luben R, Day N. Combined impact of health behaviours and mortality in men and women: The epic-norfolk prospective population study. PLoS Med. 2008;5:e12. doi: 10.1371/journal.pmed.0050012. [DOI] [PMC free article] [PubMed] [Google Scholar]
- 10.Chiuve SE, McCullough ML, Sacks FM, Rimm EB. Healthy lifestyle factors in the primary prevention of coronary heart disease among men: Benefits among users and nonusers of lipid-lowering and antihypertensive medications. Circulation. 2006;114:160–167. doi: 10.1161/CIRCULATIONAHA.106.621417. [DOI] [PubMed] [Google Scholar]
- 11.Stampfer MJ, Hu FB, Manson JE, Rimm EB, Willett WC. Primary prevention of coronary heart disease in women through diet and lifestyle. N Engl J Med. 2000;343:16–22. doi: 10.1056/NEJM200007063430103. [DOI] [PubMed] [Google Scholar]
- 12.van Dam RM, Li T, Spiegelman D, Franco OH, Hu FB. Combined impact of lifestyle factors on mortality: Prospective cohort study in us women. Br Med J. 2008;337 doi: 10.1136/bmj.a1440. [DOI] [PMC free article] [PubMed] [Google Scholar]
- 13.Strasser T. Reflections on cardiovascular-diseases. Interdisciplinary Science Reviews. 1978;3:225–230. [Google Scholar]
- 14.Lloyd-Jones DM, Leip EP, Larson MG, D'Agostino RB, Beiser A, Wilson PW, Wolf PA, Levy D. Prediction of lifetime risk for cardiovascular disease by risk factor burden at 50 years of age. Circulation. 2006;113:791–798. doi: 10.1161/CIRCULATIONAHA.105.548206. [DOI] [PubMed] [Google Scholar]
- 15.Weintraub WS, Daniels SR, Burke LE, Franklin BA, Goff DC, Jr, Hayman LL, Lloyd-Jones D, Pandey DK, Sanchez EJ, Schram AP, Whitsel LP American Heart Association Advocacy Coordinating C, Council on Cardiovascular Disease in the Y, Council on the Kidney in Cardiovascular D, Council on E, Prevention, Council on Cardiovascular N, Council on A, Thrombosis, Vascular B, Council on Clinical C, Stroke C. Value of primordial and primary prevention for cardiovascular disease: A policy statement from the american heart association. Circulation. 2011;124:967–990. doi: 10.1161/CIR.0b013e3182285a81. [DOI] [PubMed] [Google Scholar]
- 16.Miller RR, Sales AE, Kopjar B, Fihn SD, Bryson CL. Adherence to heart-healthy behaviors in a sample of the u.S. Population. Prev Chronic Dis. 2005;2:A18. [PMC free article] [PubMed] [Google Scholar]
- 17.Pletcher MJ, Tice JA, Pignone M, Browner WS. Using the coronary artery calcium score to predict coronary heart disease events - a systematic review and meta-analysis. Arch Intern Med. 2004;164:1285–1292. doi: 10.1001/archinte.164.12.1285. [DOI] [PubMed] [Google Scholar]
- 18.Simon A, Megnien JL, Chironi G. The value of carotid intima-media thickness for predicting cardiovascular risk. Arterioscler Thromb Vasc Biol. 2010;30:182–185. doi: 10.1161/ATVBAHA.109.196980. [DOI] [PubMed] [Google Scholar]
- 19.Hughes GH, Cutter G, Donahue R, Friedman GD, Hulley S, Hunkeler E, Jacobs DR, Liu K, Orden S, Pirie P, Tucker B, Wagenknecht L. Recruitment in the coronary-artery disease risk development in young-adults (cardia) study. Control Clin Trials. 1987;8:S68–S73. doi: 10.1016/0197-2456(87)90008-0. [DOI] [PubMed] [Google Scholar]
- 20.Warnick GR. Enzymatic methods for quantification of lipoprotein lipids. Methods Enzymol. 1986;129:101–123. doi: 10.1016/0076-6879(86)29064-3. [DOI] [PubMed] [Google Scholar]
- 21.Sidney S, Jacobs DR, Jr, Haskell WL, Armstrong MA, Dimicco A, Oberman A, Savage PJ, Slattery ML, Sternfeld B, Van Horn L. Comparison of two methods of assessing physical activity in the coronary artery risk development in young adults (cardia) study. Am J Epidemiol. 1991;133:1231–1245. doi: 10.1093/oxfordjournals.aje.a115835. [DOI] [PubMed] [Google Scholar]
- 22.Dyer AR, Cutter GR, Liu KQ, Armstrong MA, Friedman GD, Hughes GH, Dolce JJ, Raczynski J, Burke G, Manolio T. Alcohol intake and blood pressure in young adults: The cardia study. J Clin Epidemiol. 1990;43:1–13. doi: 10.1016/0895-4356(90)90050-y. [DOI] [PubMed] [Google Scholar]
- 23.Liu K, Slattery M, Jacobs D, Jr, Cutter G, McDonald A, Van Horn L, Hilner JE, Caan B, Bragg C, Dyer A, et al. A study of the reliability and comparative validity of the cardia dietary history. Ethn Dis. 1994;4:15–27. [PubMed] [Google Scholar]
- 24.McDonald A, Van Horn L, Slattery M, Hilner J, Bragg C, Caan B, Jacobs D, Jr, Liu K, Hubert H, Gernhofer N, et al. The cardia dietary history: Development, implementation, and evaluation. J Am Diet Assoc. 1991;91:1104–1112. [PubMed] [Google Scholar]
- 25.Liu K, Daviglus ML, Loria CM, Colangelo LA, Spring B, Moller AC, Lloyd-Jones DM. Healthy lifestyle through young adulthood and the presence of low cardiovascular disease risk profile in middle age the coronary artery risk development in (young) adults (cardia) study. Circulation. 2012;125:996–U992. doi: 10.1161/CIRCULATIONAHA.111.060681. [DOI] [PMC free article] [PubMed] [Google Scholar]
- 26.Kaufmann RB, Sheedy PF, 2nd, Breen JF, Kelzenberg JR, Kruger BL, Schwartz RS, Moll PP. Detection of heart calcification with electron beam ct: Interobserver and intraobserver reliability for scoring quantification. Radiology. 1994;190:347–352. doi: 10.1148/radiology.190.2.8284380. [DOI] [PubMed] [Google Scholar]
- 27.Bild DE, Folsom AR, Lowe LP, Sidney S, Kiefe C, Westfall AO, Zheng ZJ, Rumberger J. Prevalence and correlates of coronary calcification in black and white young adults: The coronary artery risk development in young adults (cardia) study. Arterioscler Thromb Vasc Biol. 2001;21:852–857. doi: 10.1161/01.atv.21.5.852. [DOI] [PubMed] [Google Scholar]
- 28.Hoff JA, Chomka EV, Krainik AJ, Daviglus M, Rich S, Kondos GT. Age and gender distributions of coronary artery calcium detected by electron beam tomography in 35,246 adults. Am J Cardiol. 2001;87:1335–1339. doi: 10.1016/s0002-9149(01)01548-x. [DOI] [PubMed] [Google Scholar]
- 29.Polak JF, Person SD, Wei GS, Godreau A, Jacobs DR, Jr, Harrington A, Sidney S, O'Leary DH. Segment-specific associations of carotid intima-media thickness with cardiovascular risk factors: The coronary artery risk development in young adults (cardia) study. Stroke. 2010;41:9–15. doi: 10.1161/STROKEAHA.109.566596. [DOI] [PMC free article] [PubMed] [Google Scholar]
- 30.Raghunathan T, Lepkowski JM, Van Hoewyk J, Solenberger P. A multivariate technique for multiply imputing missing values using a sequence of regression models. Survey Methodology. 2001;27:85–95. [Google Scholar]
- 31.Little RaRDB. Statistical analysis with missing data. 2. New York: Wiley; 2002. [Google Scholar]
- 32.Kvaavik E, Batty GD, Ursin G, Huxley R, Gale CR. Influence of individual and combined health behaviors on total and cause-specific mortality in men and women: The united kingdom health and lifestyle survey. Arch Intern Med. 2010;170:711–718. doi: 10.1001/archinternmed.2010.76. [DOI] [PubMed] [Google Scholar]
- 33.McCullough ML, Patel AV, Kushi LH, Patel R, Willett WC, Doyle C, Thun MJ, Gapstur SM. Following cancer prevention guidelines reduces risk of cancer, cardiovascular disease, and all-cause mortality. Cancer Epidemiol Biomarkers Prev. 2011;20:1089–1097. doi: 10.1158/1055-9965.EPI-10-1173. [DOI] [PubMed] [Google Scholar]
- 34.Tamakoshi A, Tamakoshi K, Lin YS, Yagyu K, Kikuchi S, Grp JS. Healthy lifestyle and preventable death: Findings from the japan collaborative cohort (jacc) study. Prev Med. 2009;48:486–492. doi: 10.1016/j.ypmed.2009.02.017. [DOI] [PubMed] [Google Scholar]
- 35.Chambless LE, Heiss G, Folsom AR, Rosamond W, Szklo M, Sharrett AR, Clegg LX. Association of coronary heart disease incidence with carotid arterial wall thickness and major risk factors: The atherosclerosis risk in communities (aric) study, 1987–1993. Am J Epidemiol. 1997;146:483–494. doi: 10.1093/oxfordjournals.aje.a009302. [DOI] [PubMed] [Google Scholar]
- 36.Chambless LE, Folsom AR, Clegg LX, Sharrett AR, Shahar E, Nieto FJ, Rosamond WD, Evans G. Carotid wall thickness is predictive of incident clinical stroke - the atherosclerosis risk in communities (aric) study. Am J Epidemiol. 2000;151:478–487. doi: 10.1093/oxfordjournals.aje.a010233. [DOI] [PubMed] [Google Scholar]
- 37.Burke GL, Evans GW, Riley WA, Sharrett AR, Howard G, Barnes RW, Rosamond W, Crow RS, Rautaharju PM, Heiss G. Arterial-wall thickness is associated with prevalent cardiovascular-disease in middle-aged adults - the atherosclerosis risk in communities (aric) study. Stroke. 1995;26:386–391. doi: 10.1161/01.str.26.3.386. [DOI] [PubMed] [Google Scholar]
- 38.Bishop FK, Maahs DM, Snell-Bergeon JK, Ogden LG, Kinney GL, Rewers M. Lifestyle risk factors for atherosclerosis in adults with type 1 diabetes. Diab Vasc Dis Res. 2009;6:269–275. doi: 10.1177/1479164109346359. [DOI] [PubMed] [Google Scholar]
- 39.Ford ES, Bergmann MM, Kroger J, Schienkiewitz A, Weikert C, Boeing H. Healthy living is the best revenge findings from the european prospective investigation into cancer and nutrition-potsdam study. Arch Intern Med. 2009;169:1355–1362. doi: 10.1001/archinternmed.2009.237. [DOI] [PubMed] [Google Scholar]
- 40.(U.S.) CfDCaP. Economic costs associated with smoking. 2011 Mar 21;2011 [Google Scholar]
- 41.Centre THaSCI. Statistics on obesity, physical activity, and diet: England, 2001 report. 2011;2011 [Google Scholar]
- 42.Sabour S, Grobbee DE, Prokop M, van der Schouw YT, Bots ML. Change in abdominal obesity and risk of coronary calcification. J Epidemiol Community Health. 2011;65:287–288. doi: 10.1136/jech.2009.099002. [DOI] [PubMed] [Google Scholar]
- 43.Hu FB, Stampfer MJ, Manson JE, Grodstein F, Colditz GA, Speizer FE, Willett WC. Trends in the incidence of coronary heart disease and changes in diet and lifestyle in women. N Engl J Med. 2000;343:530–537. doi: 10.1056/NEJM200008243430802. [DOI] [PubMed] [Google Scholar]
- 44.Oren A, Vos LE, Uiterwaal CS, Gorissen WH, Grobbee DE, Bots ML. Change in body mass index from adolescence to young adulthood and increased carotid intima-media thickness at 28 years of age: The atherosclerosis risk in young adults study. Int J Obes Relat Metab Disord. 2003;27:1383–1390. doi: 10.1038/sj.ijo.0802404. [DOI] [PubMed] [Google Scholar]
- 45.Lee DH, Steffes MW, Gross M, Park K, Holvoet P, Kiefe CI, Lewis CE, Jacobs DR., Jr Differential associations of weight dynamics with coronary artery calcium versus common carotid artery intima-media thickness: The cardia study. Am J Epidemiol. 2010;172:180–189. doi: 10.1093/aje/kwq093. [DOI] [PMC free article] [PubMed] [Google Scholar]
- 46.Buscemi S, Batsis JA, Verga S, Carciola T, Mattina A, Citarda S, Re A, Arnone M, D'Orio L, Belmonte S, D'Angelo A, Cerasola G. Long-term effects of a multidisciplinary treatment of uncomplicated obesity on carotid intima-media thickness. Obesity (Silver Spring) 2011;19:1187–1192. doi: 10.1038/oby.2010.313. [DOI] [PubMed] [Google Scholar]
- 47.USPSTF. The guide to clinical preventive services 2010 – 2011: Recommendations of the u.S. Preventive services task force. Vol. 2010. Rockville (MD): 2010. [PubMed] [Google Scholar]
- 48.Ornish D, Brown SE, Scherwitz LW, Billings JH, Armstrong WT, Ports TA, McLanahan SM, Kirkeeide RL, Brand RJ, Gould KL. Can lifestyle changes reverse coronary heart disease? The lifestyle heart trial. Lancet. 1990;336:129–133. doi: 10.1016/0140-6736(90)91656-u. [DOI] [PubMed] [Google Scholar]
- 49.Ornish D, Scherwitz LW, Billings JH, Brown SE, Gould KL, Merritt TA, Sparler S, Armstrong WT, Ports TA, Kirkeeide RL, Hogeboom C, Brand RJ. Intensive lifestyle changes for reversal of coronary heart disease. JAMA. 1998;280:2001–2007. doi: 10.1001/jama.280.23.2001. [DOI] [PubMed] [Google Scholar]
- 50.Dod HS, Bhardwaj R, Sajja V, Weidner G, Hobbs GR, Konat GW, Manivannan S, Gharib W, Warden BE, Nanda NC, Beto RJ, Ornish D, Jain AC. Effect of intensive lifestyle changes on endothelial function and on inflammatory markers of atherosclerosis. Am J Cardiol. 2010;105:362–367. doi: 10.1016/j.amjcard.2009.09.038. [DOI] [PubMed] [Google Scholar]
Associated Data
This section collects any data citations, data availability statements, or supplementary materials included in this article.