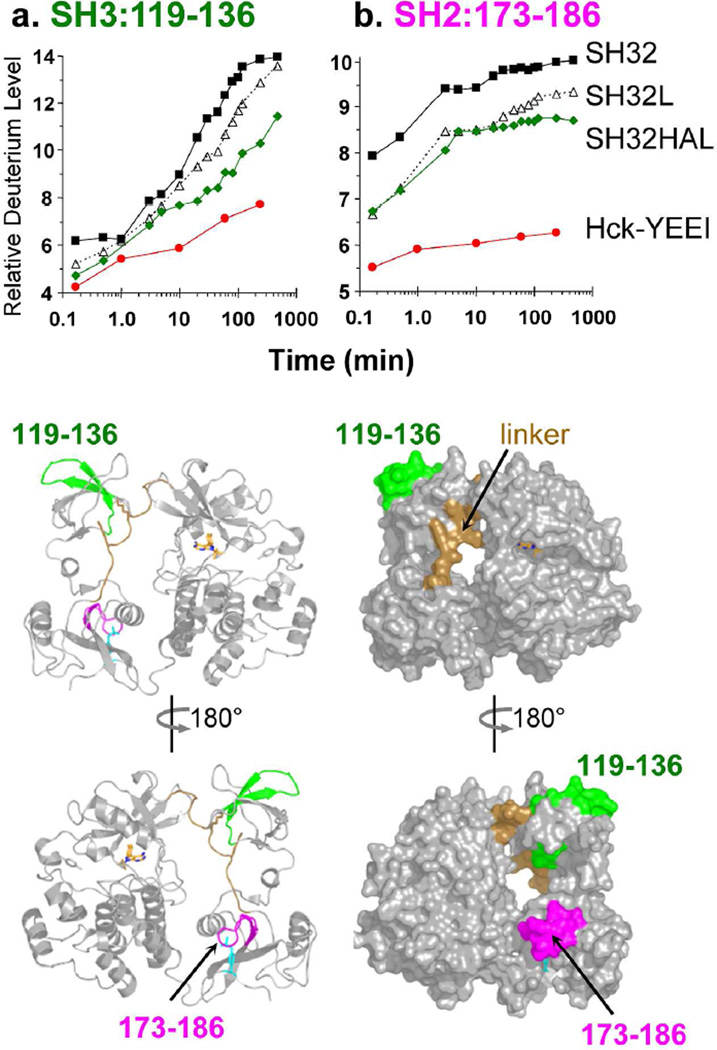
Figure 4.
Deuterium incorporation by the SH3 and SH2 domains of Hck-YEEI as well as shorter proteins derived from the regulatory region. Deuterium uptake curves are shown for peptic peptides derived from the SH3 domain (119–136, left) and the SH2 domain (173–186; right) for the SH32 (black squares), SH32L (open triangles), SH32HAL (green diamonds) and Hck-YEEI (red circles) proteins (see Figure 1). Amino acid sequences of each peptide are presented in Table S1. The location of each peptide is illustrated on ribbon and space-filling models of Hck-YEEI below the graphs; the models have been oriented to show both the ‘front’ and ‘back’ of Hck-YEEI.

