

Abstract
microRNAs and microRNA-independent RNA-binding proteins are 2 classes of post-transcriptional regulators that have been shown to cooperate in gene-expression regulation. We compared the genome-wide target sets of microRNAs and RBPs identified by recent CLIP-Seq technologies, finding that RBPs have distinct target sets and favor gene interaction network hubs. To identify microRNAs and RBPs with a similar functional context, we developed simiRa, a tool that compares enriched functional categories such as pathways and GO terms. We applied simiRa to the known functional cooperation between Pumilio family proteins and miR-221/222 in the regulation of tumor supressor gene p27 and show that the cooperation is reflected by similar enriched categories but not by target genes. SimiRa also predicts possible cooperation of microRNAs and RBPs beyond direct interaction on the target mRNA for the nuclear RBP TAF15. To further facilitate research into cooperation of microRNAs and RBPs, we made simiRa available as a web tool that displays the functional neighborhood and similarity of microRNAs and RBPs: http://vsicb-simira.helmholtz-muenchen.de.
Keywords: coregulation, functional similarity, microRNAs, RNA-binding proteins, web application.
Abbreviations
- miRNA
microRNA
- RBP
RNA-binding protein
Introduction
Post-transcriptional gene regulation
With the discovery of small regulatory RNAs the landscape of gene regulation changed dramatically: It became clear that the abundance of a gene's protein products is not only determined by mRNA processing and the resulting level of mRNA transcripts but also controlled by a whole new layer of regulatory elements.1
Post-transcriptional gene regulation has since been associated with almost all biological processes and diseases.2 MicroRNAs (miRNAs) were the most prominently analyzed species of post-transcriptional regulators but recently microRNA-independent RNA-binding proteins (RBPs) came into focus.3 Moreover, functional cooperation between miRNAs and RBPs has been shown in various processes such as cancer formation4 and angiogenesis.5
Recent advances in elucidating the functional roles of both classes were supported by new experimental technologies, which extract RNA-protein complexes followed by sequencing of the RNA: HITS-CLIP,6 PAR-CLIP,7 iCLIP8 and CLASH9 (specific for miRNAs). These methods facilitate global identification of functional binding sites of miRNAs and RNA-binding proteins.
A broad overview of the targeting capabilities is necessary to decipher the complex network of post-transcriptional gene regulation and ultimately define the functional targets of miRNAs and RBPs. Moreover, the global perspective on targeting allows to deduce functional impact beyond regulation of single targets by analyzing effects on functional modules such as signaling pathways.
miRNAs
miRNAs are small endogenous RNAs that bind to target mRNAs and down-regulate the expression by translational repression or degradation of the mRNA.1,10,11 It has been established that the majority of genes in most eukaryotes are post-transcriptionally regulated by miRNAs.2 To bind and regulate target mRNAs, miRNAs are first integrated into an AGO protein, which is part of the RNA-induced silencing complex (RISC).
The most important issue in miRNA research is to determine their functional targets. It has been shown that complementary binding between miRNA and target mRNA occurs mostly between nucleotide 2 and 8 of the miRNA (seed region).1,10-12 CLIP-Seq studies emphasized the importance of the seed region for a significant number of target sites but also demonstrated that non-canonical binding exists and accounts for a significant part of miRNA target sites.9
Experimental methods indicated that miRNAs have many (dozens to hundreds) targets and most mRNAs are bound by a miRNA at one stage. However, miRNAs regulate their targets only to a small extent and fine-tune protein expression.13,14 In addition, some parts of the cellular interaction network, such as signaling pathways, are targeted more frequently than others.15 The dynamics of miRNA-mediated down-regulation change over time16 and activity of miRNAs depends on the tissue-specific expression of mRNAs17 and competing binding sites.18 Thus the complete miRNA-target interaction network is very difficult to predict and the functional classification of miRNAs is still challenging.
RNA-binding proteins
miRNAs are able to guide a functional protein complex to an mRNA target. However, mRNAs interact with a multitude of other miRNA independent RNA-binding proteins during their life cycle from transcription through processing, splicing, relocalization, translation and degradation.3,19 While the involvement of regulatory proteins in mRNA biogenesis has long been known, CLIP-Seq studies expanded the genome-wide picture of RBP-mRNA interactions and protein occupancy of RNAs.20-22
Several hundred proteins are annotated with RNA-binding domains and therefore classified as RBPs.20,21,23 Interestingly, CLIP-Seq studies identified new RBPs not predicted by protein domains or homology.19 Many RBPs have thousands of targets although their biological function is not well understood. Similar to the difficulties in determining relevant miRNA targets, the binding mode and potential recognition sequences for RBPs are often not known. Secondary binding determinants such as stabilization by interaction partners or structure of the mRNA have been shown to be important for RBP binding.24
Cooperation of miRNAs and RNA-binding proteins
Interaction between miRNA and RBPs occurs via different modes of action: the 2 regulatory partners can act either cooperatively or competitively, directly or indirectly to change expression levels of their target. A cooperative regulation is where both regulatory partners work together, whereas a competitive regulation is where one regulator antagonizes the normal function of the other. A direct regulation occurs when both regulatory partners interact with the target simultaneously (usually with physically close binding sites on the RNA transcript). For the case of direct interactions, several computational studies analyzed the occupancy of mRNAs for proteins and miRNA/AGO complexes and showed that RBPs bind in close proximity to functional miRNA target sites.25,26 Supporting this notion, there is both computational and experimental evidence that miRNA-binding sites cluster in close proximity leading to increased down regulation of the target mRNA.27,28
A well-studied example for a direct interaction with miRNAs are human RNA-binding Pumilio proteins. Downregulation of the tumor suppressor gene p27 by miR-221 and miR-222 has been shown to promote cancer cell proliferation.29,30 Interestingly, the Pumilio protein PUM1 binds to p27 mRNA, which increases the accessibility of the target site of miR-221/222 by remodeling the mRNA structure.31,32 Because of low Pumilio levels, quiescent cells have a stable expression of p27 despite high levels of miR-221/222. Thus, both regulators are necessary to promote cancer cell proliferation. The same PUM1 protein has also been shown to bind genes of the pluripotency network in embryonic stem cells (ESC) and facilitate differentiation.33 Ablation of PUM1 hinders the exit from pluripotency and leads to severe defects in the differentiation process. In addition, there is growing evidence that miRNAs are necessary for ESC differentiation and regulation of the pluripotency network.34-37 The combined regulation of pluripotency genes is a prime example for possible interactions between miRNAs and RBPs in the fine-tuning of a complex biological process. Moreover, Pumilio proteins have also been shown to be associated with the miRNA-based regulation of the E2F3 oncogenes.38 There are also examples for competitive regulation where miRNA function is inhibited by RBPs. The RBP Dnd1 has been shown to inhibit the action of miR-21 on its target MSH2 and this regulation has also been implicated in in cancer devlopment.39 More experimental evidence for miRNA-RBP interactions is reviewed in Ciafre 2013.40
An indirect regulation occurs when a previous regulatory effect by one regulatory partner causes a subsequent regulation of target transcript levels by the second regulatory partner. In addition, an important consideration is the cellular location of each regulatory partner. miRNA-mediated regulation always takes place in the cytoplasm, whereas some RBPs can also act in the nucleus. Due to their spatial separation, coregulation between nuclear RBPs and miRNAs must be indirect.
For example, if splicing of a transcript is regulated by RBPs within the nucleus and the same transcript is later regulated by miRNAs, the gene might be indirectly coregulated. Moreover, a RBP can influence the expression level of a miRNA and thereby indirectly affect the expression level of the miRNA's target genes. To our knowledge there is currently no experimental evidence for indirect interaction on the same gene while experimental evidence supports functional regulation of miRNAs by RBPs.41
Identification of interaction via functional similarity of miRNA and RBP targets
While some functional interactions might be identified by comparing target sets, most will be difficult to identify due to incomplete targeting data. Even though recent CLIP methods perform better than computational methods, it has been shown that target detection depends on target mRNA expression and binding affinity of the used antibody.42 Moreover, the size of target sets can vary between replicates.42
Methods that analyze the functional context of target sets try to overcome these shortcomings by focusing on biological processes instead of individual target genes. In general, the most widely used techniques to define the functional context of gene sets are GO-term43 and pathway enrichment.15,17,44,45 They assume that the over-representation of genes in a pathways or GO term indicates a functional association. Next to enrichment methods, the challenge of deducing biological functions from miRNA/RBP target genes and binding sites was approached by inferring highly regulated targets based on binding site cooperativity27,28 and integrating miRNA targets with other omics data sets.46,47
In this study, we analyzed the combined activity of miRNAs and RBPs to infer functional cooperation between both classes of regulators. We focus on pathway and GO term enrichment to highlight the functional role of miRNAs and RBPs. By comparing the enriched categories for RBPs and miRNAs, we identified regulators with a similar biological function.
To facilitate research into combined action of RBPs and microRNAs, we developed simiRa, a web application that allows to find similar regulators for given input sets of microRNAs and RBPs. It was developed to act as a hypothesis-generator for wet lab scientists that run into common limitations of microRNA research: miRNAs have environment-specific functions and act in concert. To find miRNAs that influence a biological process, over-expression of single miRNAs is usually not sufficient. SimiRa extends the analysis beyond miRNAs and detects similar RBPs which might be necessary for miRNA effects and explain complex functional regulation. SimiRa is available at http://vsicb-simira.helmholtz-muenchen.de.
Results
Dataset
In this study, we used miRNA and RBP target sets identified with biochemical methods based on cross-linking of RNA-protein complexes followed by immunoprecipitation and sequencing (CLIP-Seq). Data for human RBPs was extracted from the doRiNA database48 and data for human miRNAs from StaRBase v2.49 Our compiled data set contains 19 RBPs and 366 miRNAs and a total of 14356 unique gene targets. 268 genes are only targeted by RBPs, 1496 are unique for miRNAs and 12592 are targeted by both. In general, we find more targets for RBPs (892 to 7153) than for miRNAs (161 to 1588).
RNA-binding proteins are located in different cell compartments
RBPs can be classified by their cellular localization. In the nucleus, they cannot directly interact with miRNAs on a target mRNA. In the cytoplasm, they can directly cooperate with a miRNA in regulating an mRNA. We analyzed the GO-terms associated with the 19 RBPs in order to elucidate their cellular localization (see Table 1 for an overview of relevant terms). The selected terms indicate the cellular localization either by biological process (e.g., splicing) or cellular component (nucleus or cytoplasm). We associated the 19 RBPs with their putative role in the mRNA life cycle (Fig. 1A). 13 are nuclear while 6 classify as cytoplasmic and all but 3 RBPs have been described in their function (Fig. 1B). We found no significant difference in the number of targets between nuclear and cytoplasmic RBPs (Wilcoxon rank-sum test, p-value 0.19).
Table 1.
Overview of all RNA-binding proteins and their associated GO terms
| RBP | Syn | Entrez ID | Cellular Component | Molecular Function | Biological Process | Ref | Method | # targets |
|---|---|---|---|---|---|---|---|---|
| ALKBH5 | ABH5 | 54890 | nucleus, nuclear speck | oxidative RNA demethylase activity | mRNA processing, mRNA export from nucleus | Baltz 2012 | PAR-CLIP | 918 |
| C17ORF85 | ELG | 55421 | — | nucleotide binding | - | Baltz 2012 | PAR-CLIP | 1419 |
| C22ORF28 | RTCB FAAP | 51493 | cytoplasm, tRNA-splicing ligase complex | ATP binding, metal ion binding, RNA ligase (ATP) activity | tRNA splicing | Baltz 2012 | PAR-CLIP | 3909 |
| CAPRIN1 | M11S1 GPIAP1 | 4076 | cytoplasm, cytoplasmic mRNA processing body, cytosol | RNA binding | regulates translation | Baltz 2012 | PAR-CLIP | 3891 |
| ELAVL1 | HUR | 1994 | nucleus, nucleoplasm, cytoplasm, cytosol | RNA binding, mRNA binding, protein binding, AU-rich element binding, protein kinase binding, mRNA 3′-UTR AU-rich region binding | mRNA stabilization, positive regulation of translation | Lebedeva 2011 | PAR-CLIP | 4942 |
| EWSR1 | EWS | 2130 | nucelus, cytoplasm, membrane | RNA binding, protein binding, calmodulin binding, zinc ion binding, metal ion binding | regulation of transcription | Hoell 2011 | PAR-CLIP | 3400 |
| FUS | TLS | 2521 | nucleus, nucleoplasm | nucleotide binding, RNA binding, protein binding, zinc ion binding, metal ion binding | RNA splicing, gene expression | Hoell 2011 | PAR-CLIP | 3981 |
| hnRNPC | C1 C2 | 3183 | nucleus, nucleoplasm, spliceosomal complex, ribonucleoprotein complex | nucleotide binding, protein binding, RNA binding | mRNA processing, RNA splicing, gene expression | König 2012 | iCLIP | 1428 |
| IGF2BP1 | IMP1 ZBP1 | 10642 | nucleus, cytoplasm, cytosol, plasma membrane | RNA binding, protein binding, mRNA 3′-UTR binding | gene expression, regulation of translation, RNA localization, CRD-mediated mRNA stabilization | Hafner 2010 | PAR-CLIP | 7423 |
| MOV10 | gb110 fSAP113 | 4343 | cytoplasm, cytosol, cytoplasmic mRNA processing body | RNA binding, protein binding, ATP binding, hydrolase activity | transcription, DNA-dependent, gene silencing by RNA, mRNA cleavage involved in gene silencing by miRNA | Sievers 2012 | PAR-CLIP | 3059 |
| PTB | PTBP1 HNRPI | 5725 | nucleus, nucleoplasm | RNA binding, protein binding, pre-mRNA binding | RNA splicing, mRNA processing, gene expression | Xue 2009 | CLIP-seq | 1939 |
| PUM2 | PUMH2 PUML2 | 23369 | cytoplasm, cytoplasmic stress granule | RNA binding, protein binding | regulation of translation | Hafner 2010 | PAR-CLIP | 4078 |
| QKI | QK Hqk | 9444 | nucleus, cytoplasm | RNA binding, protein binding | mRNA processing, RNA splicing, mRNA transport, regulation of translation, mRNA transport | Hafner 2010 | PAR-CLIP | 1601 |
| SFRS1 | ASF SF2 | 6426 | cytoplasm, nucleoplasm, nuclear speck, catalytic step 2 spliceosome | RNA binding, protein binding | gene expression, mRNA processing, mRNA splicing, termination of RNA polymerase II transcription | Sanford 2009 | CLIP-seq | 6340 |
| TAF15 | Npl3 RBP56 | 8148 | nucleus | DNA binding, RNA binding, protein binding | positive regulation of transcription, DNA-dependent | Hoell 2011 | PAR-CLIP | 2329 |
| TARDBP | ALS10 TDP-43 | 23435 | nucleus | RNA binding, protein binding | RNA splicing, mRNA processing, 3′-UTR-mediated mRNA stabilization | Tollervey 2011 | iCLIP | 2918 |
| TIA1 | WDM TIA-1 | 7072 | nucleus, cytoplasm | nucleotide binding, RNA binding, protein binding, poly(A) RNA binding, AU-rich element binding | negative regulation of translation, regulation of mRNA splicing, via spliceosome | Wang 2010 | iCLIP | 5217 |
| TIAL1 | TCBP TIAR | 7073 | nucleus, cytoplasm | RNA binding, AU-rich element binding | regulation of transcription from RNA polymerase II promoter | Wang 2010 | iCLIP | 6938 |
| ZC3H7B | RoXaN | 23264 | nucleus | protein binding, metal ion binding | virus-host interaction | Baltz 2012 | PAR-CLIP | 5728 |
Overview of the 19 RBPs from our compiled data set. The target sets were acquired with different CLIP-Seq methods. GO terms relevant for the cellular localization are shown. RNA-binding proteins have high numbers of targets, ranging from 918 to 7423.
Figure 1.
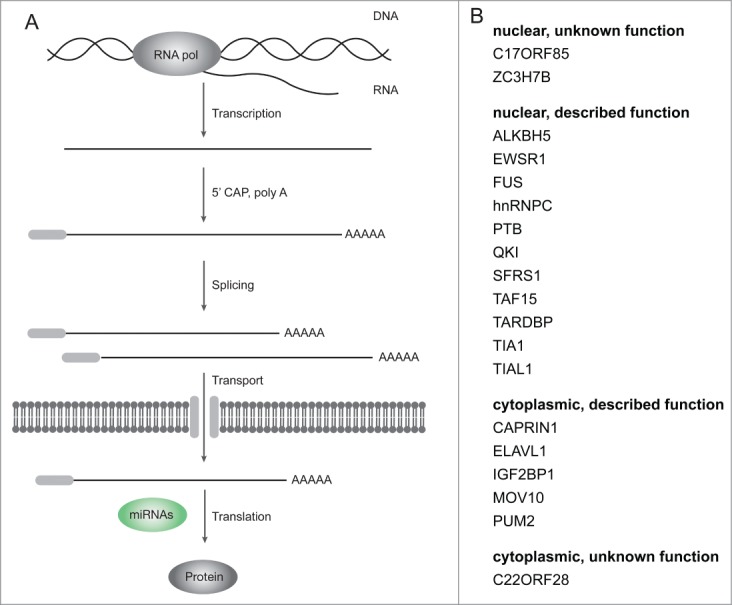
RNA-binding proteins act on all levels of the mRNA lifecycle. (A) The mRNA lifecycle from transcription to translation. Multiple steps of processing are necessary to produce mature mRNAs from nascent transcripts. miRNAs interact with their target mRNAs in the cytoplasm. (B) The 19 RNA-binding proteins used in this study are located on different levels of the mRNA lifecycle. Their putative localization was inferred from GO term associations and selected publications. 3 of the 19 RBPs have no described function.
RNA-binding proteins have distinct target sets
To quantify RBP target-set similarity, we use the Jaccard index (J) defined as the intersection of targets divided by their union (Fig. 2B, see methods). Even though some RBPs are characterized as global regulators of splicing (such as TARDBP), the target sets have a Jaccard index between J = 0.05 and J = 0.65, implying that many RBPs have distinct, non-overlapping target sets. We thus conclude that RBPs are likely to have different functional roles and are in this respect similar to miRNAs.
Figure 2.
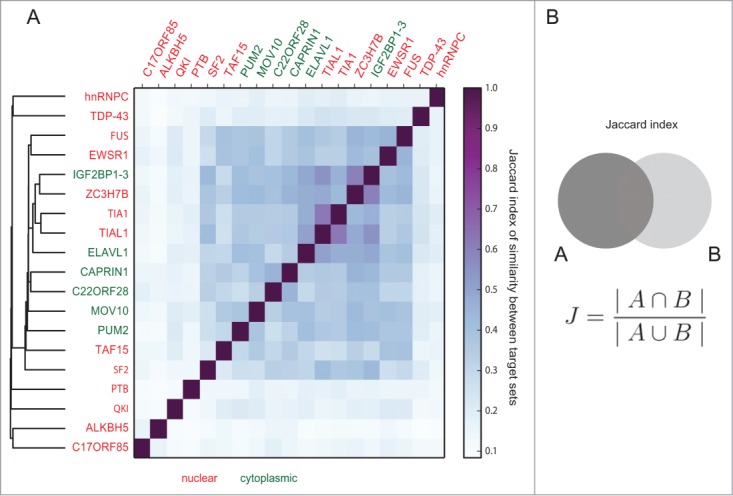
RNA-binding proteins have distinct sets of gene targets. (A) Pairwise comparison of the similarity of gene targets of all 19 RNA-binding proteins. While some RNA-binding proteins form clusters with a similarity of J = 0.65, many proteins have distinct target sets. This points toward functional differences and implicates that the proteins take part in different cellular processes. The similarity among nuclear (red) and cytoplasmic (green) RBPs is not different than between groups (Wilcoxon rank sum test, p-value = 0.42). (B) The similarity between 2 sets is calculated with the Jaccard index (size of intersection divided by the size of union).
We performed a hierarchical clustering of the similarity between RBP target sets (Fig. 2A). Interestingly, nuclear and cytoplasmic RBPs were not clearly separated with respect to their target genes in the hierarchical tree. The respective groups did not cluster together, and did not show a high overlap of target genes.
Genes are targeted by more RBPs and miRNAs than expected
In order to compare the global targeting properties of RBPs and miRNAs, we analyzed the number of RBPs and miRNAs targeting each gene (Fig. 3A). Real target-number distributions were compared to random samplings of targets by constructing artificial target sets following the distributions of targets for real RBPs and miRNAs (see methods).
Figure 3.

Genes are targeted by more miRNAs and RBPs than expected. (A) We mapped the gene target sets of all miRNAs and RBPs in our compiled data set onto a global gene interaction network constructed from STRING. (B) Number of targeting miRNAs and RBPs per gene with color coded density. Red lines indicate the 95 percentile from random samplings (C). 2034 genes are targeted by more miRNAs and RBPs than expected. Due to the lower number of RBPs in the data set, more genes are targeted only by miRNAs than vice versa. (C) Random samplings of gene targets for miRNAs and RBPs. The distribution is more narrow than found for real data. Less genes are targeted by high numbers of miRNAs and RBPs. Red lines show the 95 percentile located at 8 RBPs and 25 miRNAs per gene. (D) Network hubs are favored targets of RNA-binding proteins but not miRNAs. Genes were grouped by the number of targeting RBPs and miRNAs, respectively. We counted the number of protein-protein interactions of all genes in the groups. Genes that are targeted by many RBPs show an increased number of network interactions (denoted by ***, one sided Wilcoxon rank sum test, p-value = 0, see Methods). (E) For miRNAs, there is no correlation between the number of targeting entities and interactions within the gene interaction network.
Interestingly, we find that many genes are targeted by more or fewer RBPs and miRNAs than expected by chance. While random samplings result in 0 to 8 RBPs and 0 to 25 miRNAs per gene (Fig. 3C), real RBPs and miRNAs show a wider distribution (Fig. 3B). Most importantly, 15% of the genes are targeted by both more than 8 distinct RBPs and more than 25 distinct miRNAs (not counting multiple target sites for a single miRNA/RBP). Genes are targeted by both nuclear and cytoplasmic RBPs. The distribution of targeting RBPs per gene is similar for both groups and the correlation to miRNAs does not change.
We performed a GO term analysis of the 2034 highly targeted genes (targeted by more than 25 miRNAs and more than 8 RBPs) to elucidate the functional role. Among the significantly enriched GO terms are many top-level processes essential for regulatory mechanisms and cell cycle: Chromatin modification (224 associated genes, multiple testing corrected p-value 0.00052), cell cycle (341 associated genes, multiple testing corrected p-value 0.022), protein transport (276 associated genes, multiple testing corrected p-value 0.031), transcriptional regulation (173 associated genes, multiple testing corrected p-value 0.040) and gene expression (512 associated genes, multiple testing corrected p-value 0.042).
RNA-binding proteins prefer to target network hubs
As shown above, many genes are targeted by more RBPs and miRNAs than expected. We hypothesized that highly regulated genes have an important role in the regulatory network of a cell as has been shown before.50
We therefore constructed the complete human protein-protein interaction network from the STRING database (Fig. 3A), one of the most comprehensive interaction databases.51 We then calculated the degree (i.e., number of direct neighbors in the network) of all genes in the network and compared it to the number of RBPs (Fig. 3D) and miRNAs (Fig. 3E) targeting the gene. Interestingly, genes that are targeted by many RBPs have a significantly higher degree (Wilcoxon rank-sum test, p-value = 0, see Methods), while this is not the case for miRNAs.
Taking into account that genes belonging to essential processes are more tightly regulated, the preference of RBPs for network hubs suggests that RBPs confer regulatory specificity that augments the more global fine-tuning activity of miRNAs. In summary, the RBP targetome shows evidence for specific regulation of essential biological processes.
SimiRa: miRNA-RBP cooperation revealed by pathway and GO term association
To further analyze combined activity of miRNAs and RBPs within their functional context, we developed simiRa, a web tool that compares not only genes but also functional categories associated to both classes of regulators. By extending the analysis beyond binding of single genes, we are able to capture putative interactions between nuclear and cytoplasmic RBPs that cannot be explained by joint binding of a target mRNA. SimiRa performs an enrichment analysis to find significant functional categories and subsequently compares miRNAs and RBPs (Fig. 4A). We used KEGG pathways52 and GO-terms43 as functional categories to identify the biological context of miRNA and RBP gene target sets.
Figure 4.
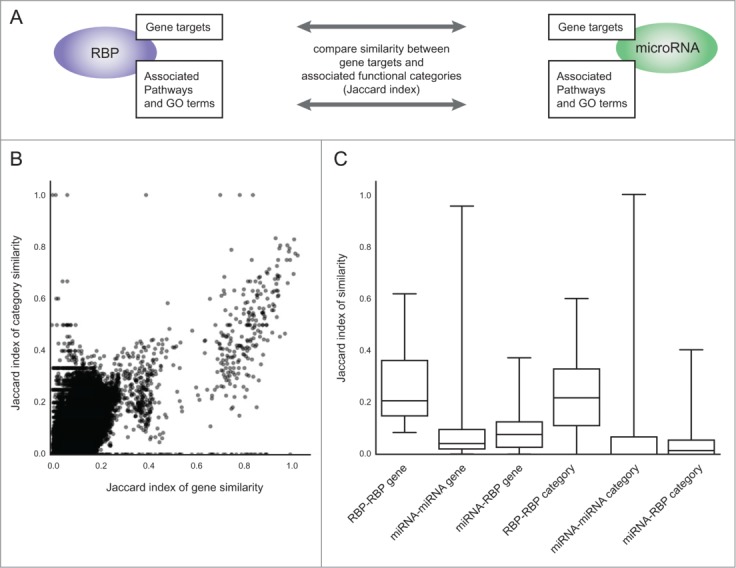
simiRa compares target gene and category similarities of miRNAs and RBPs. (A) simiRa compares RBPs and miRNAs based on the similarity (Jaccard index) of significantly enriched functional categories and gene targets. (B) Scatterplot of the Jaccard indexes for target gene similarity against category similarity of all pairwise comparisons between miRNAs and RBPs. (C) Distributions of pairwise similarities separated by RBP/RBP, miRNA/miRNA and miRNA/RBP comparisons for both target gene and category similarity.
We applied our compiled data set of 366 miRNAs and 19 RBPs on 285 KEGG pathways and 40624 GO terms, resulting in 15,749,965 comparisons. Of those, 16,582 are significant (with a multiple testing corrected p-value <0.05, see Methods). We compared miRNAs and RBPs by calculating the similarity of target genes and enriched categories using the Jaccard index (intersection divided by union, see Fig. 2B and Methods). The scatterplot of all gene similarities against all category similarities is shown in Figure 4B. Interestingly, the Pearson correlation between the target similarity and category similarity for all pairwise comparisons of RBPs and miRNAs is high (0.72). While there is a trend toward higher term similarity for increasing gene similarities, many outliers show a high similarity in either genes or terms. The correlation indicates a connection between targets and enriched categories but also highlights the fact that the category enrichment finds similarities that are less likely to be identified by similar target genes.
Since RBPs generally have more targets than miRNAs, the maximum Jaccard index between RBPs and miRNAs is lower than between members of each group. Indeed, distributions of similarities show that RBPs have a higher similarity with other RBPs than with miRNAs (Fig. 4C). For miRNA-miRNA and miRNA-RBP comparisons, the median gene similarity is higher than the median category similarity. miRNA-miRNA similarities show a distribution with low median and few very high similarities. Many miRNAs are grouped into families with similar seed-sequences and target binding characteristics (such as miR-221 and miR-222), thus explaining highly similar outliers not found for RBPs.
From the top 100 RBP-miRNA pairs in terms of similar enriched categories, only 53 are also in the top 100 in terms of similar target genes. The other 47 show a disparity between their target gene overlap and enriched functional categories. In summary, comparing enriched functional categories identifies new potential interactions between miRNAs and RBPs that are not obvious from gene targets.
To ease further research into this topic, we made simiRa available as a user-friendly web-tool that allows searching for similar miRNAs and RBPs based on common targets and common enriched functional categories (Fig. 5). The basic workflow starts with the input of an miRNA or RBP. The result is presented as a network of similar miRNAs and RBPs. Search settings for the Jaccard index cut-off can be set individually for gene and category based similarity search. The default settings show term similarities with J > 0.2 and gene similarities with J > 0.3 (see Fig. 4 for the distributions of Jaccard indexes). The edges of the presented network denote similar gene targets or enriched categories, respectively. The user can change the cutoff for similar miRNAs/RBP, leading to a dense or sparse similarity network.
Figure 5.
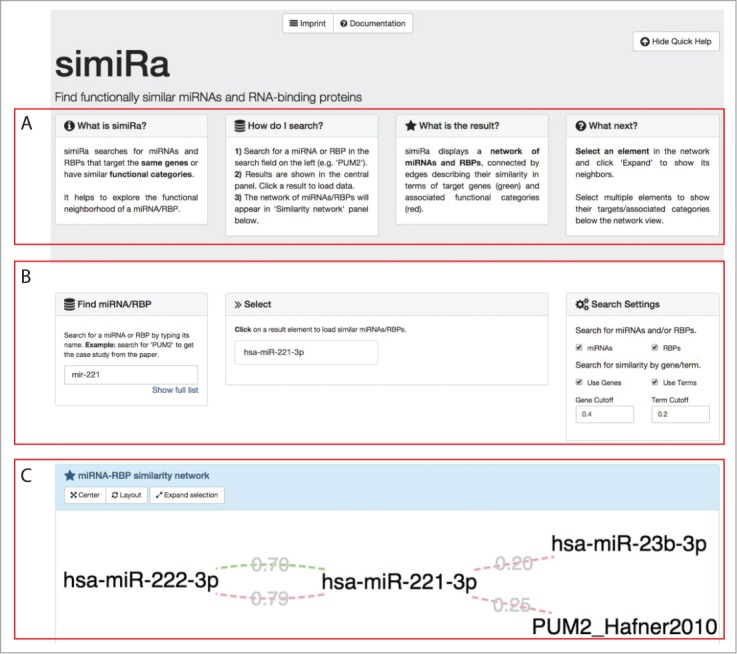
SimiRa – a web application to identify similar miRNAs and RBPs. (A) Introduction and quick help for simiRa is provided on the front page. (B) The user starts by searching for an miRNA or RBP in the search field in the ‘Find miRNA/RBP’ panel on the left. The ‘Show full list’ button opens a list of all miRNAs and RBPs. A fuzzy search is carried out upon typing of a miRNA/RBP name and results are shown in the ‘Select’ panel in the center. Clicking on a miRNA/RBP loads the network view of similar miRNAs/RBPs. Settings can be adjusted in the ‘Search settings’ panel on the right. (C) The resulting similar miRNAs/RBPs are displayed in a network visualization in the ‘miRNA-RBP similarity network’ panel. Similarity in gene targets is indicated by green edges, common enriched categories are denoted by red edges. The user can zoom by scrolling and pan by dragging. Targets and enriched categories of selected nodes are shown below the network panel. The network can be extended by selecting a node and clicking ‘Expand selection’. This allows for the stepwise exploration of the functional neighborhood of a miRNA/RBP of interest.
In a next step, the user can select one or more nodes in the network view to see the targets and enriched categories for the selection. When only one node is selected, all targets/categories are shown. When more nodes are selected, the common targets/categories are shown. This allows for a fine-grained overview of the targeting and functional context for subsets of the similarity network. The network can be extended around single nodes. This gives the user the opportunity to find more interesting candidates.
Case study: the interaction of Pumilio and miR-221/222 is reflected by enriched categories
Pumilio family proteins (e.g., PUM1 and PUM2) are necessary for the regulatory function of miR-221/222 on the tumor suppressor gene p27. Upon binding of PUM1, the binding sites of miR-221 and miR-222 become accessible. PUM2 shows similar effects.32 This cooperation is a prime example for combined activity of miRNAs and RBPs. The cooperation is not limited to p27: there is evidence for a deeper involvement of both Pumilio proteins and miR-221/222 in the cell cycle mis-regulation leading to cancer progression.4,38
In human, miR-221 and miR-222 have 90% identical targets with a total union of ∼1200 targets. The dataset of 19 RBPs contains PUM2 with 4078 targets. PUM2 and miR-221/222 share only 632 target genes, a similarity of J = 0.16 and J = 0.17, respectively (Fig. 6A).
Figure 6.
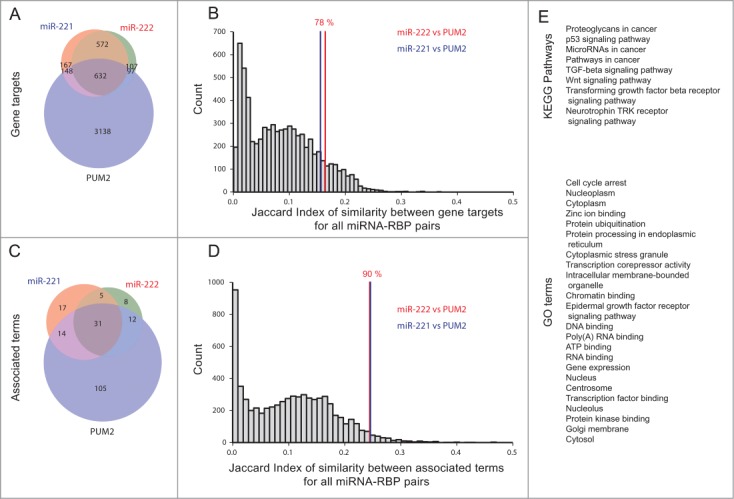
SimiRa case study. The interaction of miR-221/222 and Pumilio is reflected by enriched pathways but not gene targets. (A) The overlap of gene targets of miR-221/222 and Pumilio Protein 2 (PUM2) is 632, containing only one fifth of all targets of PUM2. (B) The pairwise overlaps of miR-221/PUM2 and miR-222/PUM2 rank at 78% of the overall distribution of miRNA/RBP target similarities. (C) When considering enriched terms (Pathways and GO terms), the similarity between miR-221/222 and PUM2 is larger compared to gene targets. (D) The pairwise similarities of miR-221/PUM2 and miR-222/PUM2 rank in the top 10%, indicating a functional relationships beyond their gene targets. (E) Significantly enriched terms for miR-221/222 and PUM2 (corrected p-value <0.05, see methods). The terms are associated with cancer, cancer signaling and transcriptional activity (terms are sorted by p-value). The genes associated with miR-221/222 and PUM2 can be retrieved from the simiRa web application.
In order to compare PUM2 and miR-221/222 to other miRNAs and RBPs, we calculated the similarity of gene targets for all pairs of miRNAs and RBPs using the Jaccard index (see methods). The histogram of the distribution of all pairwise similarities between miRNAs and RBPs shows that most pairs have a Jaccard index < 0.2. Interestingly, PUM2/miR-221 and PUM2/miR-222 are not in the top quartile of miR-RBP pairs. Despite their known functional cooperation, they rank at at the 72.9 percentile of the distribution (Fig. 6B). When only considering target sets, PUM2 and miR-221/222 would likely not have been identified as candidates for an interaction. In comparison, the similarity of enriched functional categories between PUM2 and miR-221/222 is higher than the overlap of gene targets. 57 of 192 enriched categories are shared between PUM2 and at least one miRNA. 31 categories are shared by all 3 regulators (Fig. 6C). We compared all miRNA and RBP pairs for their overlap in enriched categories. In general, the similarity of enriched categories is slightly higher than for gene targets. Here, PUM2/miR-221 and PUM2/miR-222 are in the top 10% of all pairwise similarities between miRNAs and RBPs (Fig. 6D).
Thus, a comparison of functional categories renders PUM2 and miR-221/222 as potential candidates for a functional interaction that would likely be overlooked when only comparing individual target sets. A closer look at the shared categories also highlights the relevance for cancer: We find cancer pathways and signaling cascades commonly functional in the formation of cancer (Fig. 6E).
Case study: candidates for functional interactions between nuclear RBPs and miRNAs
The TAF15 protein is an interesting candidate for functional analysis: Together with FUS and EWS it constitutes the FET (FUS/EWS/TAF15) protein family53 that was first discovered as genes frequently translocating in human sarcomas and leukemias.54 Later, the family members have been shown to participate in the transcriptional machinery as well as various steps of mRNA processing, such as splicing and transport.55,56 While their exact role remains unclear, recent publications point toward cell-type specific expression and function as well as differences between FUS, EWS and TAF15.57
TAF15 is necessary for the cell cycle and proliferation but the mechanism remains elusive. While direct targets have not been validated outside of CLIP-Seq studies, it has recently been reported that TAF15 cooperates indirectly with miR-17-5p and miR-20a-5p to repress the cell-cycle gene CDKN1A/p21 by increasing expression levels of the mature miRNAs, which subsequently downregulate CDKN1A/p21.41 Upon depletion of TAF15, the levels of the miRNAs decrease, CDKN1A/p21 increases and proliferation is impaired. Again, we found that TAF15 and both miRNAs are similar in terms of enriched categories (∼0.22, rank 94%) and less similar in terms of targets (∼0.15, rank 83%). Notably, other miRNAs have even higher similarities to TAF15. Those miRNAs are candidates that either collaborate with TAF15 in an indirect fashion like miR-17-5p/miR-20a-5p or they could act on the same targets as TAF15, leading to either cooperative activity or competitive inhibition of the miRNA and TAF15. The top miRNAs showing similar functional categories as TAF15 are miR-590-3p (J = 0.33) and miR-495-3p (J = 0.29). MiR-495 has been shown to inhibit differentiation of human mesenchymal stem cells58 and mouse embryonic stem cells,36 pointing toward a similar regulatory loop as for miR-17-5p/miR-20a-5p. MiR-590-3p, on the other hand, is so far not associated with cell cycle progression and is thus a highly interesting candidate for functional studies in combination with TAF15.
Ballarino et al.41 found candidate miRNAs for an interaction with TAF15 by manually screening the small set of validated binding sites from miRTarBase.59 Functionally similar miRNAs identified by our large-scale approach are interesting candidates to extend the TAF15/miRNA interaction network by direct and indirect cooperation.
Discussion
The field of RBPs is growing rapidly since CLIP-Seq studies identified global binding sites. Recently, such an approach identified 300 new and previously uncharacterized RBPs.21 It is still unclear to what extend RBPs carry out specific regulatory functions. Some RBPs might be house-keeping genes that mostly have a structural role in e.g., transport or decay of mRNAs. To answer this question and provide first insight into global targeting properties, we showed that genes are regulated by very different numbers of RBPs. Moreover, RBPs target network hubs. This indicates that they indeed have a more specific rather than global house-keeping function.
To provide a basis for experiments investigating the combined activity of multiple miRNAs and/or RBPs, we have developed simiRa. The intuitive interface allows for easy exploration of the functional neighborhood of a miRNA or RBP. We expect that most users will start the search with a set of miRNAs/RBPs they are investigating in the biological context of interest. From this starting point, simiRa provides useful candidates for functional cooperation partners which might act in concert to carry out a biological function. For example, Ballarino et al.41 identified candidate miRNAs for combined activity with TAF15 by manually screening the small set of validated binding sites from miRTarBase.59 Using our large-scale approach, we are able to identify a lot more potential partners that might function in the same fashion as miR-17-5p and miR-20a-5p.
When comparing PUM2 and miR-221/222, the analysis of enriched functional categories points toward a combined activity in a cancer context that has been shown experimentally. For TAF15, we find miRNAs that might cooperate in an indirect regulatory loop. Considering combinations of multiple miRNAs and RBPs with a similar functional background could prove beneficial in experimental settings where researches look for new regulators of a biological process and single miRNAs did not show the desired effects. By either using more miRNAs or adding RBPs to the experimental set-up, researchers could potentially identify new regulatory elements.
The next step in analyzing combined activity of different post-transcriptional regulators is functional testing: Researches working with miRNAs could benefit from identifying RBPs as potential interaction partners. Cell-type specific miRNA activity has been explained by expression of competing endogenous RNAs (ceRNAs) that fish miRNAs and thereby repress their function on a specific cellular environment.18 RBPs could be another way of creating tissue-specific effects. If a miRNA requires a RBP to function or if the regulatory effect is increased in the presence of a RBP, the expression of this RBP confers specificity to the miRNA function. Similar to the PUM1/miR-221/222 regulation of p27, RBPs could explain variance in target regulation between different cell types.
We have previously developed miTALOS, a web-tool to analyze the signaling pathways associated to single miRNAs.17 SimiRa extends the functionality of miTALOS by not only considering a single miRNA and their function but rather allowing to explore the functional neighborhood of a single regulatory component. It thus extends our tool box of miRNA-related applications that aim at providing the functional context of miRNAs and new candidates for functional testing.
The study presented here addresses an unresolved issue: How is the complex process of post-transcriptional gene regulation structured? miRNAs have hundreds of targets and only small effect sizes. A miRNA does not have a unique function but is part of a dense regulatory network whose output depends on the cellular environment. The more we know about the elements and connections within this network, the better our predictions of miRNA function become. By adding RNA-binding proteins to the mix, we extend the regulatory network with a new type of node. Comparing miRNAs and RBPs by their enriched categories takes a step back from individual target relationships and reveals the global picture of miRNA/RBP co-targeting.
Methods
CLIP-Seq data sets
We used miRNA targets provided by starBase v2.0,49 a database that collects and integrates CLIP-Seq experiments. We downloaded the complete set of human miRNA target sites with the minimal requirement of one supporting experiment. The data set contains 366 miRNAs with 536888 miRNA-mRNA interactions (i.e., binding sites). RBP binding sites were extracted from the doRiNA database.48
We calculated the enrichment of gene sets (miRNA and RBP targets) on gene sets from 285 KEGG pathways52 and 40624 GO terms.43 KEGG pathways were obtained via the KEGG REST API (http://www.kegg.jp/kegg/rest/). GO terms were downloaded from http://www.geneontology.org/GO.downloads.ftp.cvs.shtml.
Similarity between miRNAs and RBPs
We define the similarity of 2 non-empty sets A and B using the Jaccard index (number of elements in intersection divided by number of elements in union, [0,1]).
Generation of target set null model
To compare distributions of miRNAs and RBPs targeting genes we sampled artificial target sets from all human genes (as defined in the NCBI Gene database) in the same number as real miRNAs and RBPs in the respective data set. To avoid degree bias, we constructed a bipartite graph linking miRNAs/RBPs to genes and resampled the edges while preserving the degree of miRNA/RBP nodes. Thus, distribution of the number of target per entity resembles real miRNAs and RBPs. We performed 100 sampling runs and averaged over all results.
Protein-protein interaction network
We used protein-protein interaction data from he STRING 9.1 database. Data was downloaded from http://string-db.org. We used all interactions with a combined score >0.75. For a description of the database and score see Von Mering et al.60 and Szklarczyk et al.61
Statistics
Enrichment of a miRNA/RBP (X) in a GO term or pathway (C) was calculated by constructing a 2×2 cross table
| Category C | ||
|---|---|---|
| miRNA/RBP X | XC | Xn |
| Cn | U | |
where XC is the number of gene targets of X in C, Cn is the number of genes in C not targeted by X, Xn is the number of targets of X not in C and the background U is the union of all target genes and all genes in the tested category without XC, Xn and Cn.
The enrichment score E is calculated as the odds ratio of X and C. E describes the dependence of variables X and C, E > 1 indicates an over-representation of targets of X in the category C:
P-values for the enrichment were obtained with Fisher's exact test62 using the ‘stats.fisher_exact’ module from the SciPy Python package (v0.14.1). To control the false discovery rate (rate of type I errors) in the enrichment analysis, all p-values were corrected with the Benjamini-Hochberg procedure63 using the ‘sandbox.stats.multicomp.multipletests’ module from the statsmodels Python package (v0.5.0). Results with a an enrichment sore E > 1 and a corrected p-value < 0.05 were considered enriched.
The Wilcoxon rank-sum test was employed to test for difference in distributions of 2 samples,64 using the ‘stats.ranksum’ module from the SciPy Python package (v0.14.1). P-values of 0 occur due to occur due to the limits in floating point precision and represent p-values smaller than 10−238.
simiRa web-tool
The simiRa web frontend is implemented with the AngularJS framework and Cytoscape.js for the network view. The backend is implemented in Python using the SciPy stack for calculations and the Flask web framework for the REST API. A neo4j 2.2.2 community edition database is used to integrate data for miRNA/RBP targets and pathways/GO terms.
Disclosure of Potential Conflicts of Interest
No potential conflicts of interest were disclosed.
Funding
This work was funded by the European Research Council (Latent Causes, 259294); the Deutsche Forschungsgemeinschaft (InKoMBio, SPP 1395); the Helmholtz Alliance ICEMED-Imaging and Curing Environmental Metabolic Diseases; the Initiative and Networking Fund of the Helmholtz Association.
References
- 1.Bartel DP. MicroRNAs: target recognition and regulatory functions. Cell. 2009; 136(2):215-33; PMID:19167326; http://dx.doi.org/ 10.1016/j.cell.2009.01.002] [DOI] [PMC free article] [PubMed] [Google Scholar]
- 2.Friedman RC, Farh KK-H, Burge CB, Bartel DP. Most mammalian mRNAs are conserved targets of microRNAs. Genome Res 2009; 19(1):92-105; PMID:18955434; http://dx.doi.org/ 10.1101/gr.082701.108 [DOI] [PMC free article] [PubMed] [Google Scholar]
- 3.Glisovic T, Bachorik JL, Yong J, Dreyfuss G. RNA-binding proteins and post-transcriptional gene regulation. FEBS Lett 2008; 582(14):1977-86; PMID:18342629; http://dx.doi.org/ 10.1016/j.febslet.2008.03.004 [DOI] [PMC free article] [PubMed] [Google Scholar]
- 4.Van Kouwenhove M, Kedde M, Agami R. MicroRNA regulation by RNA-binding proteins and its implications for cancer. Nat Rev Cancer 2011; 11(9):644-56; PMID:21822212; http://dx.doi.org/ 10.1038/nrc3107 [DOI] [PubMed] [Google Scholar]
- 5.Chang S-H, Hla T. Gene regulation by RNA binding proteins and microRNAs in angiogenesis. Trends Mol Med 2011; 17(11):650-658; PMID:21802991; http://dx.doi.org/ 10.1016/j.molmed.2011.06.008 [DOI] [PMC free article] [PubMed] [Google Scholar]
- 6.Chi SW, Zang JB, Mele A, Darnell RB. Argonaute HITS-CLIP decodes microRNA-mRNA interaction maps. Nature 2009; 460(7254):479-86; PMID:19536157 [DOI] [PMC free article] [PubMed] [Google Scholar]
- 7.Hafner M, Landthaler M, Burger L, Khorshid M, Hausser J, Berninger P, Rothballer A, Ascano M Jr, Jungkamp AC, Munschauer M, et al.. Transcriptome-wide identification of RNA-binding protein and microRNA target sites by PAR-CLIP. Cell 2010; 141(1):129-41; PMID:20371350; http://dx.doi.org/ 10.1016/j.cell.2010.03.009 [DOI] [PMC free article] [PubMed] [Google Scholar]
- 8.König J, Zarnack K, Rot G, Curk T, Kayikci M, Zupan B, Turner DJ, Luscombe NM, Ule J. iCLIP reveals the function of hnRNP particles in splicing at individual nucleotide resolution. Nat Struct Mol Biol 2010; 17(7):909-15; PMID:20601959; http://dx.doi.org/ 10.1038/nsmb.1838 [DOI] [PMC free article] [PubMed] [Google Scholar]
- 9.Helwak A, Kudla G, Dudnakova T, Tollervey D. Mapping the human miRNA interactome by CLASH reveals frequent noncanonical binding. Cell 2013; 153(3):654-65; PMID:23622248; http://dx.doi.org/ 10.1016/j.cell.2013.03.043 [DOI] [PMC free article] [PubMed] [Google Scholar]
- 10.Brodersen P, Voinnet O. Revisiting the principles of microRNA target recognition and mode of action. Nat Rev Mol Cell Biol 2009; 10(2):141-8; PMID:19145236; http://dx.doi.org/ 10.1038/nrm2619 [DOI] [PubMed] [Google Scholar]
- 11.Fabian MR, Sonenberg N, Filipowicz W. Regulation of mRNA translation and stability by microRNAs. Annu Rev Biochem 2010; 79:351-79; PMID:20533884; http://dx.doi.org/ 10.1146/annurev-biochem-060308-103103 [DOI] [PubMed] [Google Scholar]
- 12.Thomas M, Lieberman J, Lal A. Desperately seeking microRNA targets. Nat Struct Mol Biol 2010; 17(10):1169-74; PMID:20924405; http://dx.doi.org/ 10.1038/nsmb.1921 [DOI] [PubMed] [Google Scholar]
- 13.Baek D, Villén J, Shin C, Camargo FD, Gygi SP, Bartel DP. The impact of microRNAs on protein output. Nature 2008; 455(7209):64-71; PMID:18668037; http://dx.doi.org/ 10.1038/nature07242 [DOI] [PMC free article] [PubMed] [Google Scholar]
- 14.Selbach M, Schwanhäusser B, Thierfelder N, Fang Z, Khanin R, Rajewsky N. Widespread changes in protein synthesis induced by microRNAs. Nature 2008; 455(7209):58-63; PMID:18668040; http://dx.doi.org/ 10.1038/nature07228 [DOI] [PubMed] [Google Scholar]
- 15.Kowarsch A, Marr C, Schmidl D, Ruepp A, Theis FJ. Tissue-specific target analysis of disease-associated microRNAs in human signaling pathways. Morris RJ, ed. PLoS One 2010; 5(6):e11154; PMID:20614023; http://dx.doi.org/ 10.1371/journal.pone.0011154 [DOI] [PMC free article] [PubMed] [Google Scholar]
- 16.Hock S, Ng Y-K, Hasenauer J, Wittmann D, Lutter D, Trümbach D, Wurst W, Prakash N, Theis FJ. Sharpening of expression domains induced by transcription and microRNA regulation within a spatio-temporal model of mid-hindbrain boundary formation. BMC Syst Biol 2013; 7:48; PMID:23799959; http://dx.doi.org/ 10.1186/1752-0509-7-48 [DOI] [PMC free article] [PubMed] [Google Scholar]
- 17.Kowarsch A, Preusse M, Marr C, Theis FJ. miTALOS: analyzing the tissue-specific regulation of signaling pathways by human and mouse microRNAs. RNA 2011; 17(5):809-19; PMID:21441347; http://dx.doi.org/ 10.1261/rna.2474511 [DOI] [PMC free article] [PubMed] [Google Scholar]
- 18.Tay Y, Rinn J, Pandolfi PP. The multilayered complexity of ceRNA crosstalk and competition. Nature 2014; 505(7483):344-52; PMID:24429633; http://dx.doi.org/ 10.1038/nature12986 [DOI] [PMC free article] [PubMed] [Google Scholar]
- 19.Müller-McNicoll M, Neugebauer KM. How cells get the message: dynamic assembly and function of mRNA-protein complexes. Nat Rev Genet 2013; 14(4):275-87; PMID:23478349; http://dx.doi.org/ 10.1038/nrg3434 [DOI] [PubMed] [Google Scholar]
- 20.Baltz AG, Munschauer M, Schwanhäusser B, Vasile A, Murakawa Y, Schueler M, Youngs N, Penfold-Brown D, Drew K, et al.. The mRNA-bound proteome and its global occupancy profile on protein-coding transcripts. Mol Cell 2012; 46(5):674-90; PMID:22681889; http://dx.doi.org/ 10.1016/j.molcel.2012.05.021 [DOI] [PubMed] [Google Scholar]
- 21.Castello A, Fischer B, Eichelbaum K, Horos R, Beckmann BM, Strein C, Davey NE, Humphreys DT, Preiss T, Steinmetz LM, et al.. Insights into RNA biology from an atlas of mammalian mRNA-binding proteins. Cell 2012; 149(6):1393-406; PMID:22658674; http://dx.doi.org/ 10.1016/j.cell.2012.04.031 [DOI] [PubMed] [Google Scholar]
- 22.Ray D, Kazan H, Cook KB, Weirauch MT, Najafabadi HS, Li X, Gueroussov S, Albu M, Zheng H, Yang A, et al.. A compendium of RNA-binding motifs for decoding gene regulation. Nature 2013; 499(7457):172-7; PMID:23846655; http://dx.doi.org/ 10.1038/nature12311 [DOI] [PMC free article] [PubMed] [Google Scholar]
- 23.Gerstberger S, Hafner M, Tuschl T. A census of human RNA-binding proteins. Nat Rev Genet 2014; 15(12):829-845; PMID:25365966; http://dx.doi.org/ 10.1038/nrg3813 [DOI] [PMC free article] [PubMed] [Google Scholar]
- 24.Mitchell SF, Parker R. Principles and properties of eukaryotic mRNPs. Mol Cell 2014; 54(4):547-58; PMID:24856220; http://dx.doi.org/ 10.1016/j.molcel.2014.04.033 [DOI] [PubMed] [Google Scholar]
- 25.Jacobsen A, Wen J, Marks DS, Krogh A. Signatures of RNA binding proteins globally coupled to effective microRNA target sites. Genome Res 2010; 20(8):1010-9; PMID:20508147; http://dx.doi.org/ 10.1101/gr.103259.109 [DOI] [PMC free article] [PubMed] [Google Scholar]
- 26.Jiang P, Singh M, Coller H a. Computational assessment of the cooperativity between RNA binding proteins and MicroRNAs in Transcript Decay. PLoS Comput Biol 2013; 9(5):e1003075; PMID:23737738; http://dx.doi.org/ 10.1371/journal.pcbi.1003075 [DOI] [PMC free article] [PubMed] [Google Scholar]
- 27.Broderick JA, Salomon WE, Ryder SP, Aronin N, Zamore PD. Argonaute protein identity and pairing geometry determine cooperativity in mammalian RNA silencing. RNA 2011:1858-1869; PMID:21878547; http://dx.doi.org/ 10.1261/rna.2778911 [DOI] [PMC free article] [PubMed] [Google Scholar]
- 28.Rinck A, Preusse M, Laggerbauer B, Lickert H, Engelhardt S, Theis FJ. The human transcriptome is enriched for miRNA-binding sites located in cooperativity-permitting distance. RNA Biol 2013; 10(7):1125-35; PMID:23696004; http://dx.doi.org/ 10.4161/rna.24955 [DOI] [PMC free article] [PubMed] [Google Scholar]
- 29.Galardi S, Mercatelli N, Giorda E, Massalini S, Frajese GV, Ciafrè SA, Farace MG. miR-221 and miR-222 expression affects the proliferation potential of human prostate carcinoma cell lines by targeting p27Kip1. J Biol Chem 2007; 282(32):23716-24; PMID:17569667; http://dx.doi.org/ 10.1074/jbc.M701805200 [DOI] [PubMed] [Google Scholar]
- 30.Le Sage C, Nagel R, Egan DA, Schrier M, Mesman E, Mangiola A, Anile C, Maira G, Mercatelli N, Ciafrè SA, et al.. Regulation of the p27(Kip1) tumor suppressor by miR-221 and miR-222 promotes cancer cell proliferation. EMBO J 2007; 26(15):3699-708; PMID:17627278; http://dx.doi.org/ 10.1038/sj.emboj.7601790 [DOI] [PMC free article] [PubMed] [Google Scholar]
- 31.Galgano A, Forrer M, Jaskiewicz L, Kanitz A, Zavolan M, Gerber AP. Comparative analysis of mRNA targets for human PUF-family proteins suggests extensive interaction with the miRNA regulatory system. PLoS One 2008; 3(9):e3164; PMID:18776931; http://dx.doi.org/ 10.1371/journal.pone.0003164 [DOI] [PMC free article] [PubMed] [Google Scholar]
- 32.Kedde M, van Kouwenhove M, Zwart W, Oude Vrielink JAF, Elkon R, Agami R. A Pumilio-induced RNA structure switch in p27-3′ UTR controls miR-221 and miR-222 accessibility. Nat. Cell Biol 2010; 12(10):1014-20; PMID:20818387; http://dx.doi.org/ 10.1038/ncb2105 [DOI] [PubMed] [Google Scholar]
- 33.Leeb M, Dietmann S, Paramor M, Niwa H, Smith A. Genetic exploration of the exit from self-renewal using haploid embryonic stem cells. Cell Stem Cell 2014; 14(3):385-93; PMID:24412312; http://dx.doi.org/ 10.1016/j.stem.2013.12.008 [DOI] [PMC free article] [PubMed] [Google Scholar]
- 34.Gangaraju VK, Lin H. MicroRNAs: key regulators of stem cells. Nat Rev Mol Cell Biol 2009; 10(2):116-25; PMID:19165214; http://dx.doi.org/ 10.1038/nrm2621 [DOI] [PMC free article] [PubMed] [Google Scholar]
- 35.Xu N, Papagiannakopoulos T, Pan G, Thomson JA, Kosik KS. MicroRNA-145 regulates OCT4, SOX2, and KLF4 and represses pluripotency in human embryonic stem cells. Cell 2009; 137(4):647-58; PMID:19409607; http://dx.doi.org/ 10.1016/j.cell.2009.02.038 [DOI] [PubMed] [Google Scholar]
- 36.Yang D, Lutter D, Burtscher I, Uetzmann L, Theis FJ, Lickert H. miR-335 promotes mesendodermal lineage segregation and shapes a transcription factor gradient in the endoderm. Development 2014; 141(3):514-25; PMID:24449834; http://dx.doi.org/ 10.1242/dev.104232 [DOI] [PubMed] [Google Scholar]
- 37.Kumar RM. Deconstructing transcriptional heterogeneity in pluripotent stem cells. Nature 2014; 516:55-61; PMID:25471879; http://dx.doi.org/ 10.1038/nature13920 [DOI] [PMC free article] [PubMed] [Google Scholar]
- 38.Miles WO, Tschöp K, Herr A, Ji J-Y, Dyson NJ. Pumilio facilitates miRNA regulation of the E2F3 oncogene. Genes Dev 2012; 26(4):356-68; PMID:22345517; http://dx.doi.org/ 10.1101/gad.182568.111 [DOI] [PMC free article] [PubMed] [Google Scholar]
- 39.Bhandari A, Gordon W, Dizon D, Hopkin AS, Gordon E, Yu Z, Andersen B. The Grainyhead transcription factor Grhl3/Get1 suppresses miR-21 expression and tumorigenesis in skin: modulation of the miR-21 target MSH2 by RNA-binding protein DND1. Oncogene 2013; 32(12):1497-507; PMID:22614019; http://dx.doi.org/ 10.1038/onc.2012.168 [DOI] [PMC free article] [PubMed] [Google Scholar]
- 40.Ciafrè SA, Galardi S. microRNAs and RNA-binding proteins: a complex network of interactions and reciprocal regulations in cancer. RNA Biol 2013; 10(6):934-942; PMID:23696003; http://dx.doi.org/ 10.4161/rna.24641 [DOI] [PMC free article] [PubMed] [Google Scholar]
- 41.Ballarino M, Jobert L, Dembélé D, de la Grange P, Auboeuf D, Tora L. TAF15 is important for cellular proliferation and regulates the expression of a subset of cell cycle genes through miRNAs. Oncogene 2013; 32(39):4646-55; PMID:23128393; http://dx.doi.org/ 10.1038/onc.2012.490 [DOI] [PubMed] [Google Scholar]
- 42.Jungkamp AC, Stoeckius M, Mecenas D, Grün D, Mastrobuoni G, Kempa S, Rajewsky N. In vivo and transcriptome-wide identification of RNA binding protein target sites. Mol Cell 2011; 44:828-840; PMID:22152485; http://dx.doi.org/ 10.1016/j.molcel.2011.11.009 [DOI] [PMC free article] [PubMed] [Google Scholar]
- 43.Ashburner M, Ball CA, Blake JA, Botstein D, Butler H, Cherry JM, Davis AP, Dolinski K, Dwight SS, Eppig JT, et al.. Gene ontology: tool for the unification of biology. The Gene Ontology Consortium Nat Genet 2000; 25(1):25-9; PMID:10802651 [DOI] [PMC free article] [PubMed] [Google Scholar]
- 44.Huang DW, Sherman BT, Lempicki RA. Bioinformatics enrichment tools: paths toward the comprehensive functional analysis of large gene lists. Nucleic Acids Res 2009; 37(1):1-13; PMID:19033363; http://dx.doi.org/ 10.1093/nar/gkn923 [DOI] [PMC free article] [PubMed] [Google Scholar]
- 45.Ulitsky I, Laurent LC, Shamir R. Towards computational prediction of microRNA function and activity. Nucleic Acids Res 2010; 38(15):e160; PMID:20576699; http://dx.doi.org/ 10.1093/nar/gkq570 [DOI] [PMC free article] [PubMed] [Google Scholar]
- 46.Sass S, Dietmann S, Burk U, Brabletz SS, Lutter D, Kowarsch A, Mayer KF, Brabletz T, Ruepp A, Theis FJ, et al.. MicroRNAs coordinately regulate protein complexes. BMC Syst Biol 2011; 5(1):136; PMID:21867514; http://dx.doi.org/ 10.1186/1752-0509-5-136 [DOI] [PMC free article] [PubMed] [Google Scholar]
- 47.Sass S, Buettner F, Mueller NS, Theis FJ. A modular framework for gene set analysis integrating multilevel omics data. Nucleic Acids Res 2013:1-12; PMID:23143271 [DOI] [PMC free article] [PubMed] [Google Scholar]
- 48.Anders G, Mackowiak SD, Jens M, Maaskola J, Kuntzagk A, Rajewsky N, Landthaler M, Dieterich C. doRiNA: a database of RNA interactions in post-transcriptional regulation. Nucleic Acids Res 2012; 40(Database issue):D180-6; PMID:22086949; http://dx.doi.org/ 10.1093/nar/gkr1007 [DOI] [PMC free article] [PubMed] [Google Scholar]
- 49.Li J-H, Liu S, Zhou H, Qu L-H, Yang J-H. starBase v2.0: decoding miRNA-ceRNA, miRNA-ncRNA and protein-RNA interaction networks from large-scale CLIP-Seq data. Nucleic Acids Res 2013:1-6; PMID:23143271 [DOI] [PMC free article] [PubMed] [Google Scholar]
- 50.Barabási A-L, Gulbahce N, Loscalzo J. Network medicine: a network-based approach to human disease. Nat Rev Genet 2011; 12(1):56-68; PMID:21164525; http://dx.doi.org/ 10.1038/nrg2918 [DOI] [PMC free article] [PubMed] [Google Scholar]
- 51.Franceschini A, Szklarczyk D, Frankild S, Kuhn M, Simonovic M, Roth A, Lin J, Minguez P, Bork P, von Mering C, et al.. STRING v9.1: protein-protein interaction networks, with increased coverage and integration. Nucleic Acids Res 2013; 41(Database issue):D808-15; PMID:23203871; http://dx.doi.org/ 10.1093/nar/gks1094 [DOI] [PMC free article] [PubMed] [Google Scholar]
- 52.Kanehisa M, Goto S. KEGG: kyoto encyclopedia of genes and genomes. Nucleic Acids Res 2000; 28(1):27-30; PMID:10592173; http://dx.doi.org/ 10.1093/nar/28.1.27 [DOI] [PMC free article] [PubMed] [Google Scholar]
- 53.Bertolotti A, Lutz Y, Heard DJ, Chambon P, Tora L. hTAF(II)68, a novel RNA/ssDNA-binding protein with homology to the pro-oncoproteins TLS/FUS and EWS is associated with both TFIID and RNA polymerase II. EMBO J 1996; 15(18):5022-31; PMID:8890175 [PMC free article] [PubMed] [Google Scholar]
- 54.Riggi N, Cironi L, Suvà M-L, Stamenkovic I. Sarcomas: genetics, signalling, and cellular origins. Part 1: the fellowship of TET. J Pathol 2007; 213(1):4-20; PMID:17691072; http://dx.doi.org/ 10.1002/path.2209 [DOI] [PubMed] [Google Scholar]
- 55.Law WJ, Cann KL, Hicks GG. TLS, EWS and TAF15: a model for transcriptional integration of gene expression. Brief Funct Genomic Proteomic 2006; 5(1):8-14; PMID:16769671; http://dx.doi.org/ 10.1093/bfgp/ell015 [DOI] [PubMed] [Google Scholar]
- 56.Jobert L, Argentini M, Tora L. PRMT1 mediated methylation of TAF15 is required for its positive gene regulatory function. Exp Cell Res 2009; 315(7):1273-86; PMID:19124016; http://dx.doi.org/ 10.1016/j.yexcr.2008.12.008 [DOI] [PubMed] [Google Scholar]
- 57.Andersson MK, Ståhlberg A, Arvidsson Y, Olofsson A, Semb H, Stenman G, Nilsson O, Aman P. The multifunctional FUS, EWS and TAF15 proto-oncoproteins show cell type-specific expression patterns and involvement in cell spreading and stress response. BMC Cell Biol 2008; 9:37; PMID:18620564; http://dx.doi.org/ 10.1186/1471-2121-9-37 [DOI] [PMC free article] [PubMed] [Google Scholar]
- 58.Yang D, Wang G, Zhu S, Liu Q, Wei T, Leng Y, et al MiR-495 suppresses mesendoderm differentiation of mouse embryonic stem cells via the direct targeting of Dnmt3a. Stem Cell Res 2014; 12(2):550–61. [DOI] [PubMed] [Google Scholar]
- 59.Hsu S-D, Lin F-M, Wu W-Y, Liang C, Huang W-C, Chan W-L, Tsai WT, Chen GZ, Lee CJ, Chiu CM, et al.. miRTarBase: a database curates experimentally validated microRNA-target interactions. Nucleic Acids Res 2011; 39(Database issue):D163-9; PMID:21071411; http://dx.doi.org/ 10.1093/nar/gkq1107 [DOI] [PMC free article] [PubMed] [Google Scholar]
- 60.Von Mering C, Jensen LJ, Snel B, Hooper SD, Krupp M, Foglierini M, Jouffre N, Huynen MA, Bork P. STRING: known and predicted protein-protein associations, integrated and transferred across organisms. Nucleic Acids Res 2005; 33(Database issue):D433; PMID:15608232; http://dx.doi.org/ 10.1093/nar/gki005 [DOI] [PMC free article] [PubMed] [Google Scholar]
- 61.Szklarczyk D, Franceschini A, Kuhn M, Simonovic M, Roth A, Minguez P, Doerks T, Stark M, Muller J, Bork P, Jensen LJ, von Mering C.et al. The STRING database in 2011: functional interaction networks of proteins, globally integrated and scored. Nucleic Acids Res 2011; 39(Database issue):D561-8; PMID:21045058; http://dx.doi.org/ 10.1093/nar/gkq973 [DOI] [PMC free article] [PubMed] [Google Scholar]
- 62.Fisher RA. On the interpretation of χ2 from contingency tables, and the calculation of P. J R Stat Soc 1922; 85(1):87-94; http://dx.doi.org/ 10.2307/2340521 [DOI] [Google Scholar]
- 63.Benjamini Y, Hochberg Y. Controlling the false discovery rate: a practical and powerful approach to multiple testing. J R Stat Soc Ser B Methodol 1995; 57:289-300 [Google Scholar]
- 64.Bauer DF. Constructing Confidence Sets Using Rank Statistics. J Am Stat Assoc 1972; 67(339):687. [Google Scholar]