

Abstract
The cell nucleus is structurally and functionally organized by lamins, intermediate filament proteins that form the nuclear lamina. Point mutations in genes that encode a specific subset of lamins, the A-type lamins, cause a spectrum of diseases termed laminopathies. Recent evidence points to a role for A-type lamins in intracellular redox homeostasis. To determine whether lamin A/C depletion and prelamin A accumulation differentially induce oxidative stress, we have performed a quantitative microscopy-based analysis of reactive oxygen species (ROS) levels and mitochondrial membrane potential (Δψm) in human fibroblasts subjected to sustained siRNA-mediated knockdown of LMNA and ZMPSTE24, respectively. We measured a highly significant increase in basal ROS levels and an even more prominent rise of induced ROS levels in lamin A/C depleted cells, eventually resulting in Δψm hyperpolarization and apoptosis. Depletion of ZMPSTE24 on the other hand, triggered a senescence pathway that was associated with moderately increased ROS levels and a transient Δψm depolarization. Both knockdowns were accompanied by an upregulation of several ROS detoxifying enzymes. Taken together, our data suggest that both persistent prelamin A accumulation and lamin A/C depletion elevate ROS levels, but to a different extent and with different effects on cell fate. This may contribute to the variety of disease phenotypes witnessed in laminopathies.
Keywords: apoptosis, high-content microscopy, lamin A/C, laminopathies, mitochondria, mitochondrial dysfunction, oxidative stress, prelamin A, senescence, ZMPSTE24
Abbreviations
- LA
lamin A
- PLA
prelamin A
- HGPS
Hutchinson-Gilford progeria syndrome
- RD
restrictive dermopathy
- ROS
reactive oxygen species
- Δψm
mitochondrial membrane potential
- NT
non-targeting
- ZMPSTE24kd
ZMPSTE24 knockdown
- LMNAkd
LMNA knockdown
- PDL
population doubling level
- CM-H2DCFDA
5-(and-6)-chloromethyl-2′,7′-dichlorodihydrofluorescein diacetate
- TBHP
tert-butyl hydrogen peroxide
- TMRM
tetramethyl rhodamine methyl ester
- OCR
oxygen consumtion rate
- hMSCs
human mesenchymal stem cells
- MEF
mouse embryonic fibroblasts
- NHDF
normal human dermal fibroblasts
Introduction
The nuclear lamina provides structural support to the nucleus and plays a central role in nuclear organization and gene regulation.1 Point mutations in the LMNA gene, which encodes its major constituent proteins, lamin A and C, cause a broad range of diseases termed laminopathies.1 During maturation, lamin A (LA) is extensively processed, with consecutive steps of farnesylation, proteolytic cleavage of the N-terminal 3 amino acids, carboxymethylation and removal of the N-terminal 15 amino acids, including the farnesyl group.2 The final step is exclusively catalyzed by the zinc-metallopeptidase ZMPSTE24. Accumulation of different prelamin A (PLA) intermediates is correlated with disease but especially the farnesylated variants are presumed to be cytotoxic.3 The Hutchinson-Gilford progeria syndrome (HGPS) for example is caused by an accumulation of the mutant farnesylated PLA intermediate progerin.4 Likewise, in restrictive dermopathy (RD), loss of functional ZMPSTE24 results in the accumulation of farnesylated PLA.5,6 The underlying disease causing mechanisms are still largely unknown but it is becoming increasingly more clear that next to its structural function and role in nuclear dynamics,7 the nuclear lamina also modulates intracellular redox homeostasis.8 Various studies have revealed that reactive oxygen species (ROS) levels are increased in laminopathy patient cells and during PLA accumulation.9-12 For example, fibroblasts from various lipodystrophy patients as well as cells treated with HIV protease inhibitors demonstrate increased ROS levels.12 Proteomic and metabolic profiling suggest that this increase may be attributed to dysfunctional mitochondria.13,14
To corroborate these findings in a standardized manner, we developed a microscopy-based strategy for combined measurement of ROS and mitochondrial membrane potential (Δψm) in cellular models of PLA accumulation or LA deficiency. Using this approach, we found that both accumulation of PLA and reduction of mature LA increased intracellular ROS levels, albeit not at the same rate nor to the same extent, and also caused changes in mitochondrial potential (Δψm). These effects were accompanied by reduced mitochondrial respiration and altered gene expression of ROS detoxifying enzymes.
Results
Sustained knockdown of ZMPSTE24 and LMNA reduce cell proliferation via different mechanisms
Accumulation of PLA or reduction of mature LA was achieved in human fibroblasts by respectively silencing the expression of ZMPSTE24 or LMNA with specific siRNAs. A pool of non-targeting (NT) siRNAs was used as control. To maintain the knockdowns for prolonged periods of time, repetitive rounds of siRNA transfection were performed, separated by 72 h to 96 h. 48 h after the first transfection there was a highly significant downregulation of both genes at the RNA-level: ∼4-fold (∼75%) for ZMPSTE24 knockdown (ZMPSTE24kd) and ∼17-fold (∼94%) for LMNA knockdown (LMNAkd). Similar levels were found after 168 h (2 rounds of transfection) (Fig. 1A). At the protein level, however, the effect became more pronounced with time. Quantitative immunofluorescence revealed a ∼1.8-fold increase in PLA levels 48 h after the initial transfection, and a ∼4-fold increase after 264 h in ZMPSTE24kd cells (3 consecutive transfections) (Fig. 1B). Similarly, the abundance of mature LA dropped 1.3-fold after 48 h and decreased more than 4-fold after 264 h in LMNAkd cells (Fig. 1C). The effects were qualitatively confirmed by Western blot (Fig. 1D). Immunostaining also revealed that knockdowns were accompanied by progressive changes in nuclear morphology. Whereas LMNAkd led to nuclear elongation and erosion of peripheral chromatin, sustained ZMPSTE24kd led to a dramatic increase in nuclei with folds and blebs (Figs. 1E, F).
Figure 1.

Sustained siRNA-mediated knockdown of LMNA (LMNAkd) and ZMPSTE24 (ZMPSTE24kd). (A) Gene expression levels of LMNA and ZMPSTE24 measured by real-time qPCR relative to non-targeting control (NT). (B and C) PLA and LA protein levels in ZMPSTE24kd resp. LMNAkd cells versus NT control, as measured by immunofluorescence staining and quantitative image analysis. (D) Western blot with an A-type lamin antibody that recognizes lamin A, lamin C and PLA, showing absence of lamin A/C in LMNAkd and accumulation of PLA in ZMPSTEkd cells at the 168 h time point. Nucleolin was used as a loading control. (E) Quantification of the number of dysmorphic nuclei, expressed relative to the total number of cells. (F) Representative images of LMNAkd, ZMPSTEkd and NT control cells at the 168 h time point, after immunofluorescence staining for LA (green), PLA (red) and counterstaining with DAPI (cyan). Arrows indicate nuclear aberrations. (* = p-value < 0, 05; ** = p-value < 0, 01; *** = p-value < 0, 001).
Both knockdowns had an adverse impact on cell proliferation, resulting in significantly increased population doubling times (decreased population doubling level, PDL) with respect to the NT control (Fig. 2A). The effect of LMNAkd was markedly stronger than that of ZMPSTE24kd. Quantification of ß-galactosidase positive cells and p21-positive cells – 2 markers for senescence15 – revealed that only ZMPSTE24kd triggered cellular senescence (Figs. 2B, C, E). LMNAkd predominantly triggered cell death, as evidenced by a marked increase in the number of fragmented nuclei (Figs. 2D, E).
Figure 2.

Sustained siRNA-mediated knockdown of LMNA and ZMPSTE24 affects cell proliferation. (A) The relative population doubling speed compared to the NT-control expressed as population doubling level (PDL) at different time points. (B) Quantification of the number of β-galactosidase positive cells at 168 h, relative to the total number of cells. (C) Quantification of the number of p21 positive cells at 168 h, relative to the total number of cells. (D) Quantification of apoptosis, expressed by the number of fragmented nuclei relative to the total number of cells. (E) Representative images of β-galactosidase stained NT control, LMNAkd and ZMPSTE24kd cells (senescent cells in blue), merged with DAPI channel (grey/white). Arrows indicate nuclear aberrations. (* = p-value < 0,05; ** = p-value < 0,01; *** = p-value < 0,001).
LMNAkd significantly raises basal and induced ROS levels; ZMPSTE24kd only causes a modest increase of the basal ROS level
We established and validated a high-content workflow to simultaneously measure intracellular ROS levels and Δψm, using the fluorescent reporter molecules CM-H2DCFDA and TMRM, respectively (see M&M for details). Using this method, we quantified ROS levels in human fibroblasts subjected to sustained knockdown of ZMPSTE24 or LMNA under basal conditions and after acute application of 20 µM of the oxidant tert-butyl hydrogen peroxide (TBHP). The latter served as proxy for induced ROS and was expressed as the relative increase with respect to the basal ROS levels.
LMNAkd caused a time-dependent increase in both basal and induced ROS levels. Whereas the increase in basal ROS levels only became significant after 168 h, the induced ROS levels were already significantly higher at 96 h. ZMPSTE24kd on the other hand, only resulted in a modest, but significant increase in basal ROS levels after 264 h. Within the experimental time frame, this treatment did not cause a significant increase of induced ROS (Figs. 3A, B).
Figure 3.

Both LMNAkd and ZMPSTE24kd cells have increased basal ROS levels. LMNAkd cells are more susceptible toward induced ROS. (A and B) Normalized basal levels of intracellular ROS measured by CM-H2DCFDA high content microscopy analysis and response toward induced ROS, measured as relative gain in intensity after 20 µM TBHP addition at different time points in LMNAkd and ZMPSTE24kd cells. (C and D) Normalized basal levels of intracellular ROS and response toward induced ROS in LMNAY259X/Y259X and LMNAG608G/+ cells. (* = p-value < 0,05; ** = p-value < 0,01; *** = p-value < 0,001; the range of the y-axes has been adjusted to optimally display the differences).
Next to the knockdowns, passage-matched fibroblasts from specific laminopathy patients (LMNAY259X/Y259X, LMNAC608G/+, LMNA+/+) were subjected to the same analysis. LMNAY259X/Y259X cells are incapable of producing mature lamin A/C16 and LMNAC608G/+ cells accumulate a truncated, farnesylated prelamin A variant termed progerin.17 In line with the results from the sustained knockdown, LMNAY259X/Y259X demonstrated an increase in both basal and induced ROS, while LMNAC608G/+ cells only showed an increase in basal ROS (Figs. 3C, D).
ZMPSTE24kd and LMNAkd affect Δψm in a time-dependent manner
As dysfunctional mitochondria can generate increased amounts of ROS, we estimated Δψm by quantifying the mitochondrial accumulation of the reporter dye TMRM using the high-content microscopy method described above. Dynamic and time-dependent changes were observed for the different treatments. LMNAkd induced Δψm depolarization at 96 h and 168 h and Δψm hyperpolarization at 264 h. On the other hand, ZMPSTE24kd resulted in a transient Δψm depolarization at 168 h (Fig. 4A). In the case of patient cells, LMNAY259X/Y259X fibroblasts displayed a slight Δψm hyperpolarization that was not significantly different from LMNA+/+ control cells. In contrast, LMNAC608G/+ fibroblasts displayed significant Δψm depolarization (Fig. 4B).
Figure 4.
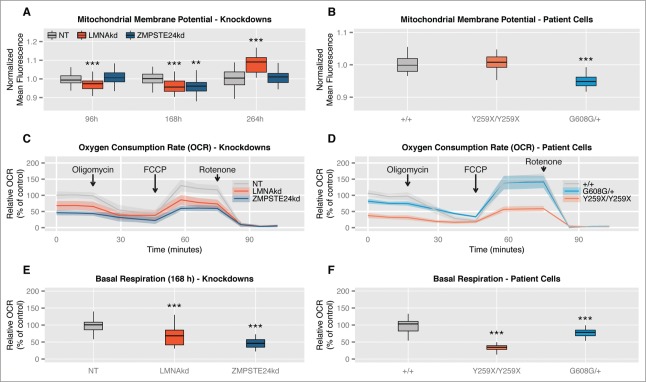
Sustained siRNA-mediated knockdown of LMNA and ZMPSTE24 induces time-dependent alterations in mitochondrial membrane potential (Δψm) and decreased basal mitochondrial respiration. (A) Normalized Δψm as measured by TMRM at different time points in LMNAkd and ZMPSTE24kd cells. (B) Normalized Δψm in LMNAY259X/Y259X and LMNAG608G/+ cells. (C and D) Normalized respiration profiles of LMNAkd, ZMPSTE24kd, LMNAY259X/Y259X and LMNAG608G/+ cells. The shaded region represents the standard error on the measurements. See the materials and methods section for more information about the different chemical components that were added. (E and F) Normalized basal respiration of LMNAkd, ZMPSTE24kd, LMNAY259X/Y259X and LMNAG608G/+ cells. (* = p-value < 0,05; ** = p-value < 0,01; *** = p-value < 0,001; the range of the y-axes has been adjusted to optimally display the differences).
ZMPSTE24kd and LMNAkd decrease basal oxygen consumption rates
Since the TMRM measurements suggested a (transient) defect in mitochondrial function, we next investigated mitochondrial oxygen consumption (Figs. 4C–F). At the 168 h time point, we found strong deviations between the respiration curves (Figs. 4C, D). Especially, the basal oxygen consumption rate (OCR) was significantly lower in both ZMPSTE24kd and LMNAkd cells (Fig. 4E). This was also the case for LMNAY259X/Y259X and LMNAC608G/+ patient fibroblasts (Fig. 4F).
Sustained LMNAkd is correlated with significant changes in mitochondrial superoxide
To verify whether a change in Δψm was accompanied by a change in mitochondrial superoxide (•O2−) production, we measured the latter using the mitochondria-targeted •O2− sensor MitoSOX. After 168h hours, no significant change in •O2− levels was observed, despite a transient decrease in Δψm in both knockdowns. After 264h, LMNAkd cells clearly displayed a significant increase in Δψm as well as in •O2− (Fig. S1A)
Proteasome inhibition increases intracellular ROS and Δψm
One potential cause of mitochondrial dysfunction and increased ROS production could be proteasome overload. To verify whether proteasome dysfunction is indeed associated with ROS induction, normal human fibroblasts were treated with 10 µM MG132 for 16h and analyzed using the microscopy-based assay described earlier. We found that MG132 treatment resulted in increased basal and induced ROS levels, and an increased Δψm (Fig. S2A–C).
LMNAkd and ZMPSTE24kd differentially affect antioxidant gene expression
Oxidative stress arises from an imbalance between ROS production and removal. To find out whether the accumulation of ROS correlated with a change in expression of ROS detoxifying enzymes, we performed a qPCR analysis. In general, LMNAkd more profoundly affected the expression of these enzymes than ZMPSTE24kd. In both conditions, most of the investigated genes were upregulated when compared to control cells, with the strongest effect on GSTT2 transcript levels. Strikingly, ZMPSTE24kd and LMNAkd oppositely affected the expression of the mitochondrial manganese-(Mn)-superoxide dismutase (SOD2). This ROS-detoxifying enzyme converts superoxide (•O2−) into hydrogen peroxide (H2O2). Expression of SOD2 is regulated by the key cytokine IL6.18 Subsequent quantification of IL6 transcript levels revealed a strong upregulation in ZMPSTE24kd and downregulation in LMNAkd cell cultures (Fig. 5). This opposing expression pattern was also observed in LMNAY259X/Y259X and LMNAC608G/+ patient fibroblasts (Fig. 5).
Figure 5.
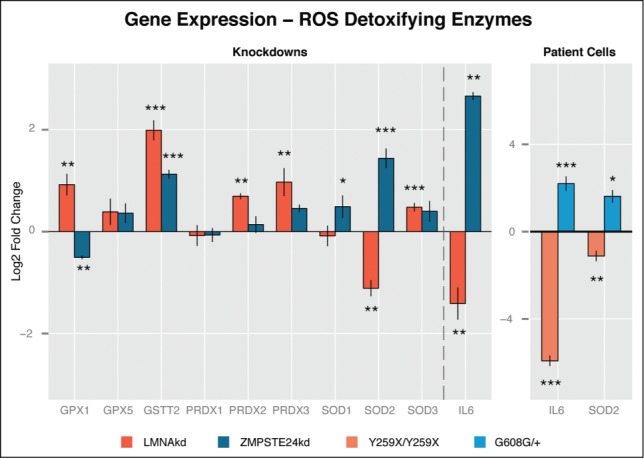
LMNAkd and ZMPSTE24kd cells show altered gene expression of ROS defusing enzymes. (A) Gene expression levels of GPX1, GPX5, GSTT2, PRDX1, PRDX2, PRDX3, SOD1, SOD2, SOD3 and IL6 were measured in LMNAkd and ZMPSTE24kd cells by real-time qPCR relative to NT control at 168 h. (B) Gene expression levels of IL6 and SOD2 were measured in LMNAY259X/Y259X and LMNAG608G/+ fibroblasts by real-time qPCR relative to untreated passage matched control fibroblasts. The values in this plot represent the average of 3 technical replicates, but only one biological replicate because we only have one cell line for each mutation. Therefore we cannot provide biologically relevant errorbars. (* = p-value < 0,05; ** = p-value < 0,01; *** = p-value < 0,001).
Discussion
With this work we set out to enhance our understanding of whether and how PLA accumulation and LA deficiency affect cellular redox homeostasis at the cellular level. Since mature LA is firmly integrated within the nuclear lamina, it is characterized by low turnover rates.19 This makes studying LA biology by acute siRNA-mediated knockdown strategies unreliable. We therefore induced sustained knockdown in human fibroblasts by repetitive siRNA transfection. After the initial transfection, gene expression levels dropped relatively quickly to a minimum (within 72 h), but the actual protein levels progressively changed over a time span of 264 h (LA declined, PLA increased). In LMNAkd cells, and especially in ZMPSTE24kd cells, this was accompanied by overt changes in nuclear morphology in a large fraction (60–70%) of cells. Similar levels of nuclear dysmorphy have been quantified in human mesenchymal stem cells (hMSCs) after siRNA-mediated knockdown of ZMPSTE2420 and the observed morphological changes were analogous to those witnessed in Zmpste24−/− mouse embryonic fibroblasts (MEF)21 and HGPS patient fibroblasts.22 As a rough validation, we extended our experiments with measurements of cells from LMNAY259X/Y259X and LMNAG608G/+ patients, although it should be noted that the patient's genetic background might play a role in the outcome of the experiments. In addition, knockdown of ZMPSTE24 causes accumulation of a farnesylated full-length PLA, whereas HGPS cells (LMNAG608G/+) produce a different farnesylated PLA variant lacking 50 amino acids.
To measure ROS levels and mitochondrial function in a robust and reliable manner at the single cell level, we established and benchmarked a high-content microscopy workflow in which we measured both intracellular ROS levels and mitochondrial membrane potential (Δψm). Using this approach, we observed that both accumulation of farnesylated PLA and reduction of mature LA increased intracellular ROS levels, albeit at different rates. Compared to ZMPSTE24kd, LMNAkd induced a progressive increase in basal ROS that was much more pronounced and started much earlier in the experimental time frame. And whereas ZMPSTE24kd cells showed no significant alteration in their response to the exogenous oxidant TBHP, LMNAkd cells proved to be hypersensitive. These observations correlate well with those obtained by Pekovic et al.23 and support the hypothesis that the nuclear lamina acts as an intracellular ROS-sink via conserved redox-reactive cysteine residues within the lamin tail.23 When A-type lamins (and their cysteine residues) are depleted, the ability of the lamina to act as a ROS buffering system is abrogated, rendering the cell more sensitive against (potentially dangerous) increases of the intracellular ROS levels. PLA accumulation however does not decrease the concentration of these cysteine residues, plausibly leaving the ROS-sink intact. It has been shown that fibroblasts from centenarians accumulate moderate levels of PLA due to downregulation of ZMPSTE24, and that this primes the cells for a prompt response to DNA damage and oxidative stress, arguing for a physiological role of PLA.24 Above a certain threshold, however, PLA becomes toxic and ROS levels increase, as witnessed in ZMPSTE24kd cells at 264 h.
To determine whether elevated ROS levels correlated with mitochondrial dysfunction, we also quantified Δψm. Our results revealed that LMNAkd induces Δψm depolarization at early time points, followed by Δψm hyperpolarization at 264 h. In contrast, ZMPSTE24kd induced a transient Δψm depolarization. In accordance with the increase in Δψm, we also observed a significant increase in mitochondrial •O2- levels in LMNAkd cells after 264h, as reported by the MitoSOX sensor dye. Indeed, it has been demonstrated before that mitochondria produce more ROS at high membrane potential.25,26 In line with a defect in mitochondrial function, and consistent with observations in Zmpste24−/− mouse adult fibroblasts,14 the basal mitochondrial respiration rate in both LMNAkd and ZMPSTE24kd cells as well as in LMNAY259X/Y259X and LMNAG608G/+ patient cells was lowered.
Since mitochondria are the initial sites of oxidative damage and the instigators of oxidative stress in the cytosol upon proteasome overload,27 a possible connection with the knockdowns may lie in their potential to cause proteasome dysfunction. Indeed, overexpression of LA mutants and depletion of LA has been linked to the accumulation of nuclear envelope proteins (SUN2, Emerin and Nesprin-1) in the endoplasmic reticulum and upregulation of various ubiquitin ligases, resulting in proteasome overload.28-31 Supporting this hypothesis, treatment of fibroblasts with MG132, a potent proteasome inhibitor, also resulted in a significant increase of basal and induced ROS levels, as well as increased Δψm.
Parallel to the increase in intracellular ROS, both knockdowns showed increased expression of ROS detoxifying enzymes. Although the number of upregulated genes was higher in LMNAkd with respect to ZMPSTE24kd cells, their failure to suppress ROS increase could be explained by the absence of the aforementioned ROS sink. In both conditions the general trend was preserved, except for a differential expression of GPX1 and SOD2. SOD2 is a mitochondrial superoxide converting enzyme, the expression of which is regulated by IL6, a senescence associated cytokine.32-34 We found that both IL6 and SOD2 were upregulated in ZMPSTE24kd and downregulated in LMNAkd cells. The same opposite expression was observed in LMNAG608G/+ and LMNAY259X/Y259X fibroblasts, respectively, even with a much stronger (˜78 fold) downregulation of IL6 in LMNAY259X/Y259X cells. The upregulation of SOD2 in ZMPSTE24kd cells might explain why these cells display no significant increase in mitochondrial superoxide.27 When following this reasoning, downregulation of SOD2 should then trigger a rise in mitochondrial ROS levels, which we indeed observed in LMNAkd cells after 264 h.
Previously, we have shown that repetitive ruptures of the nuclear envelope in lamin A/C deficient cells temporarily relocate various transcription factors, several of which controlling oxidative stress response.35 In addition, we found that lamin A/C deficiency caused cytoplasmic translocation of nuclear PML bodies,36 known sensors of oxidative stress and regulators of redox homeostasis.37,38 It is conceivable that these phenomena contribute to the oxidative stress phenotype witnessed in LMNAkd cells as well.
Irrespective of the ROS source, we witnessed a decreased cell proliferation in both ZMPSTE24kd and LMNAkd cells. However, the actual cell fate between both knockdowns differed. Whereas ZMPSTE24kd cells resorted to a senescence pathway (shown by ß-galactosidase and p21 staining as well as upregulation of IL6), LMNAkd cells rather experienced increased apoptosis (evidenced by an increased number of cells with fragmented nuclei and Δψm hyperpolarization, which is known to precede apoptosis39,40). These results align well with earlier findings. Indeed, premature senescence was observed in Zmpste24−/− MEFs, LmnaG609G/G609G MEFs, ZMPSTE24 depleted hMSCs and HGPS fibroblasts,32,41-43 and apoptosis was increased in Lmna−/− MEFs, especially when subjected to mechanical stress,30,44 in myocytes from LmnaE82K/+ transgenic mice45 and in Lmna+/− atrioventricular nodal mouse myocytes.46 This bifurcation in cell fate might be triggered by the extent of mature lamin A reduction, which translates into a ROS dosage effect. It has been shown that modestly increased levels of intracellular ROS induce and maintain cellular senescence, as observed in ZMPSTE24kd cells, while higher doses provoke apoptosis, i.e. LMNAkd cells.47-50
In conclusion, we demonstrated that sustained knockdown of LMNA or ZMPSTE24 resulted in increased basal ROS levels, which were accompanied by changes in mitochondrial function and altered gene expression of ROS detoxifying enzymes. Reduction of LA caused a dramatic increase in basal and, especially, induced ROS levels ultimately leading to Δψm hyperpolarization and apoptosis. Depletion of ZMPSTE24 on the other hand, triggered a senescence pathway, associated with moderately increased ROS levels and transient Δψm depolarization. Thus, LA and PLA differentially regulate cell fate, in part via a redox-dependent pathway. Uncovering the pathways that lead to increased ROS production will help understanding laminopathy diversity and disease progression.
Materials and Methods
Cell culture
Normal human dermal fibroblasts (NHDF, LMNA+/+, Promocell, C-12300), fibroblasts from a patient with a lethal laminopathy phenotype due to a nonsense Y259X homozygous mutation in the LMNA gene (LMNAY259X/Y259X)16 and fibroblasts from a patient suffering from HGPS (LMNAG608G/+)17 were cultured in T25 or T75 culture flasks in DMEM high glucose with L-glutamine medium (Lonza, BE12–604F) supplemented with 10% fetal bovine serum (Gibco, 10500–064) and 1% penicillin/streptomycin/L-glutamine (Gibco, 10378–016), at 37°C and 5% CO2, according to standard procedures. All experiments were performed with cells in between passage 9 and 20. In case of direct comparison, passage-matched cells were used. At set time points, viable cells were counted using Trypan blue and a Bürker chamber. Proliferative capacity was expressed in terms of population doubling level (PDL), the base 2 logarithm of the number of cells at the current time point divided by the number of cells that was seeded.
siRNA-mediated knockdown
Expression of ZMPSTE24 and LMNA was silenced with siGENOME Lamin A/C siRNA (Thermo Scientific, D-001050–01–20) and siGENOME Human ZMPSTE24 siRNA (Thermo Scientific, M-006104–02–0020), respectively. Stealth RNAi siRNA Negative Control, Med GC (Life Technologies, 12935–300) was used as a negative non-targeting control (NT). siRNA transfections were performed using Lipofectamine® RNAi-MAX Transfection Reagent (life technologies, 13778–075), according to manufacturer's instructions following the scheme outlined in Figs. 6A, B.
Figure 6.
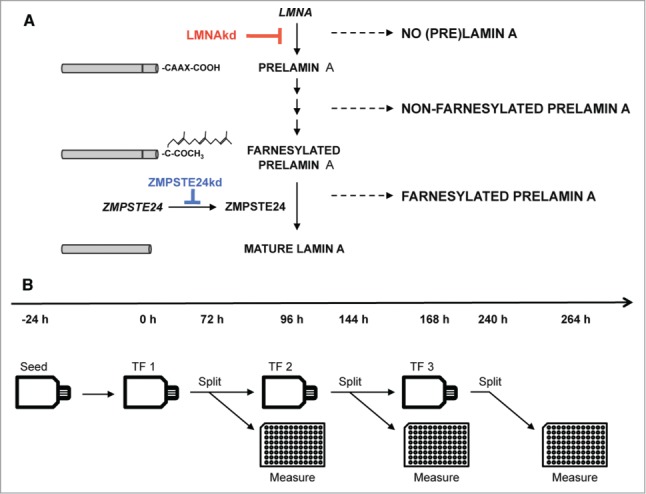
(A) Schematic overview of the maturation process of prelamin A to mature lamin A and interference by siRNA-mediated knockdown. (B) Experimental design of the sustained siRNA-mediated knockdown by repetitive transfections (TFs).
Quantitative PCR
RNA was extracted from cells using the RNAeasy mini kit (Qiagen, 74104), with on-column DNAse digestion. Concentrations of purified RNA were measured with the NanoDrop 2000 (Thermoscientific). Per sample, 1 µg of RNA was converted to cDNA using SuperScript® III Reverse Transcriptase (RT) (Life Technologies, 18080–044). All qPCR reactions were performed on a RotorGene 3000 (Qiagen/Corbett) using the SensiMix™ SYBR® No-ROX Kit (Bioline, QT650) according to the manufacturer's instructions. Relative abundance of LMNA transcripts (forward: TGGACGAGTACCAGGAGCTT; reverse: ACTCCAGTTTGCGCTTTTTG), ZMPSTE24 transcripts (forward: CGAGAAGCGTATCTTCGGG; reverse: TGTGCT-AGGAAGGTCTCCCA), SOD1 transcripts (forward: GACCT-GCACTGGTACAGCCT; reverse: GCATCATCAATTTCGA-GCAG), SOD2 transcripts (forward: GGAGAAGTACCAGGAGGCGT; reverse: TAGGGCTGAGGTTTGTCCAG), SOD3 transcripts (forward: TCTCTTGGAGGAGCTGGAAA; reverse: CGAGTCAGAGTTGGGCTCC), IL6 transcripts (forward: AGTGAGGAACAAGCCAGAGC; reverse: GTCAGGG-GTGGTTATTGCAT), GSTT2 transcripts (forward: ACGCTCAAGGATGGTGATTT; reverse: AGGTACTCATGAACAC-GGGC), GPX1 transcripts (forward: CCGAGAAGGCATACACCGAC; reverse: GCCGGCCAGTTAAAAGGAGG), GPX5 transcripts (forward: ACAAGTCCCAAGCAGGAGAA; reverse: TGACGAAGAGGATGTGCTTG), PRDX1 transcripts (forward: GCTGTTATGCCAGATGGTCAG; reverse: GGG-CACACAAAGGTGAAGTC), PRDX2 transcripts (forward: GTCCTTCGCCAGATCACTGT; reverse: TGGGCTTAATC-GTGTCACTG) and PRDX3 transcripts (forward: CCACATGAACATCGCACTCT; reverse: TTGACGCTCAAATGCTTGAT) were measured relative to ACTB (forward: CCTT-GCACATGCCGGAG; reverse: GCACAGAGCCTCGCCTT) and GAPDH (forward: TGCACCACCAACTGCTTAGC; reverse: GGCATGGACTGTGGTCATGAG) reference transcripts. Ct-values were calculated using the ‘comparative quantification’ (CQ) method supplied as part of the Rotor Gene 3.0 software (Corbett Research). Analysis was done using the ΔΔCt-method.51
Immunofluorescence staining
NHDF cells were grown on glass coverslips and fixed in 4% paraformaldehyde for 15 minutes at room temperature and washed (3x, 5 minutes) with PBS. Subsequently, cells were permeabilized with 0.5% Triton X-100 (5 minutes), after which they were blocked with 50% fetal bovine serum (FBS) for 30 minutes and incubated with primary antibody diluted in 50% FBS for 60 minutes. After minimally 3 PBS wash steps, slides were incubated with secondary antibody diluted in 50% FBS for 30 minutes, washed again, and mounted with VECTASHIELD™ Mounting Medium (VWR, 101098–042) containing 1 µg/ml 4′,6- diamino-2-phenylindole (DAPI). Primary antibodies were directed against lamin A (Abcam, ab26300) and prelamin A (Santa Cruz Biotechnology Inc., SC-6214). As secondary antibodies DyLight 488 conjugated donkey anti-rabbit (Jackson ImmunoResearch Laboratories Inc., JAC-705606147), and DyLight 649 conjugated donkey anti-goat (Jackson ImmunoResearch Laboratories Inc., JAC-705496147) were used. Immunofluorescent stained cells were visualized using a Nikon Ti Eclipse inverted widefield fluorescence microscope (Nikon Instruments) with 40x Plan Apo oil (NA = 1.3) and 60x Plan Apo VC (NA = 1.4) objectives.
ß-galactosidase staining
NHDF cells were grown on glass coverslips and fixed in 4% paraformaldehyde for 15 minutes at room temperature and washed (2x, 5 min) with PBS. Fixed cells were incubated overnight at 37°C in 1 mg/ml X-Gal, 40 mM citric acid/phosphate buffer (pH 6), 5 mM ferricyanide, 5 mM ferrocyanide, 2 mM MgCl2 and 150 mM NaCl. After incubation the cells were washed (3x, 5 min) with PBS and permeabilized with 0.5% Triton X-100 (5 minutes). The cells were washed (3x, 5 min) with PBS and mounted with VECTASHIELD™ Mounting Medium (VWR, Belgium, 101098–042) containing 1 µg/ml 4′,6- diamino-2-phenylindole (DAPI). Cells were visualized using a Nikon Ti Eclipse inverted widefield fluorescence microscope (Nikon Instruments, Paris, France) with a 40x Plan Apo oil (NA = 1.3) objective.
Western blot
Cells were grown in T75 culture flasks and lysed using the whole-cell extraction protocol of the Nuclear Extract Kit (Active Motif, 40010). Protein concentration was measured with the Pierce 660 nm assay (Thermo Scientific, 22662). Cell lysates were subjected to SDS-PAGE (8% bis-tris with MOPS running buffer) and transferred to BioTrace PVDF membranes (Pall Corporation, 66542). Primary antibodies were directed against lamin A/C (Santa Cruz Biotechnology Inc.., sc-56139) and nucleolin (control) (Novus Biologicals, NB600–241). HRP conjugated goat anti-mouse (Sigma-Aldrich, A4416) and HRP conjugated goat anti-rabbit (Sigma-Aldrich, A6154) were used as secondary antibodies. Proteins were detected by chemiluminescence with Immobilon Western chemiluminescent HRP substrate (Millipore, WBKLS0100).
High content live cell imaging of intracellular ROS and Δψm
Intracellular ROS and Δψm were measured after dual staining with the fluorescent cell-permeable probes 5-(and-6)-chloromethyl-2',7'-dichlorodihydrofluorescein diacetate (CM-H2DCFDA) (Life Technologies, C6827) and tetramethyl rhodamine methyl ester (TMRM, Invitrogen, T-668). Measurements were done 96 h, 168 h and 264 h after initiation of the knockdown (Fig. 6B). Twenty-four hours before measurement, cells were transferred to 96-well plates at 2500 cells per well. Right before measurement they were washed in HBSS + Hepes (HH) (pH 7.2), incubated for 25 minutes in the dark at room temperature in HH-buffer containing 2 µM CM-H2DCFDA and 20 nM TMRM, washed again in HH-buffer and then imaged (also in HH-buffer) on a Nikon Ti Eclipse inverted widefield fluorescence microscope with a 20x air Plan Apo objective (NA 0.75) using a 480/40 nm excitation, 520/35 nm emission filter combination for the CM-H2DCFDA signal and a 540/25 nm excitation, 605/55 nm emission filter combination for the TMRM signal. Since fluorescence excitation induces the formation of ROS,52 the CM-H2DCFDA signal increases during microscopic observation. To avoid this effect from biasing the results, we used diffuse transmitted illumination to initialize an infrared-led based autofocus (Perfect Focus System, Nikon), after which images were acquired automatically across the plate (4 images per well and per channel), the CM-H2DCFDA channel first, thereby assuring equal exposure conditions for all wells. After the complete plate was imaged, 20 µM tert-butyl peroxide (Sigma-Aldrich, 458139–100 mL) was added to all wells and after a 3-minute interval the acquisition was repeated. The method was benchmarked with different doses of TBPH and validated with flow cytometry (supplementary methods, Fig. S3A, E). TMRM reporter potential was validated with valinomycin (Sigma) and oligomycin (Sigma), known inducers of Δψm depolarization, resp. hyperpolarization (supplementary methods, Fig. S3B, C).
An analogous experimental setup was used for measuring mitochondrial superoxide levels with MitoSOX Red Reagent (Life technologies – M36008). This dye was combined with the pan-cellular, viability dye Calcein Green (Life Technologies – C34852) to simplify cell segmentation in downstream image analysis and exclude dead cells from the analysis.53 In brief, cells were grown in 96-well plates, washed in HH-buffer, incubated in HH-buffer with 5 µM MitoSOX Red Reagent and 0.930 µM Calcein for 10 minutes at 37°C in the dark, washed again and imaged 1x with the same 4 images/well acquisition protocol. The dynamic range of MitoSOX was determined via TBPH addition (supplementary methods, Fig. S1B).
All experiments were performed with at least 8 replicates per treatment per plate (depending on the experiment), on at least 3 different plates.
For proteasome inhibition, 2000 cells were seeded in 96-well plates 2 d before measurement and 16 h prior to staining, cells were treated with 10 mM MG132. (Santa Cruz – SC-201270).
Image analysis
All image processing was performed in FIJI (http://fiji.sc), a packaged version of ImageJ freeware (W.S. Rasband, USA. National Institutes of Health, Bethesda, Maryland, USA, http://rsb.info.nih.gov/ij/, 1997–2014). Quantification of nuclear signal intensities of immunostained cell cultures was done using INSCYDE, a script for high-content analysis.54 Additionally, a new script was written for automated analysis of intracellular ROS and mitochondrial characteristics (RedoxMetrics.ijm). In brief, the image analysis pipeline consists of a flatfield correction to correct for illumination heterogeneity, noise reduction by Gaussian filtering, cell or mitochondrial segmentation and subsequent feature analysis of regions of interest. For CM-H2DCFDA or Calcein counterstained images, cells were segmented by autothresholding according to Huang's algorithm and average intensities were measured within the segmented regions. For measurement of mitochondrial signals, mitochondria were first selectively enhanced by local contrast enhancement and multi-scale Laplacian filtering54 after which binarization was performed using Huang's algorithm. The resulting mask was used for analyzing signal intensities of objects larger than a predefined size (>3 pixels) on the original image. All scripts are available upon request.
Respirometry
The Seahorse Extracellular Flux XF24 analyzer (Seahorse Bioscience) was used to provide a comprehensive assessment of the relative state of aerobic metabolism in live cells in assessing mitochondrial function. Seeding density and concentration of Mitostress kit (Seahorse Bioscience, 101848–400) components were optimized according to the manufacturers guidelines. Fibroblasts were seeded at a concentration of 20000 cells per well the day prior to the experiment. OCR was measured before addition of any compound (basal OCR), after addition of oligomycin (0.5 µM final concentration), carbonyl cyanide p-trifluoromethoxyphenylhydrazone (FCCP, 0.5 µM) and rotenone/antimycin (0.5 and 0.05 µM). The OCR linked to coupled respiration was obtained by subtracting OCR after the addition of oligomycin from basal OCR. OCR after addition of the mitochondrial uncoupler FCCP reflected the maximal respiratory rate (spare respiratory capacity). Non-mitochondrial respiration was defined as the rate after rotenone/antimycin A application and was subtracted from the basal OCR to determine the mitochondrial OCR.
Statistical analyses
Data analysis and visualization was performed in R statistical freeware (http://www.r-project.org). Standard statistical methods were employed, including the Shapiro-Wilk Normality Test to assess normality of the data, Levene's test to assess homoscedasticity, student's t-test, ANOVA and the Kruskal-Wallis rank sum test to assess differences between the group means and Tukey (after ANOVA) and Dunnett type (After Kruskal-Wallis) post-hoc tests to assess significance for each group. We also used non-parametric contrast-based multiple comparison tests.55 Significance levels were indicated as follows: p <0.05 (*), p <0.01 (**), and p <0.001 (***). For graphics and annotation, we made use of the ggplot2 package.56
Disclosure of Potential Conflicts of Interest
No potential conflicts of interest were disclosed.
Acknowledgments
We acknowledge the invaluable contributions made by the families consenting to donate skin biopsies for fibroblast cultures. Dr. R. Hennekam (University of Amsterdam, The Netherlands) and Prof. Dr. B. Van Engelen (UMC St. Radboud University, the Netherlands) are acknowledged for sharing the HGPS (LMNA+/G608G) and LMNAY259X/Y259X cells.
Funding
This research was supported by the University of Antwerp (TTBOF/29267), the Special Research Fund of Ghent University (project BOF/11267/09), the Hercules foundation (AUGE/013), NB-Photonics (Project code 01-MR0110) and the CSBR (Centers for Systems Biology Research) initiative from the Netherlands Organization for Scientific Research (NWO; No: CSBR09/013V).
SUPPLEMENTAL MATERIAL
Supplemental data for this article can be accessed on the publisher's website..
References
- 1.Broers JLV, Ramaekers FCS, Bonne G, Yaou RB, Hutchison CJ. Nuclear lamins: laminopathies and their role in premature ageing. Physiol Rev 2006; 86:967-1008; PMID:16816143; http://dx.doi.org/ 10.1152/physrev.00047.2005 [DOI] [PubMed] [Google Scholar]
- 2.Davies BSJ, Fong LG, Yang SH, Coffinier C, Young SG. The posttranslational processing of prelamin A and disease. Annu Rev Genomics Hum G 2009; 10:153-74; http://dx.doi.org/ 10.1146/annurev-genom-082908-150150 [DOI] [PMC free article] [PubMed] [Google Scholar]
- 3.Candelario J, Borrego S, Reddy S, Comai L. Accumulation of distinct prelamin A variants in human diploid fibroblasts differentially affects cell homeostasis. Exp Cell Res 2011; 317:319-29; PMID:20974128; http://dx.doi.org/ 10.1016/j.yexcr.2010.10.014 [DOI] [PubMed] [Google Scholar]
- 4.Goldman RD, Shumaker DK, Erdos MR, Eriksson M, Goldman AE, Gordon LB, Gruenbaum Y, Khuon S, Mendez M, Varga R, et al.. Accumulation of mutant lamin A causes progressive changes in nuclear architecture in Hutchinson-Gilford progeria syndrome. Proc Natl Acad Sci USA 2004; 101:8963-8; http://dx.doi.org/ 10.1073/pnas.0402943101 [DOI] [PMC free article] [PubMed] [Google Scholar]
- 5.Navarro CL, Cadinanos J, Sandre-Giovannoli AD, Bernard R, Courrier S, Boccaccio I, Boyer A, Kleijer WJ, Wagner A, Giuliano F, et al.. Loss of ZMPSTE24 (FACE-1) causes autosomal recessive restrictive dermopathy and accumulation of Lamin A precursors. Hum Mol Genet 2005; 14:1503-13; PMID:15843403; http://dx.doi.org/ 10.1093/hmg/ddi159 [DOI] [PubMed] [Google Scholar]
- 6.Moulson CL, Go G, Gardner JM, van der Wal AC, Smitt J, van Hagen JM, Miner JH. Homozygous and compound heterozygous mutations in ZMPSTE24 cause the laminopathy restrictive dermopathy. J Invest Dermatol 2005; 125:913-9; PMID:16297189; http://dx.doi.org/ 10.1111/j.0022-202X.2005.23846.x [DOI] [PMC free article] [PubMed] [Google Scholar]
- 7.De Vos WH, Houben F, Hoebe RA, Hennekam R, van Engelen B, Manders EMM, Ramaekers FCS, Broers JLV, Van Oostveldt P. Increased plasticity of the nuclear envelope and hypermobility of telomeres due to the loss of A–type lamins. Biochim Biophys Acta- General Subjects 2010; 1800:448-58; PMID:20079404; http://dx.doi.org/ 10.1016/j.bbagen.2010.01.002 [DOI] [PubMed] [Google Scholar]
- 8.Sieprath T, Darwiche R, De Vos WH. Lamins as mediators of oxidative stress. Biochem Biophys Res Commun 2012; 421:635-9; PMID:22538370; http://dx.doi.org/ 10.1016/j.bbrc.2012.04.058 [DOI] [PubMed] [Google Scholar]
- 9.Malhas AN, Vaux DJ. The nuclear envelope and its involvement in cellular stress responses. Biochem Soc Trans 2011; 39:1795-8; PMID:22103528; http://dx.doi.org/ 10.1042/BST20110719 [DOI] [PubMed] [Google Scholar]
- 10.Barascu A, Le Chalony C, Pennarun G, Genet D, Zaarour N, Bertrand P. Oxydative stress alters nuclear shape through lamins dysregulation: A route to senescence. Nucleus 2012; 3; PMID:22895091; http://dx.doi.org/ 10.4161/nucl.21674 [DOI] [PMC free article] [PubMed] [Google Scholar]
- 11.Lattanzi G, Marmiroli S, Facchini A, Maraldi NM. Nuclear damages and oxidative stress: new perspectives for laminopathies. Eur J Histochem 2012; 56:e45; PMID:23361241; http://dx.doi.org/ 10.4081/ejh.2012.e45 [DOI] [PMC free article] [PubMed] [Google Scholar]
- 12.Caron M, Auclair M, Donadille B, Béréziat V, Guerci B, Laville M, Narbonne H, Bodemer C, Lascols O, Capeau J, et al.. Human lipodystrophies linked to mutations in A-type lamins and to HIV protease inhibitor therapy are both associated with prelamin A accumulation, oxidative stress and premature cellular senescence. Cell Death Differ 2007; 14:1759-67; PMID:17612587; http://dx.doi.org/ 10.1038/sj.cdd.4402197 [DOI] [PubMed] [Google Scholar]
- 13.Peinado JR, Quirós PM, Pulido MR, Mariño G, Martínez-Chantar ML, Vázquez-Martínez R, Freije JMP, López-Otín C, Malagón MM. Proteomic profiling of adipose tissue from Zmpste24−/− mice, a model of lipodystrophy and premature aging, reveals major changes in mitochondrial function and vimentin processing. Mol Cell Proteomics 2011; 10:M111.008094; PMID:21828285; http://dx.doi.org/ 10.1074/mcp.M111.008094 [DOI] [PMC free article] [PubMed] [Google Scholar]
- 14.Rivera-Torres J, Acín-Perez R, Cabezas-Sánchez P, Osorio FG, Gonzalez-Gómez C, Megias D, Cámara C, López-Otín C, Enríquez JA, Luque-García JL, et al.. Identification of mitochondrial dysfunction in Hutchinson-Gilford progeria syndrome through use of stable isotope labeling with amino acids in cell culture. J Proteomics 2013; 91:466-77; PMID:23969228; http://dx.doi.org/ 10.1016/j.jprot.2013.08.008 [DOI] [PubMed] [Google Scholar]
- 15.Lawless C, Wang C, Jurk D, Merz A, Zglinicki TV, Passos JF. Quantitative assessment of markers for cell senescence. Exp Gerontol 2010; 45:772-8; PMID:20117203; http://dx.doi.org/ 10.1016/j.exger.2010.01.018 [DOI] [PubMed] [Google Scholar]
- 16.Muchir A, van Engelen B, Lammens M, Mislow J, McNally E, Schwartz K, Bonne G. Nuclear envelope alterations in fibroblasts from LGMD1B patients carrying nonsense Y259X heterozygous or homozygous mutation in lamin A/C gene. Exp Cell Res 2003; 291:352-62; PMID:14644157; http://dx.doi.org/ 10.1016/j.yexcr.2003.07.002 [DOI] [PubMed] [Google Scholar]
- 17.Verstraeten VLRM, Broers JLV, van Steensel MAM, Zinn-Justin S, Ramaekers FCS, Steijlen PM, Kamps M, Kuijpers HJH, Merckx D, Smeets HJM, et al.. Compound heterozygosity for mutations in LMNA causes a progeria syndrome without prelamin A accumulation. Hum Mol Genet 2006; 15:2509-22; PMID:16825282; http://dx.doi.org/ 10.1093/hmg/ddl172 [DOI] [PubMed] [Google Scholar]
- 18.Zhang D, Cui Y, Niu L, Xu X, Tian K, Young CYF, Lou H, Yuan H. Regulation of SOD2 and β-arrestin1 by interleukin-6 contributes to the increase of IGF-1R expression in docetaxel resistant prostate cancer cells. Eur J Cell Biol 2014; 93:289-98; PMID:24939178; http://dx.doi.org/ 10.1016/j.ejcb.2014.05.004 [DOI] [PubMed] [Google Scholar]
- 19.Broers JL, Machiels BM, van Eys GJ, Kuijpers HJ, Manders EM, van Driel R, Ramaekers FC. Dynamics of the nuclear lamina as monitored by GFP-tagged A-type lamins. J Cell Sci 1999; 112 ( Pt 20):3463-75; PMID:10504295 [DOI] [PubMed] [Google Scholar]
- 20.Yu K-R, Lee S, Jung J-W, Hong I-S, Kim H-S, Seo Y, Shin T-H, Kang K-S. MicroRNA-141-3p plays a role in human mesenchymal stem cell aging by directly targeting ZMPSTE24. J Cell Sci 2013; 126:5422-31; PMID:24101728; http://dx.doi.org/ 10.1242/jcs.133314 [DOI] [PubMed] [Google Scholar]
- 21.Goulbourne CN, Malhas AN, Vaux DJ. The induction of a nucleoplasmic reticulum by prelamin A accumulation requires CTP:phosphocholine cytidylyltransferase-α. J Cell Sci 2011; 124:4253-66; PMID:22223883; http://dx.doi.org/ 10.1242/jcs.091009 [DOI] [PMC free article] [PubMed] [Google Scholar]
- 22.Richards SA, Muter J, Ritchie P, Lattanzi G, Hutchison CJ. The accumulation of un-repairable DNA damage in laminopathy progeria fibroblasts is caused by ROS generation and is prevented by treatment with N-acetyl cysteine. Hum Mol Genet 2011; 20:3997-4004; PMID:21807766; http://dx.doi.org/ 10.1093/hmg/ddr327 [DOI] [PubMed] [Google Scholar]
- 23.Pekovic V, Gibbs-Seymour I, Markiewicz E, Alzoghaibi F, Benham AM, Edwards R, Wenhert M, Zglinicki von T, Hutchison CJ. Conserved cysteine residues in the mammalian lamin A tail are essential for cellular responses to ROS generation. Aging Cell 2011; 10:1067-79; PMID:21951640; http://dx.doi.org/ 10.1111/j.1474-9726.2011.00750.x [DOI] [PubMed] [Google Scholar]
- 24.Lattanzi G, Ortolani M, Columbaro M, Prencipe S, Mattioli E, Lanzarini C, Maraldi NM, Cenni V, Garagnani P, Salvioli S, et al.. Lamins are rapamycin targets that impact human longevity: a study in centenarians. J Cell Sci 2014; 127:147-57; PMID:24155329; http://dx.doi.org/ 10.1242/jcs.133983 [DOI] [PubMed] [Google Scholar]
- 25.Korshunov SS, Skulachev VP, Starkov AA. High protonic potential actuates a mechanism of production of reactive oxygen species in mitochondria. FEBS Lett 1997; 416:15-8; PMID:9369223; http://dx.doi.org/ 10.1016/S0014-5793(97)01159-9 [DOI] [PubMed] [Google Scholar]
- 26.Turrens JF. Mitochondrial formation of reactive oxygen species. J Physiol 2003; 552:335-44; PMID:14561818; http://dx.doi.org/ 10.1113/jphysiol.2003.049478 [DOI] [PMC free article] [PubMed] [Google Scholar]
- 27.Maharjan S, Oku M, Tsuda M, Hoseki J, Sakai Y. Mitochondrial impairment triggers cytosolic oxidative stress and cell death following proteasome inhibition. Sci Rep 2014; 4:5896; PMID:25077633; http://dx.doi.org/ 10.1038/srep05896 [DOI] [PMC free article] [PubMed] [Google Scholar]
- 28.Parnaik VK, Chaturvedi P, Muralikrishna B. Lamins, laminopathies and disease mechanisms: possible role for proteasomal degradation of key regulatory proteins. J Biosci 2011; 36:471-9; PMID:21799258; http://dx.doi.org/ 10.1007/s12038-011-9085-2 [DOI] [PubMed] [Google Scholar]
- 29.Muchir A, Massart C, van Engelen BG, Lammens M, Bonne G, Worman HJ. Proteasome-mediated degradation of integral inner nuclear membrane protein emerin in fibroblasts lacking A-type lamins. Biochemical and Biophysical Research Communications 2006; 351:1011-7; PMID:17097067; http://dx.doi.org/ 10.1016/j.bbrc.2006.10.147 [DOI] [PMC free article] [PubMed] [Google Scholar]
- 30.Chen C-Y, Chi Y-H, Mutalif RA, Starost MF, Myers TG, Anderson SA, Stewart CL, Jeang K-T. Accumulation of the inner nuclear envelope protein Sun1 is pathogenic in progeric and dystrophic laminopathies. Cell 2012; 149:565-77; PMID:22541428; http://dx.doi.org/ 10.1016/j.cell.2012.01.059 [DOI] [PMC free article] [PubMed] [Google Scholar]
- 31.Muralikrishna B, Chaturvedi P, Sinha K, Parnaik VK. Lamin misexpression upregulates three distinct ubiquitin ligase systems that degrade ATR kinase in HeLa cells. Mol Cell Biochem 2012; 365:323-32; PMID:22382637; http://dx.doi.org/ 10.1007/s11010-012-1272-4 [DOI] [PubMed] [Google Scholar]
- 32.Osorio FG, Barcena C, Soria-Valles C, Ramsay AJ, de Carlos F, Cobo J, Fueyo A, Freije JMP, Lopez-Otin C. Nuclear lamina defects cause ATM-dependent NF- B activation and link accelerated aging to a systemic inflammatory response. Genes Dev 2012; 26:2311-24; PMID:23019125; http://dx.doi.org/ 10.1101/gad.197954.112 [DOI] [PMC free article] [PubMed] [Google Scholar]
- 33.Chien Y, Scuoppo C, Wang X, Fang X, Balgley B, Bolden JE, Premsrirut P, Luo W, Chicas A, Lee CS, et al.. Control of the senescence-associated secretory phenotype by NF- B promotes senescence and enhances chemosensitivity. Genes Dev 2011; 25:2125-36; PMID:21979375; http://dx.doi.org/ 10.1101/gad.17276711 [DOI] [PMC free article] [PubMed] [Google Scholar]
- 34.Kojima H, Kunimoto H, Inoue T, Nakajima K. The STAT3-IGFBP5 axis is critical for IL-6/gp130-induced premature senescence in human fibroblasts. Cell Cycle 2012; 11:730-9; PMID:22374671; http://dx.doi.org/ 10.4161/cc.11.4.19172 [DOI] [PubMed] [Google Scholar]
- 35.De Vos WH, Houben F, Kamps M, Malhas A, Verheyen F, Cox J, Manders EMM, Verstraeten VLRM, van Steensel MAM, Marcelis CLM, et al.. Repetitive disruptions of the nuclear envelope invoke temporary loss of cellular compartmentalization in laminopathies. Hum Mol Genet 2011; 20:4175-86; PMID:21831885; http://dx.doi.org/ 10.1093/hmg/ddr344 [DOI] [PubMed] [Google Scholar]
- 36.Houben F, De Vos WH, Krapels IPC, Coorens M, Kierkels GJJ, Kamps MAF, Verstraeten VLRM, Marcelis CLM, van den Wijngaard A, Ramaekers FCS, et al.. Cytoplasmic localization of PML particles in laminopathies. Histochemistry & Cell Biology 2013; 139:119-34; PMID:22918509; http://dx.doi.org/ 10.1007/s00418-012-1005-5 [DOI] [PubMed] [Google Scholar]
- 37.Sahin U, Ferhi O, Jeanne M, Benhenda S, Berthier C, Jollivet F, Niwa-Kawakita M, Faklaris O, Setterblad N, de Thé H, et al.. Oxidative stress-induced assembly of PML nuclear bodies controls sumoylation of partner proteins. J Cell Biol 2014; 204:931-45; PMID:24637324; http://dx.doi.org/ 10.1083/jcb.201305148 [DOI] [PMC free article] [PubMed] [Google Scholar]
- 38.Guo S, Cheng X, Lim J-H, Liu Y, Kao H-Y. Control of antioxidative response by the tumor suppressor protein PML through regulating Nrf2 activity. Mol Biol Cell 2014; 25:2485-98; PMID:24943846; http://dx.doi.org/ 10.1091/mbc.E13-11-0692 [DOI] [PMC free article] [PubMed] [Google Scholar]
- 39.Giovannini C, Matarrese P, Scazzocchio B, Sanchez M, Masella R, Malorni W. Mitochondria hyperpolarization is an early event in oxidized low-density lipoprotein-induced apoptosis in Caco-2 intestinal cells. FEBS Lett 2002; 523:200-6; PMID:12123832; http://dx.doi.org/ 10.1016/S0014-5793(02)02972-1 [DOI] [PubMed] [Google Scholar]
- 40.Nagy G, Koncz A, Perl A. T cell activation-induced mitochondrial hyperpolarization is mediated by Ca2+- and redox-dependent production of nitric oxide. J Immunol 2003; 171:5188-97; PMID:14607919; http://dx.doi.org/ 10.4049/jimmunol.171.10.5188 [DOI] [PMC free article] [PubMed] [Google Scholar]
- 41.Liu J, Yin X, Liu B, Zheng H, Zhou G, Gong L, Li M, Li X, Wang Y, Hu J, et al.. HP1α mediates defective heterochromatin repair and accelerates senescence in Zmpste24-deficient cells. Cell Cycle 2014; 13:1237-47; PMID:24584199; http://dx.doi.org/ 10.4161/cc.28105 [DOI] [PMC free article] [PubMed] [Google Scholar]
- 42.Liu Y, Drozdov I, Shroff R, Beltran LE, Shanahan CM. Prelamin A Accelerates Vascular Calcification Via Activation of the DNA Damage response and senescence-associated secretory phenotype in vascular smooth muscle cells. Circ Res 2013; 112:e99-e109; PMID:23564641; http://dx.doi.org/ 10.1161/CIRCRESAHA.111.300543 [DOI] [PubMed] [Google Scholar]
- 43.Plasilova M, Chattopadhyay C, Ghosh A, Wenzel F, Demougin P, Noppen C, Schaub N, Szinnai G, Terracciano L, Heinimann K. Discordant gene expression signatures and related phenotypic differences in lamin A- and A/C-related Hutchinson-Gilford progeria syndrome (HGPS). PLoS ONE 2011; 6:e21433; PMID:21738662; http://dx.doi.org/ 10.1371/journal.pone.0021433 [DOI] [PMC free article] [PubMed] [Google Scholar]
- 44.Lammerding J, Schulze PC, Takahashi T, Kozlov S, Sullivan T, Kamm RD, Stewart CL, Lee RT. Lamin A/C deficiency causes defective nuclear mechanics and mechanotransduction. J Clin Invest 2004; 113:370-8; PMID:14755334; http://dx.doi.org/ 10.1172/JCI200419670 [DOI] [PMC free article] [PubMed] [Google Scholar]
- 45.Lu D, Lian H, Zhang X, Shao H, Huang L, Qin C, Zhang L. LMNA E82K mutation activates FAS and mitochondrial pathways of apoptosis in heart tissue specific transgenic mice. PLoS ONE 2010; 5:e15167; PMID:21151901; http://dx.doi.org/ 10.1371/journal.pone.0015167 [DOI] [PMC free article] [PubMed] [Google Scholar]
- 46.Wolf CM, Wang L, Alcalai R, Pizard A, Burgon PG, Ahmad F, Sherwood M, Branco DM, Wakimoto H, Fishman GI, et al.. Lamin A/C haploinsufficiency causes dilated cardiomyopathy and apoptosis-triggered cardiac conduction system disease. J Mol Cell Cardiol 2008; 44:293-303; PMID:18182166; http://dx.doi.org/ 10.1016/j.yjmcc.2007.11.008 [DOI] [PMC free article] [PubMed] [Google Scholar]
- 47.Childs BG, Baker DJ, Kirkland JL, Campisi J, van Deursen JM. Senescence and apoptosis: dueling or complementary cell fates? EMBO Rep 2014; 15:1139-53; PMID:25312810; http://dx.doi.org/ 10.15252/embr.201439245 [DOI] [PMC free article] [PubMed] [Google Scholar]
- 48.Chen QM, Liu J, Merrett JB. Apoptosis or senescence-like growth arrest: influence of cell-cycle position, p53, p21 and bax in H2O2 response of normal human fibroblasts. Biochem J 2000; 347:543-51; PMID:10749685; http://dx.doi.org/ 10.1042/0264-6021:3470543 [DOI] [PMC free article] [PubMed] [Google Scholar]
- 49.Bladier C, Wolvetang EJ, Hutchinson P, de Haan JB, Kola I. Response of a primary human fibroblast cell line to H2O2: senescence-like growth arrest or apoptosis? Cell Growth Differ 1997; 8:589-98; PMID:9149910 [PubMed] [Google Scholar]
- 50.Macip S, Igarashi M, Berggren P, Yu J, Lee SW, Aaronson SA. Influence of induced reactive oxygen species in p53-mediated cell fate decisions. Mol Cell Biol 2003; 23:8576-85; PMID:14612402; http://dx.doi.org/ 10.1128/MCB.23.23.8576-8585.2003 [DOI] [PMC free article] [PubMed] [Google Scholar]
- 51.Livak KJ, Schmittgen TD. Analysis of relative gene expression data using real-time quantitative PCR and the 2(-Delta Delta C(T)) Method. Methods 2001; 25:402-8; PMID:11846609; http://dx.doi.org/ 10.1006/meth.2001.1262 [DOI] [PubMed] [Google Scholar]
- 52.Dixit R, Cyr R. Cell damage and reactive oxygen species production induced by fluorescence microscopy: effect on mitosis and guidelines for non-invasive fluorescence microscopy. Plant J 2003; 36:280-90; PMID:14535891; http://dx.doi.org/ 10.1046/j.1365-313X.2003.01868.x [DOI] [PubMed] [Google Scholar]
- 53.Mukhopadhyay P, Rajesh M, Haskó G, Hawkins BJ, Madesh M, Pacher P. Simultaneous detection of apoptosis and mitochondrial superoxide production in live cells by flow cytometry and confocal microscopy. Nat Protoc 2007; 2:2295-301; PMID:17853886; http://dx.doi.org/ 10.1038/nprot.2007.327 [DOI] [PMC free article] [PubMed] [Google Scholar]
- 54.De Vos WH, Van Neste L, Dieriks B, Joss GH, Van Oostveldt P. High content image cytometry in the context of subnuclear organization. Cytometry A 2010; 77:64-75; PMID:19821512 [DOI] [PubMed] [Google Scholar]
- 55.Konietschke F, Hothorn LA, Brunner E. Rank-based multiple test procedures and simultaneous confidence intervals. Electronic Journal of Statistics 2012; 6:738-59; http://dx.doi.org/ 10.1214/12-EJS691 [DOI] [Google Scholar]
- 56.Wickham H. ggplot2: Elegant Graphics for Data Analysis. Springer Science & Business Media; 2009; https://dx.doi.org/ 10.1007/978-0-387-98141-3 [DOI] [Google Scholar]
Associated Data
This section collects any data citations, data availability statements, or supplementary materials included in this article.