Abstract
Gaucher disease is an autosomal recessive disorder caused by deficiency of the enzyme glucocerebrosidase. Although it is a monogenic disease, there is vast phenotypic heterogeneity, even among patients with the same genotype. MicroRNAs (miRNAs) are small non-coding RNAs involved in many biological processes and diseases. To determine whether miRNAs can affect glucocerebrosidase activity, we performed a screen of 875 different miRNA mimics. The screen was performed using Gaucher fibroblasts, and glucocerebrosidase activity was used as the initial outcome parameter. We found several miRNAs that either up- or down-regulated glucocerebrosidase activity. In follow-up assays, we confirmed that one specific miRNA (miR-127–5p) down-regulated both glucocerebrosidase activity and protein levels by down-regulation of LIMP-2, the receptor involved in proper trafficking of glucocerebrosidase from the endoplasmic reticulum to the lysosome. A conditioned media assay demonstrated that cells treated with this miRNA secreted glucocerebrosidase into the extracellular environment, supporting impaired LIMP-2 function. Two other miRNAs, miR-16–5p and miR-195–5p, were found to up-regulate glucocerebrosidase activity by greater than 40% and to enhance expression and protein levels of the enzyme. In conclusion, we show that miRNAs can alter glucocerebrosidase activity in patient cells, indicating that miRNAs can potentially act as modifiers in Gaucher disease.
Keywords: Gaucher Disease, GBA, GCase, glucocerebrosidase, mimics, miRNA, screen
Abbreviations
- GCase
glucocerebrosidase
- GD
Gaucher disease
- miRNA
microRNA
- NegCtrl siRNA
negative control siRNA
- UTR
untranslated region
- WT
Wild Type
Introduction
Gaucher disease (GD) is the most common lysosomal storage disorder worldwide. Overall, the disease frequency has been estimated between 1:40,000 and 1:60,000 individuals in the general population, while it has a higher frequency in the Ashkenazi Jewish population (1:850 individuals).1,2 GD, an autosomal recessive disorder, has been clinically subdivided according to severity of symptoms and involvement of the Central Nervous System (CNS).1 Clinical manifestations in patients with type 1 or non-neuronopathic GD (OMIM #230800) range from asymptomatic individuals to children with significant hepatosplenomegaly, anemia, thrombocytopenia, and bone disease. Type 2 or acute neuronopathic GD (OMIM #230900) is the most severe form, leading to a very short life expectancy (less than 2 years) due to devastating and rapidly progressive neurological impairment. The intermediate form of GD is type 3 or chronic neuronopathic (OMIM #2301000). Although patients with type 3 GD also have CNS involvement, these symptoms often develop later, and the progression of the disease is less aggressive. Generally, all 3 GD types are characterized by hepatosplenomegaly, anemia, thrombocytopenia, and bone involvement.1,3
Glucocerebrosidase (GCase, E.C. 3.2.1.45) is the lysosomal enzyme responsible for the degradation of glucocerebroside (GC) into glucose and ceramide. This enzyme is deficient or absent in patients with GD, resulting in the accumulation of GC within lysosomes of macrophages.1 GCase is encoded by the GBA1 gene on chromosome 1q21.4 Approximately 300 different disease-causing mutations have been identified throughout the 11 exons of GBA1. Some are more common in patients with specific ethnicities; for instance, N370S (c.1226A > G) in Ashkenazi Jews.5 Although there is some correlation between genotype and phenotype in GD, often mutations in GBA1 cannot be used to predict a patient's clinical symptoms. Studies have demonstrated that patients with the same genotype, even twins and sibling pairs, can have differences in disease severity and response to treatment.6,7 While GD has been considered a simple monogenic disorder, this paradigm is being challenged due to the vast phenotype heterogeneity, as well as the variable therapeutic responsiveness. Thus, additional factors are likely involved in GD, such as epigenetic elements and modifier genes.8 To date, a few well-defined modifier genes have been identified that modulate and regulate GCase protein levels or activity. Two important modifiers are Saposin C (SapC), an activator of GCase encoded by the PSAP gene,9 and Lysosomal Integral Membrane Protein type 2 (LIMP-2), encoded by SCARB2, a receptor responsible for the sorting of GCase to the lysosomes.10 However, these modifiers do not fully explain all of the divergent clinical findings encountered in patients sharing the same genotype. For this reason, it is necessary to identify other pathways that may affect GCase function in patients with GD in order to better understand disease pathogenesis and to identify targets for future therapeutic approaches.
One class of small non-coding RNAs, microRNAs (miRNAs), play a very important role as regulators of gene expression in plants, animals and viruses. Mature miRNA duplexes are approximately 22 nucleotides in length and bind to their mRNA targets primarily in the 3′ untranslated region (UTR) through critical nucleotides 2–8 at the 5′ end of the miRNA sequence (seed sequence). miRNAs mediate gene silencing post-transcriptionally by mRNA degradation and/or repression of translation.11 Hundreds of genes and corresponding pathways can be potentially regulated by a unique miRNA, and numerous miRNAs can control a specific mRNA.12 miRNAs are involved in many biological processes including the stress response,13 inflammation,14 heart diseases,11 autophagy,15 apoptosis, cancer,12 neurological diseases such as Alzheimer and Parkinson diseases,16 and many more. Because of the diverse functional roles of miRNAs in many processes and diseases, these small RNAs are being explored as disease-related biomarkers and are being considered in a variety of therapeutic applications (either as miRNA antagonists or miRNA mimics).
The limited genotype-phenotype correlations in GD, as well as the remarkable importance of miRNAs in a wide range of biological processes, prompted us to investigate whether miRNAs could affect GCase activity. To address this question, we conducted miRNA mimic screening to identify miRNAs that regulate GCase activity in N370S/N370S Gaucher fibroblasts. We found that GCase activity can be altered by select miRNA mimics, and that some of these effects can be explained by the down- or up-regulation of GBA1 mRNA levels, GCase protein levels and/or by affecting other proteins related to GCase, such as LIMP-2.
Results
miRNA screening, hit selection, and reconfirmation
In the present study, miRNA mimic screening (Sanger miRBase 13.0) was performed in WT and N370S/N370S Gaucher fibroblasts to evaluate the effects of introducing different miRNAs in increased abundance on GCase activity. Primary screening was performed in duplicate, and after 72 hours of incubation GCase activity was evaluated. GCase enzyme activity was chosen as the outcome parameter, while cell viability was measured in corresponding plates to identify miRNAs affecting cell viability. A summary of the entire workflow is shown in Figure 1, and all screening data can be found in the Supplementary Table S1.
Figure 1.
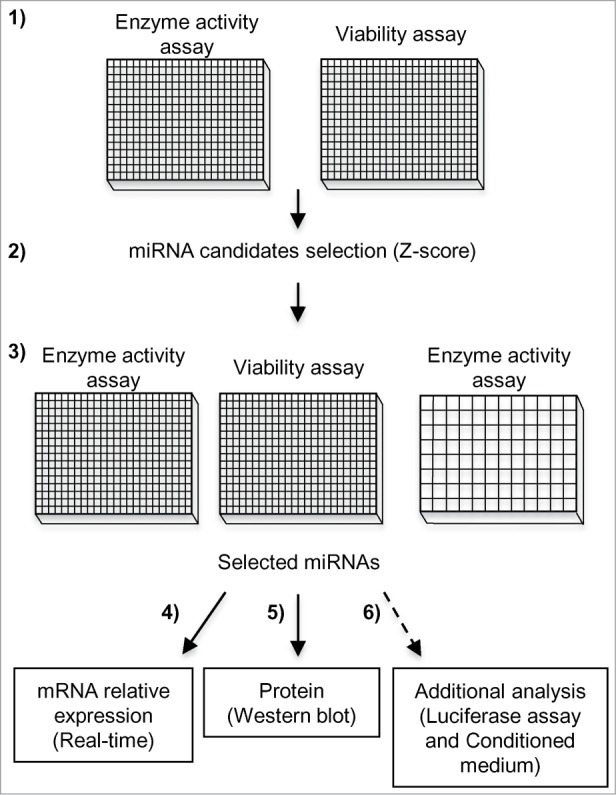
Experimental workflow of miRNA mimic screening and follow-up. (1) The primary miRNA screen was performed in duplicate, assaying both GCase activity and cell viability in WT and N370S/N370S Gaucher fibroblasts. (2) miRNA candidates were chosen based on the GCase Z-score, with consideration of their effect on viability. (3) Results were confirmed by retesting selected miRNAs in both 384- and 96-well plates. Then, the top 5 miRNAs that upregulated and 3 miRNAs that down-regulated GCase activity were selected for further studies. (4) The mRNA relative expression of GBA1, SCARB2 and PSAP was evaluated by real-time PCR. (5) Changes in protein levels were investigated by Western blot. (6) Additional studies were performed on miRNA candidates identified in the previous step.
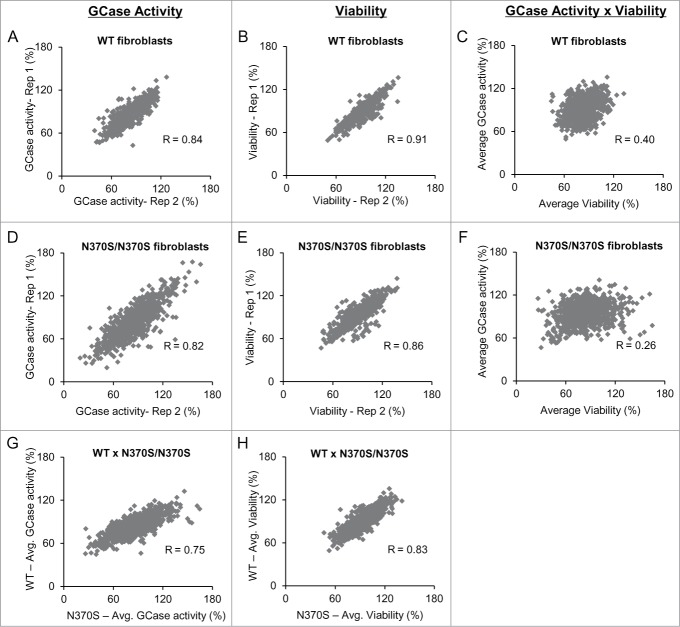
For both WT and N370S/N370S Gaucher fibroblasts, the control samples on each assay plate were consistent, independent of cell type or assay (activity or viability - Supplementary Fig. 1). Replicates for GCase enzyme activity and viability assays also showed consistent and reproducible results, both for WT (Fig. 2A and B) and N370S/N370S (Figs. 2D and E) lines. When we compared GCase activity and viability, the correlation was not strong in either cell type, indicating that the observed miRNA effects were not strictly related to cell toxicity or number (Figs. 2C and F). Moreover, a comparison of the primary screening data (Figs. 2G and H) indicated that the results were reproducible in both cell types.
Figure 2.
Primary screening data showed consistent results between replicates and different cell lines. Replicates of GCase activity (A and D) and viability (B and E) signal measured in WT and N370S/N370S cells, respectively. Correlation between GCase activity and viability in WT (C) and N370S/N370S (F) fibroblasts showed that the signal was impacted by cell viability. Comparison of the results of enzyme activity (G) and viability (H) in both cell types. All data is represented as % negative control siRNA.
Based on the primary screening data, we selected 13 miRNAs that up-regulated and 8 that down-regulated GCase activity. Selected candidates exhibited a Z-score of at least +/- 2 in N370S/N370S cells and did not affect viability by more than one standard deviation. To confirm our findings, we performed follow-up testing in 384- (Figs. 3A and B) and 96-well (Figs. 3C and D) plates under the same conditions as the primary screen. Our results were similar regardless of the cell number or reagents used. From the 21 miRNAs chosen for reconfirmation (Fig. 3), 8 of the most active, including 5 miRNAs that up-regulated (miR-195–5p, miR-16–5p, miR-765, miR-493–5p, and miR-1243) and 3 that down-regulated (miR-127–5p, miR-19a-5p, and miR-1262) GCase activity, were selected for further studies. These 8 mimics were also shown to be active in a different N370S/N370S Gaucher fibroblast line from that used for the primary screen (Fig. 4).
Figure 3.
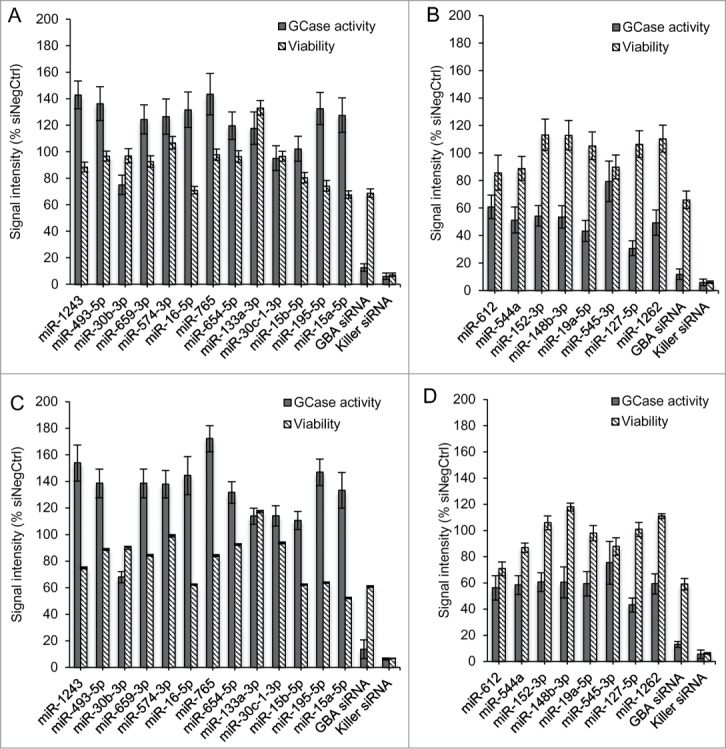
Experiments confirming the top miRNA hits using N370S/N370S Gaucher fibroblasts. Selected miRNA up-regulators (A) and down-regulators (B) of GCase activity were plated in a 384-well format. The same experiment was also performed in 96-well plates (C and D). Results were consistent between 384- and 96-well plates. Data is presented with the average and standard deviation for replicate wells (384-well n = 16 , 96-well n = 8 ).
Figure 4.
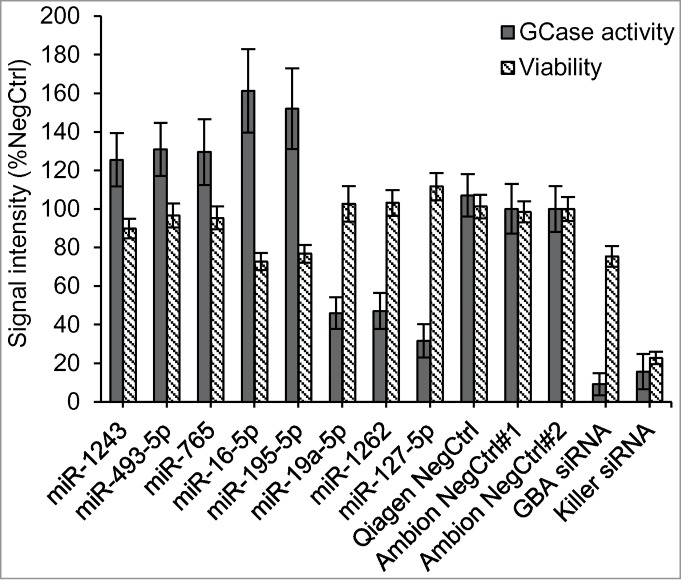
Additional N370S/N370S Gaucher lines were used to confirm the effect of the 8 best active miRNA candidates on GCase activity and viability. In addition to the NegCtrl (Ambion NegCtrl#2) used for normalization, the experiment had 2 other negative controls, Ambion NegCtrl#1 and Qiagen NegCtrl. Results represent the average value along with the standard deviation for replicate wells. The experiment was performed in a 384-well plate (16 replicates for each siRNA/miRNA).
Analysis of GBA1, SCARB2 and PSAP expression levels in N370S/N370S cells
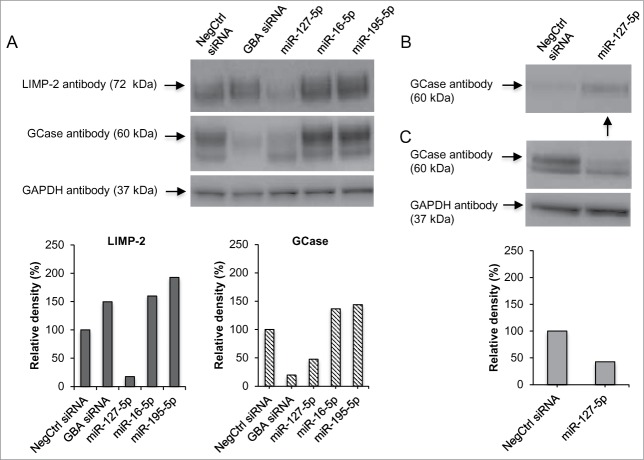
We hypothesized that a decrease or increase of the GCase activity by specific miRNAs could be due to changes in the mRNA expression levels of GBA1 or other genes that regulate GBA1 expression. Gene expression was measured by real-time PCR based on the 2-ΔΔCt method. To identify alterations in GBA1 levels, we compared GBA1 expression in N370S/N370S Gaucher cells transfected with selected miRNAs (miR-195–5p, miR-16–5p, miR-765, miR-493–5p, miR-1243, miR-127–5p, miR-19a-5p, and miR-1262) to cells transfected with NegCtrl siRNA. As expected, cells transfected with GBA siRNA showed significant reduction of GBA1 expression when compared to cells treated with NegCtrl siRNA (p < 0.001; Fig. 5A). None of the 3 miRNAs that down-regulated GCase enzyme activity (miR-127–5p, miR-19a-5p, and miR-1262) strongly affected GBA1 expression (< 50%, p > 0.001). On the other hand, 2 (miR-195–5p and miR-16–5p) of the 5 up-regulators showed a significant increase in GBA1 expression compared to control (> 2-fold, p < 0.001). Moreover, both miRNAs increased GCase protein levels by approximately 40% compared to NegCtrl siRNA (Fig. 6A and Supplementary Figure S2).
Figure 5.
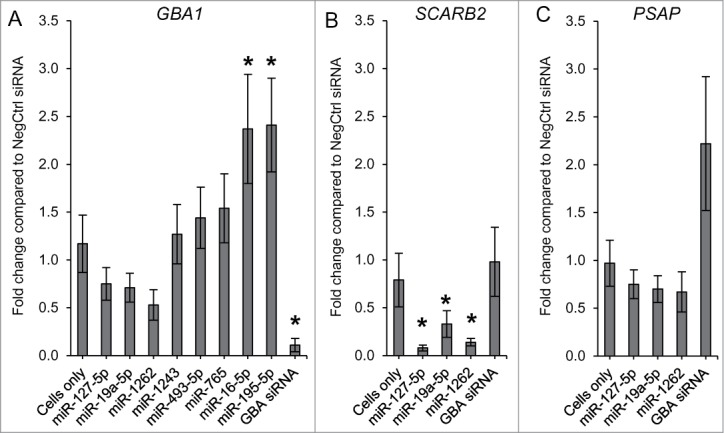
mRNA expression profiles evaluated in N370S/N370S fibroblasts after a 72 hour transfection with selected miRNAs that down- and up-regulated GCase activity. GBA1 (A), SCARB2 (B) and PSAP (C) levels were analyzed by real-time PCR. Error bars represent 95% of confidence intervals (CI). *Indicates p-value < 0.001 compared to NegCtrl siRNA.
Figure 6.
Analyses of GCase and LIMP-2 levels and GCase secretion into the extracellular environment. (A) Western blot shows a reduced amount of GCase after transfection with GBA siRNA and miR-127–5p compared to the NegCtrl siRNA. Conversely, GCase amount is increased in cells treated with miR-16–5p and miR-195–5p. LIMP-2 levels are decreased by miR-127–5p. The lower graphs indicate the percentage of relative density of each band normalized to the corresponding GAPDH band. (B) Evaluation of conditioned media shows GCase secretion (arrow) into the extracellular environment after transfection with miR-127–5p, compared to cells treated with NegCtrl siRNA. (C) Corresponding cell lysates from the conditioned media experiment show reduced GCase protein levels in N370S/N370S cells transfected with miR-127–5p. The bottom graph represents the intensity of each band normalized to the corresponding GAPDH band. For the relative density calculations in both (A) and (C), NegCtrl was considered as 100%.
Since the miRNA down-regulators did not have a large effect on GBA1 expression, we hypothesized that these miRNAs might act on the expression levels of known modifiers of GCase enzyme activity such as SCARB2 and PSAP. In N370S/N370S fibroblasts, SCARB2 expression was significantly down-regulated by miR-127–5p, miR-19a-5p, and miR-1262 (p < 0.001; Fig. 5B). miR-127–5p and miR-1262 caused a greater reduction compared to miR-19a-5p. Moreover, miR-127–5p led to a strong reduction in LIMP-2 protein levels (Fig. 6A). There was no statistically significant difference in PSAP after miRNA transfection compared to control. The only exception was cells transfected with GBA siRNA that showed a greater than 100% increase in PSAP expression (Fig. 5C). This result is in agreement with other studies showing a compensatory increase in PSAP in cells with GCase deficiency.9
miR-127–5p treatment results in the secretion of GCase
It is known that LIMP-2 is the receptor for the trafficking of GCase to the lysosome. Studies on SCARB2 knockout mice, as well as patient fibroblasts carrying mutations in SCARB2, showed no change in GBA1 mRNA levels, but decreased GCase activity and protein levels due to GCase missorting and its subsequent secretion into the extracellular environment.10,17 This prompted an evaluation of the effect of miR-127–5p on GCase secretion. After treating WT and N370S/N370S Gaucher fibroblasts with miR-127–5p and NegCtrl siRNA, the conditioned media was collected, filtered and the protein was concentrated by centrifugation. GCase protein levels were then analyzed by Western blot, with equal volumes of lysed cells loaded to ensure that the conditioned media was collected from an equal amount of cells for each condition. The conditioned media analysis was performed on 2 different N370S/N370S Gaucher fibroblast lines, including the one used in the primary screen (Fig. 6) and another used for confirmation (Supplementary Figure S3). Both Gaucher lines treated with miR-127–5p showed reduced GCase protein levels in cell lysates compared to cells treated with NegCtrl siRNA (approximately 50% of reduction; Figs.6A and C, Supplementary Figure S3), while the corresponding conditioned media samples revealed increased levels of secreted GCase enzyme (Fig. 6B). As expected, while N370S/N370S fibroblasts showed reduced expression of GCase compared to WT, cells without siRNA ("Cells only") or with NegCtrl siRNA showed similar results (Supplementary Figure S3B). N370S/N370S fibroblasts treated with miR-127–5p showed a reduced amount GCase compared to NegCtrl siRNA (Supplementary Figure S3B). As shown in both Figure 6B and Supplementary Figure S3A, the reduction of GCase appears to result from the secretion of GCase into the extracellular environment. This is not seen in WT cells and N370S/N370S cells treated without/with NegCtrl siRNA (Supplementary Figure S3A). These results suggest that expression of miR-127–5p down-regulates GCase activity and protein levels by down-regulating SCARB2 expression.
SCARB2 is a direct target of miR-127–5p
Next, we evaluated whether SCARB2 is a direct target of miR-127–5p. Although not conserved, SCARB2 contains 2 potential miR-127–5p target sites in its 3′UTR region (http://www.microrna.org/). To analyze whether miR-127–5p directly interacts with these predicted sites, we used a SCARB2 3′UTR luciferase reporter assay. HEK293 cells were transfected with the resulting pMir-SCARB2 3′UTR or with the control plasmid. Twenty-four hours after transfection, cells were treated with miR-127–5p or NegCtrl siRNA. As expected, miR-127–5p had no effect on the luciferase activity of the control plasmid. In contrast, HEK293 cells transfected with pMir-SCARB2 3′UTR showed significant reduction in reporter activity after transfection with miR-127–5p compared to cells treated with NegCtrl siRNA (p < 0.001; Fig. 7). These data strongly support that miR-127–5p can directly target SCARB2.
Figure 7.
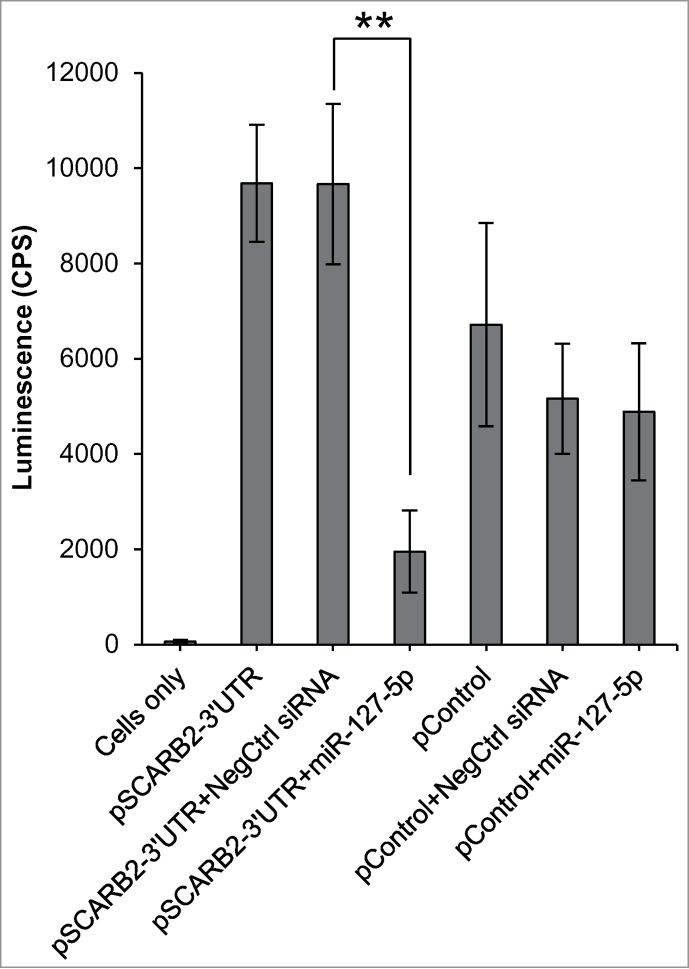
miR-127–5p directly interacts with the SCARB2 3'UTR. HEK293 cells were transfected with a control (empty plasmid) or SCARB2 3'UTRluciferase plasmid along with the miR-127–5p or NegCtrl siRNA and luciferase activity was measured. Error bars represent 95% of confidence intervals (CI). **Indicates p-value < 0.0001 compared to NegCtrl siRNA. CPS: counts per second.
Discussion
Understanding the biological relevance of miRNAs in human disease depends primarily on the identification of the targets involved. In the present study, we conducted a miRNA mimic screen to identify miRNA sequences that modulate GCase enzymatic activity in N370S/N370S Gaucher fibroblasts. The screening identified a number of mimics that up-regulated or down-regulated GCase activity without a correlative effect on cell viability. Many of the hits were reconfirmed in independent tests in the same and an additional Gaucher fibroblast line; several mimics increased GCase activity by over 1.4-fold, which is thought to be of potential clinical significance.18,19 Notably, a number of enhancers shared the same hexamer miRNA seed sequence (AGCAGC) including members of the miR-15/16/195/424/497 family. Further studies using 2 of these family members (miR-16–5p and miR-195–5p) revealed increased levels of both GBA1 transcript and GCase protein. Although the mechanism underlying the upregulation is unclear, miRNAs can enhance transcript and protein levels through a variety of means, including interactions with promoter regions (RNA activation (RNAa), reviewed in20,21); stabilization of mRNA by blocking destabilizing proteins22; and through the down-regulation of proteins that negatively regulate transcription factors. For example, miR-16 can enhance NF-kB driven expression of inflammatory response genes through the down-regulation of SMRT.23 Additional studies are needed to further elucidate how members of the miR-15/16/195/424/497 family act to up-regulate GBA1 transcript levels.
In addition to up-regulation, a number of the miRNA mimics decreased GCase activity. Since miRNAs typically down-regulate target transcripts through interactions with their 3′UTR, we investigated their ability to down-regulate the transcript levels of GBA1 and the known GCase modifiers SCARB2 and PSAP. Surprisingly, all 3 mimics were found to significantly down-regulate SCARB2. In silico target prediction for the strongest of these (miR-127–5p) did not identify conserved binding sites.24 However, closer inspection revealed 2 seed matches in the SCARB2 3′UTR. A SCARB2 3′UTR luciferase reporter assay confirmed direct targeting of SCARB2 by miR-127–5p. Levels of LIMP-2 protein, encoded by the SCARB2 gene, were also down-regulated in fibroblasts treated with miR-127–5p. LIMP-2 is critical for the proper trafficking of GCase from the ER to lysosomes. Defects in LIMP-2 result in the extracellular secretion of GCase. Accordingly, we found that treatment with miR-127–5p led to increased levels of GCase in the supernatant, supporting its impact on LIMP-2 function.
The identification of miRNA sequences that modulate GCase activity enhances our understanding of GCase regulation, and may aid in the identification of additional protein targets and potential therapeutic strategies. In fact, mimic sequences themselves may prove useful as specific miRNA mimics are being studied in the clinic for other disorders.25,26 However, some of the identified candidates may not be optimal starting points in this regard. Notably, miR-15/16/195/424/497 family members have been shown to regulate key cell cycle genes and also to induce apoptosis,27-29 which may be attractive for targeting cancer, but perhaps not for other diseases. However, for a number of the other mimics (e.g., miR-765 and miR-1243), the mechanism underlying the enhancement of GCase activity is unclear. It will be important to further explore their effect on both on GCase activity, and on other genes and pathways.
Taken together, our data demonstrates that specific miRNAs affect GCase activity. Our data strongly suggests that in the case of miR-127–5p, the modulation of GCase activity occurs via regulation of the LIMP-2 receptor. miR-16–5p and miR-195–5p likely up-regulate GCase activity through another, yet unknown pathway. Further studies are needed to validate the role of specific miRNAs or miRNA families in cellular pathways related to GD pathogenesis. Such miRNAs may provide new therapeutic avenues for patients with GD.
Materials and Methods
Cell lines and cell culture
Human wild type (WT) primary fibroblasts and N370S/N370S Gaucher fibroblasts were used in this study. Cells were grown in monolayers and maintained using growth medium (Dulbecco's Modified Eagle Medium (DMEM) with high glucose (Life Technologies)), supplemented with 10% Fetal Bovine Serum (FBS; Life Technologies) and antibiotic-antimycotic (Life Technologies) at 37ºC in a humidified 5% CO2 incubator.
miRNA mimic screening
Fibroblast cells were screened with the Human miRNA Mimic Library (Qiagen) consisting of 875 different miRNAs (Sanger 13.0). Primary screening was performed in duplicate both for GCase activity and viability in 384-well plates. Sixteen wells containing Silencer Select Negative Control #2 (“NegCtrl;" Ambion) were included on all plates for data normalization. GBA siRNA (Ambion Silencer Select, cat# s5612, target sequence CCCAAUUGGGUGCGUAACUUU) and AllStars Hs Cell Death (“Killer;” Qiagen) were included as positive assay/transfection controls for GCase and viability screens, respectively. For transfection, 0.8 pmol of each miRNA or siRNA was initially spotted to the corresponding wells, followed by the addition of 20 μL of serum-free DMEM containing 0.15 μL of Lipofectamine RNAiMax (Life Technologies) per well. Plates were incubated at room temperature for 45 min. Following incubation, 1.2 × 10³ cells in 20 μL of DMEM supplemented with 20% FBS (containing no antibiotic-antimycotic) were added to each well. Transfected cells were incubated at 37ºC in 5% CO2 for 72 hours. After assaying, sample well data was normalized to the median value for the NegCtrl wells on respective assay plates. The average was taken for each replicate, and a Z-score was then calculated for each mimic, using the mean and standard deviation of each screen respectively. All screening data can be found in Supplementary Table S1. Hit selection focused on those mimics exhibiting a Z-score of > +/− 2 in N370S/N370S Gaucher fibroblasts. A small edge effect was noted that resulted in a ∼15% increase in GCase signal from edge wells. Accordingly, a b-score correction was applied to avoid the selection of false positives from wells in the outermost columns and rows arising from this edge effect. Viability data was used to filter out mimics that also caused an appreciable increase or decrease in viable cells (+/− 1 standard deviation from the screen mean).
GCase activity assay
GCase screening was conducted in black clear bottom 384-well plates (Corning 3712). Seventy-two hours after transfection, the medium was removed, and the cells were washed once with 1X phosphate buffered saline (PBS; Life Technologies). Twenty microliters of assay buffer consisting of 3 mM 4-methylumbelliferyl-β-D-glucopyranoside substrate (Sigma), 0.2 M acetate buffer at pH 4, 1X PBS, and EDTA-free protease inhibitors (Roche) were added to the wells. Plates were incubated at 37ºC for 70 min. The reaction was stopped by adding 20 μL of stop solution (1 M NaOH (Sigma) and 1 M Glycine (Sigma)) to each well. Fluorescence was read at 365 nm excitation and 440 nm emission λ length using an EnVision Plate Reader (PerkinElmer). The median signal from > 80 wells without cells was used as background. Background was subtracted from the values for all wells prior to normalization.
Measurement of cell viability
For each experiment, a separate set of 384-well plates (solid white bottom, Corning 3570) prepared in the same way as the enzyme activity assay plates, was assayed for cell viability using the CellTiter-Glo Luminescent Cell Viability kit (Promega). Twenty microliters of the luminescent reagent was added directly to the wells, incubated at room temperature for 20 min and measured in an EnVision Plate Reader according to the manufacturer's instructions.
RNA extraction, cDNA synthesis and relative expression analysis
Based on the primary screening data, candidate miRNAs were selected and subjected to follow-up experiments in 96-well plates. Two pmol of each miRNA or siRNA was added to the corresponding wells, followed by the addition of 50 μL of serum-free DMEM with 0.375 μL of Lipofectamine RNAiMax. After a 45 min incubation at room temperature, 3 × 10³ cells in 50 μL of DMEM supplemented with 20% FBS were added to each well. Transfected cells were incubated at 37ºC in 5% CO2 for 72 hours. Total RNA was harvested from cells using a MagMax-96 Total RNA Isolation kit (Life Technologies) according to manufacturer's instructions. cDNA (cDNA) was generated from 9 μL of total RNA using the High Capacity RNA-to-cDNA kit (Life Technologies) following the manufacturer's protocol.
A TaqMan probe-based assay (Life Technologies) was used to evaluate the relative expression levels of GBA1 (Hs00164683_m1), SCARB2 (Hs01072100_m1), PSAP (Hs01551096_m1), and GAPDH as a housekeeping gene (4352934E). Real-time PCR mixes were prepared based on the manufacturer's instructions and run in a 7900HT Fast Real-time PCR System (Life Technologies). Eight biologic replicates were performed in duplicate for each experiment. The results were normalized using GAPDH expression levels and the 2-ΔΔCt method.30 p-values and 95% confidence intervals were calculated using RT2 Profiler PCR Array Data Analysis v3.5 (Qiagen).
SDS-PAGE, Western blotting and conditioned media analysis
Cells were transfected with miRNAs or control siRNAs in 6-well plates for protein analysis. Sixty pmol of each miRNA/siRNA was added to the corresponding wells, followed by the addition of 1.5 mL of serum-free DMEM containing 9.4 μL of Lipofectamine RNAiMax. After 45 min of incubation at room temperature, 1 × 10⁵ cells in 1.5 mL of DMEM supplemented with 20% FBS were added to each well. Plates were incubated in 5% CO2 at 37ºC for 72 hours.
For protein analysis, the media was aspirated and cells were rinsed 3 times with 1X PBS. Cells were lysed and scrapped in 50 mM Citrate 175 mM KH2PO4 with 0.01% Tween-20 at pH 5.9. Cell lysates were sonicated for 1 × 10 sec at 50% amplitude and centrifuged at 4ºC for 10 min at 10000 rcf. Protein levels were measured using a BCA assay (BioRad). Ten micrograms of each protein sample was separated using NuPage Novex 4–12% Bis-Tris gel (Life Technologies) by SDS-PAGE at 125V. Samples were transferred on PVDF membrane (Life Technologies) using iBlot (Life Technologies), followed by blocking 1 hour at room temperature in 1X PBS containing 5% of fat-free milk and 0.5% Tween-20. This was followed by incubation in blocking solution with R386 GCase antibody (a custom-made antibody), LIMP II antibody (D4, sc-55571, Santa Cruz Biotechnology), and GAPDH antibody (ab9385, Abcam) overnight at 4ºC. The membranes were rinsed with blocking solution 3 times for 10 min each, followed by incubation with blocking solution containing 1:3000 horseradish peroxidase (HRP)-conjugated secondary antibody (KPL) for 1 hour at room temperature. HRP-probed immunoblots were developed using enhanced chemiluminescence (GE Healthcare). Experiments evaluating protein level were done in triplicates.
For assessment of GCase secretion into the extracellular media, WT and N370S/N370S Gaucher fibroblasts were transfected with specific miRNA (miR-127–5p) or with control siRNAs in 6-well plates as described above. The same cell density was used (1 × 10⁵ cells per well) for both cell lines, and the experiment was performed in duplicate. Seventy-two hours after transfection, the media was removed and each well was washed 3 times with 1X PBS and 2 times with serum-free DMEM. Two mL of serum-free DMEM (conditioned media) was added to each well and incubated at 37ºC in 5% CO2. Twenty-four hours later, conditioned media was collected and combined from 2 different wells containing the same miRNA/siRNA. Collected media was filtered using a 0.22 μM filter (Millipore) and transferred to a Pierce Concentrators 9K MWCO (Thermo Scientific). The media was concentrated by centrifugation at 2500 rcf at 4ºC until it reaches a 500 μL of volume. A total of 30 μL of the concentrated media was loaded on a NuPAGE 4–12% Bis-Tris 1.5 mm gel, transferred to a membrane and incubated with GCase antibody as described above.
SCARB2 luciferase assay
The full-length of the SCARB2 3′UTR covering 2 predicted target sites of miR-127–5p was cloned into the pMirTarget vector (Origene). For luciferase assays, HEK293 cells (2.4 × 10³ cells/well) were transfected with 0.8 pmol of miR-127–5p or NegCtrl siRNA using 0.05 μL of Lipofectamine RNAiMax in a 384-well plate. After 48 hours of transfection, the cells were further transfected with 25 ng of the firefly reporter construct (pMir-SCARB2–3′UTR) or pMirTarget empty vector (control plasmid) using 0.05 μL of TransIT-LT1 transfection reagent (MirusBio). Twenty-four hours later, the luciferase assay was evaluated using the ONE-Glo Luciferase assay reagent (Promega) and measured in an EnVision Plate Reader.
Statistical analysis
Analysis was performed using GraphPad Prism 5.0 and Microsoft Excel software.
Disclosure of Potential Conflicts of Interest
No potential conflicts of interest were disclosed.
Funding
This work was supported by the Intramural Research Programs of National Human Genome Research Institute, RNAi Screening Facility of National Center for Advancing Translational Sciences, and National Institutes of Health. M.S. received support from the Brazilian Federal Agency for Support and Evaluation of Graduate Education - CAPES and Fulbright Brazil.
Supplemental Material
Supplemental data for this article can be accessed on the publisher's website.
References
- 1. Beutler E, Grabowski GA. Gaucher disease. In: Scriver CBA, Beaudet AL, Sly WS, Valle D, eds. The metabolic & molecular bases of inherited disease. New York: McGraw-Hill, 2001:3635-68 [Google Scholar]
- 2. Beutler E, Nguyen NJ, Henneberger MW, Smolec JM, McPherson RA, West C, Gelbart T. Gaucher disease: gene frequencies in the Ashkenazi Jewish population. Am J Hum Genet 1993; 52:85-8; PMID:8434610 [PMC free article] [PubMed] [Google Scholar]
- 3. Sidransky E. Gaucher disease: insights from a rare Mendelian disorder. Discov Med 2012; 14:273-81; PMID:23114583 [PMC free article] [PubMed] [Google Scholar]
- 4. Horowitz M, Wilder S, Horowitz Z, Reiner O, Gelbart T, Beutler E. The human glucocerebrosidase gene and pseudogene: structure and evolution. Genomics 1989; 4:87-96; PMID:2914709; http://dx.doi.org/ 10.1016/0888-7543(89)90319-4 [DOI] [PubMed] [Google Scholar]
- 5. Hruska KS, LaMarca ME, Scott CR, Sidransky E. Gaucher disease: mutation and polymorphism spectrum in the glucocerebrosidase gene (GBA). Hum Mutat 2008; 29:567-83; PMID:18338393; http://dx.doi.org/ 10.1002/humu.20676 [DOI] [PubMed] [Google Scholar]
- 6. Biegstraaten M, van Schaik IN, Aerts JM, Langeveld M, Mannens MM, Bour LJ, Sidransky E, Tayebi N, Fitzgibbon E, Hollak CE. A monozygotic twin pair with highly discordant Gaucher phenotypes. Blood Cells Mol Dis 2011; 46:39-41; PMID:21056933; http://dx.doi.org/ 10.1016/j.bcmd.2010.10.007 [DOI] [PMC free article] [PubMed] [Google Scholar]
- 7. Lachmann RH, Grant IR, Halsall D, Cox TM. Twin pairs showing discordance of phenotype in adult Gaucher's disease. Qjm 2004; 97:199-204; PMID:15028849; http://dx.doi.org/ 10.1093/qjmed/hch036 [DOI] [PubMed] [Google Scholar]
- 8. Sidransky E. Gaucher disease: complexity in a "simple" disorder. Mol Genet Metab 2004; 83:6-15; PMID:15464415; http://dx.doi.org/ 10.1016/j.ymgme.2004.08.015 [DOI] [PubMed] [Google Scholar]
- 9. Tamargo RJ, Velayati A, Goldin E, Sidransky E. The role of saposin C in Gaucher disease. Mol Genet Metab 2012; 106:257-63; PMID:22652185; http://dx.doi.org/ 10.1016/j.ymgme.2012.04.024 [DOI] [PMC free article] [PubMed] [Google Scholar]
- 10. Reczek D, Schwake M, Schroder J, Hughes H, Blanz J, Jin X, Brondyk W, Van Patten S, Edmunds T, Saftig P. LIMP-2 is a receptor for lysosomal mannose-6-phosphate-independent targeting of beta-glucocerebrosidase. Cell 2007; 131:770-83; PMID:18022370; http://dx.doi.org/ 10.1016/j.cell.2007.10.018 [DOI] [PubMed] [Google Scholar]
- 11. Chang TC, Mendell JT. microRNAs in vertebrate physiology and human disease. Annu Rev Genomics Hum Genet 2007; 8:215-39; PMID:17506656; http://dx.doi.org/ 10.1146/annurev.genom.8.080706.092351 [DOI] [PubMed] [Google Scholar]
- 12. Li C, Feng Y, Coukos G, Zhang L. Therapeutic microRNA strategies in human cancer. Aaps J 2009; 11:747-57; PMID:19876744; http://dx.doi.org/ 10.1208/s12248-009-9145-9 [DOI] [PMC free article] [PubMed] [Google Scholar]
- 13. Mendell JT, Olson EN. MicroRNAs in stress signaling and human disease. Cell 2012; 148:1172-87; PMID:22424228; http://dx.doi.org/ 10.1016/j.cell.2012.02.005 [DOI] [PMC free article] [PubMed] [Google Scholar]
- 14. Rebane A, Akdis CA. MicroRNAs: essential players in the regulation of inflammation. J Allergy Clin Immunol 2013; 132:15-26; PMID:23726263; http://dx.doi.org/ 10.1016/j.jaci.2013.04.011 [DOI] [PubMed] [Google Scholar]
- 15. Frankel LB, Lund AH. MicroRNA regulation of autophagy. Carcinogenesis 2012; 33:2018-25; PMID:22902544; http://dx.doi.org/ 10.1093/carcin/bgs266 [DOI] [PubMed] [Google Scholar]
- 16. Dorval V, Nelson PT, Hebert SS. Circulating microRNAs in Alzheimer's disease: the search for novel biomarkers. Front Mol Neurosci 2013; 6:24; PMID:24009553 [DOI] [PMC free article] [PubMed] [Google Scholar]
- 17. Velayati A, DePaolo J, Gupta N, Choi JH, Moaven N, Westbroek W, Goker-Alpan O, Goldin E, Stubblefield BK, Kolodny E, et al. A mutation in SCARB2 is a modifier in Gaucher disease. Hum Mutat 2011; 32:1232-8; PMID:21796727; http://dx.doi.org/ 10.1002/humu.21566 [DOI] [PMC free article] [PubMed] [Google Scholar]
- 18. Ong DS, Wang YJ, Tan YL, Yates JR, 3rd, Mu TW, Kelly JW. FKBP10 depletion enhances glucocerebrosidase proteostasis in Gaucher disease fibroblasts. Chem Biol 2013; 20:403-15; PMID:23434032; http://dx.doi.org/ 10.1016/j.chembiol.2012.11.014 [DOI] [PMC free article] [PubMed] [Google Scholar]
- 19. Schueler UH, Kolter T, Kaneski CR, Zirzow GC, Sandhoff K, Brady RO. Correlation between enzyme activity and substrate storage in a cell culture model system for Gaucher disease. J Inherit Metab Dis 2004; 27:649-58; PMID:15669681; http://dx.doi.org/ 10.1023/B:BOLI.0000042959.44318.7c [DOI] [PubMed] [Google Scholar]
- 20. Jiao AL, Slack FJ. RNA-mediated gene activation. Epigenetics 2013; 9:27-36; PMID:24185374; http://dx.doi.org/ 10.4161/epi.26942 [DOI] [PMC free article] [PubMed] [Google Scholar]
- 21. Portnoy V, Huang V, Place RF, Li LC. Small RNA and transcriptional upregulation. Wiley Interdiscip Rev RNA 2011; 2:748-60; PMID:21823233; http://dx.doi.org/ 10.1002/wrna.90 [DOI] [PMC free article] [PubMed] [Google Scholar]
- 22. Ma F, Liu X, Li D, Wang P, Li N, Lu L, Cao X. MicroRNA-466l upregulates IL-10 expression in TLR-triggered macrophages by antagonizing RNA-binding protein tristetraprolin-mediated IL-10 mRNA degradation. J Immunol 2010; 184:6053-9; PMID:NOT_FOUND; http://dx.doi.org/ 10.4049/jimmunol.0902308 [DOI] [PubMed] [Google Scholar]
- 23. Zhou R, Li X, Hu G, Gong AY, Drescher KM, Chen XM. miR-16 targets transcriptional corepressor SMRT and modulates NF-kappaB-regulated transactivation of interleukin-8 gene. PLoS One 2012; 7:e30772; PMID:22292036; http://dx.doi.org/ 10.1371/journal.pone.0030772 [DOI] [PMC free article] [PubMed] [Google Scholar]
- 24. Betel D, Wilson M, Gabow A, Marks DS, Sander C. The microRNA.org resource: targets and expression. Nucleic Acids Res 2008; 36:D149-53; PMID:18158296; http://dx.doi.org/ 10.1093/nar/gkm995 [DOI] [PMC free article] [PubMed] [Google Scholar]
- 25. Bader AG. miR-34 - a microRNA replacement therapy is headed to the clinic. Front Genet 2012; 3:120; PMID:22783274; http://dx.doi.org/ 10.3389/fgene.2012.00120 [DOI] [PMC free article] [PubMed] [Google Scholar]
- 26. Ling H, Fabbri M, Calin GA. MicroRNAs and other non-coding RNAs as targets for anticancer drug development. Nat Rev Drug Discov 2013; 12:847-65; PMID:24172333; http://dx.doi.org/ 10.1038/nrd4140 [DOI] [PMC free article] [PubMed] [Google Scholar]
- 27. Calin GA, Cimmino A, Fabbri M, Ferracin M, Wojcik SE, Shimizu M, Taccioli C, Zanesi N, Garzon R, Aqeilan RI, et al. MiR-15a and miR-16-1 cluster functions in human leukemia. Proc Natl Acad Sci U S A 2008; 105:5166-71; PMID:18362358; http://dx.doi.org/ 10.1073/pnas.0800121105 [DOI] [PMC free article] [PubMed] [Google Scholar]
- 28. Cimmino A, Calin GA, Fabbri M, Iorio MV, Ferracin M, Shimizu M, Wojcik SE, Aqeilan RI, Zupo S, Dono M, et al. miR-15 and miR-16 induce apoptosis by targeting BCL2. Proc Natl Acad Sci U S A 2005; 102:13944-9; PMID:16166262; http://dx.doi.org/ 10.1073/pnas.0506654102 [DOI] [PMC free article] [PubMed] [Google Scholar]
- 29. Linsley PS, Schelter J, Burchard J, Kibukawa M, Martin MM, Bartz SR, Johnson JM, Cummins JM, Raymond CK, Dai H, et al. Transcripts targeted by the microRNA-16 family cooperatively regulate cell cycle progression. Mol Cell Biol 2007; 27:2240-52; PMID:17242205; http://dx.doi.org/ 10.1128/MCB.02005-06 [DOI] [PMC free article] [PubMed] [Google Scholar]
- 30. Livak KJ, Schmittgen TD. Analysis of relative gene expression data using real-time quantitative PCR and the 2(-Delta Delta C(T)) Method. Methods 2001; 25:402-8; PMID:11846609; http://dx.doi.org/ 10.1006/meth.2001.1262 [DOI] [PubMed] [Google Scholar]
Associated Data
This section collects any data citations, data availability statements, or supplementary materials included in this article.


