

Abstract
Management of germ free animals has changed little since the beginning of the 20th century. The current upswing in their use, however, has led to interest in improved methods of screening and housing. Traditionally, germ free colonies are screened for bacterial colonization by culture and examination of Gram stained fecal samples, but some investigators have reported using PCR-based methods of microbial detection, presumably because of perceived increased sensitivity. The accuracy and detection limit for traditional compared to PCR-based screening assays are not known. The purpose of this study was to determine the limit of detection of bacterial contamination of mouse feces by aerobic and anaerobic culture, Gram stain, and qPCR, and to compare the accuracy of these tests in the context of a working germ free mouse colony. We found that the limit of detection for qPCR (approximately 105 cfu/g of feces) was lower than for Gram stain (approximately 109 cfu/g), but that all 3 assays were of similar accuracy. Bacterial culture was the most sensitive, but the least specific, and qPCR was the least sensitive and most specific. Gram stain but not qPCR detected heat-killed bacteria, indicating that bacteria in autoclaved diet are unlikely to represent a potential confounding factor for PCR screening. We conclude that as a practical matter, bacterial culture and Gram stain are adequate for screening germ free mouse colonies for bacterial contaminants, but that should low numbers of unculturable bacteria be present, they would not be detected with any of the currently available means.
Keywords: animal models, germ-free, gnotobiotic, mice, PCR, test verification
Introduction
The first suggestion that animals could survive in the absence of their microbial partners was attributed to Louis Pasteur, writing in 1885.1 Experimental proof of principle, however, did not appear in print until the work of James Reyniers and colleagues, working at the Laboratories of Bacteriology at the University of Notre Dame (LOBUND). During the years from 1928 to well into the 1980s, these workers showed that mammals, birds, fish, and insects can, in fact be rendered germ free and can be maintained and bred in that condition.1-3 It was Reyniers and his colleagues who developed what has become the modern practice of gnotobiology, and who established the first breeding colonies of germ free rats and mice.
Reyniers was deeply interested in both the theory and practice of germ free life, and his work involved not only generation and study of germ free animals of many species, but also methods for ensuring that they remain, in fact, germ free. Almost three-quarters of a century ago, he wrote: “The so-called germ-free animal is germ free only within the limits of the techniques used to determine its freedom from microbic contamination.”4 At the time, germ free status was defined by the absence of culturable microorganisms, but it was already clear that since not all organisms could be detected by laboratory culture, the concept of “germ-free” when applied to animals, had to be considered a relative term. The germ free condition was only as good as the methods used for detecting it.
Today, surprisingly, little has changed.5-8 The methods for sterilizing isolators and equipment (ie, chemicals, steam, or irradiation) and the methods used for detecting contamination (direct microscopy and culture of samples on laboratory media), which were established by Reyniers et al, are remarkably similar to those used in today's germ free facilities. In fact, for more than 70 years, bacterial culture and examination of Gram-stained fecal samples have proven reliable and reproducible indicators of inadvertent contamination of germ free isolators, and they remain in use today.5,7,9 In today's world, however, detection of microbes has become more complex than simply inoculating an agar plate. Molecular methods have revealed that most environmental microorganisms grow poorly, if at all, in artificial media, and that many of those that do grow require specialized media and/or atmospheres. For this reason, many laboratories are adding PCR to their arsenal of methods of contamination detection. However, it is not known how molecular methods compare with traditional microbiology in terms of accuracy of detection or frequency of false positive tests. The purpose of the study described herein was to compare the accuracy and detection limits for culture, Gram stain, and qPCR of mouse feces or cecal content for detection of bacterial contamination.
Results
Limit of detection of bacteria in mouse feces
In order to determine limits of detection for our screening methods, we used germ free fecal samples spiked with known quantities of bacteria (see methods). Feces were spiked with 10-fold dilutions of broth-cultured bacteria as described above, samples were used to prepare Gram stained slides, and bacterial DNA was extracted for quantification of 16s rRNA gene sequences. Because the precise number of colony-forming units (cfu) could not be determined a priori, expected cfu/g were calculated based on the OD reading of the culture used to inoculate the samples. Results were grouped according to order of magnitude (ie the nearest multiple of 10), and reported according to approximate log10cfu/g feces. The limit of detection by culture was determined based on previous findings. In previous studies, quantification of labeled E. coli in colonization of gnotobiotic mouse feces revealed a limit of detection of 100–1000 cfu/g of feces or cecal content.10
To determine the limit of detection for qPCR, simple cycle threshold values were used. This was because calculations based on comparison or ratios between cycle thresholds of samples and cycle thresholds of germ free controls or no-template controls did not alter the overall outcome. Figure 1 shows that in all cases, CT values for germ free samples were 27 or more for the 178 base-pair amplicon, and 34 or more for the 1504 base-pair amplicon (see methods), while CT values for all samples that contained 105 cfu/ g or more were 26 or less or 33 or less respectively. Samples containing 103 to 104 cfu/g were inconsistent. In some cases, the CT fell in the positive zone, while in other cases, CT was indistinguishable from that of germ free feces. Thus we could not definitively detect bacteria at less than 105 cfu/g. For this reason, in subsequent experiments, 26 was used as a threshold for defining contaminated samples ("test positive") using the 178 base-pair amplicon, and 33 was used as a threshold for the 1504 base-pair amplicon.
Figure 1.
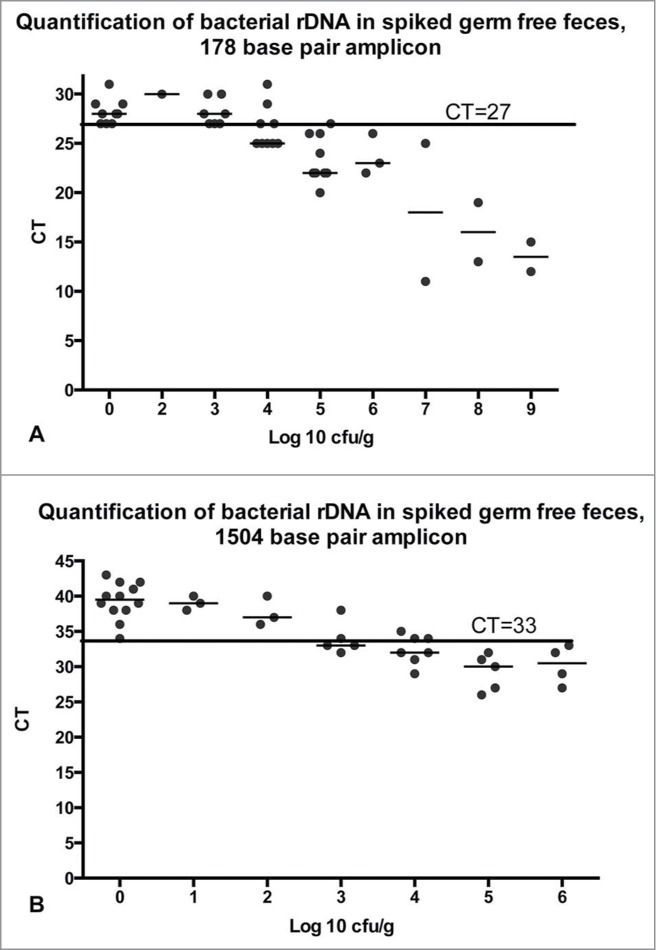
Fecal samples from germ free mice were spiked with broth-cultured bacteria in 10-fold dilutions from 0 to 109 cfu/g of feces. Bacterial density was quantified by calculation based on OD600 of the broth culture, or by plate dilution of the spiked samples, and rounded to the nearest order of magnitude (log10). qPCR was run as described in the methods with either the 178 base-pair amplicon (A) or the 1504 base-pair amplicon (B). Horizontal line indicates the cycle threshold below which samples are defined as positive. CT=cycle threshold.
When analyzed by gel separation rather than quantification, PCR results were similar. Bands were detectable in all samples whether or not bacteria had been added, but the intensity of the band increased with increasing concentration of bacteria (Fig. 2). Bands from samples containing 105 cfu/g or more were subjectively more intense than bands from germ free samples, but samples with <105 cfu/g could not be distinguished from uninfected samples (Fig. 2).
Figure 2.
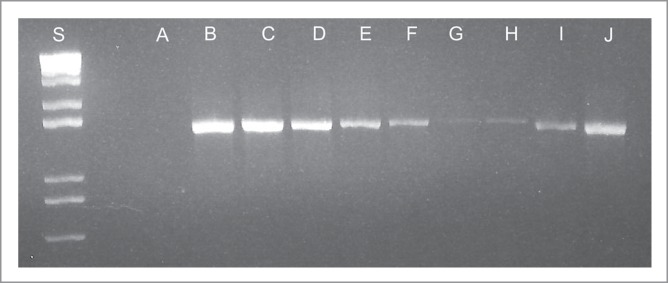
PCR amplification of a 1504 base pair conserved bacterial 16S rDNA sequence. PCR reactions were run for 35 cycles, as described in the methods. Lane A: No template control, Lanes B-G: Germ free feces spiked with 10-fold dilutions of E. coli from 109 cfu/g of feces (B) to 104 cfu/g. Lane H: Germ free feces. Lane I: feces from a mouse monocolonized with segmented filamentous bacteria (SFB). Lane J: feces from a previously germ free mouse inadvertently colonized with Turcibacter sp.
To determine a limit of detection for Gram stains, a scoring system was developed (see methods). When present in large numbers, Gram-stained bacteria in feces can be distinguished from debris and staining artifact by homogeneous size, shape, consistency of staining quality, and contour (Fig. 3). In contrast, non-living bacteria-like particles are irregular in shape and of many different sizes. In small numbers however, non-living bacteria-like particles and dead bacteria are not always distinguishable from live bacteria by morphology alone (Fig. 3). For this reason, anything that resembled a bacterium was counted as a bacterium for scoring purposes. This was done to maximize the detection of samples with small numbers of bacteria. Results of Gram stain scoring are shown in Figure 4. All samples that had fewer than 106 cfu/g of feces contained fewer than 35 bacteria-like particles per 25 fields, and all known infected samples and spiked samples with 109cfu/g or more contained more than 50 bacteria per 25 fields. In general, samples with heavier colonization had more bacteria per 25 high power fields, and most heavily colonized samples had more than 50 bacteria per field, considered too numerous to count (TNTC). Figure 4 demonstrates that like qPCR, Gram stains clearly distinguished heavily colonized samples (≥109 cfu/g) from germ free samples, but samples with intermediate colonization (107 to 108 cfu/g) had variable results. Overall, Gram stains were less sensitive than either culture or PCR, as they only consistently identified samples with 109 cfu/g or more. For test verification, "test positive" samples were defined as those with at least 50 bacteria or bacteria-like particles per 25 contiguous 1000x fields.
Figure 3.
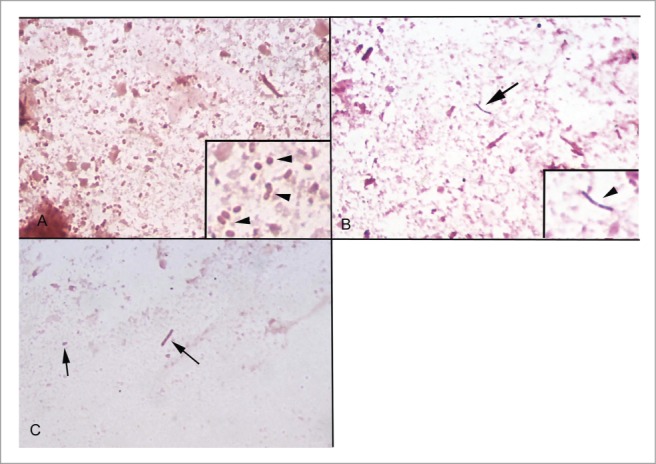
Gram stained slides of mouse feces. (A) Fecal sample from a gnotobiotic mouse infected with 1010 cfu/g of E. coli. Many equally-sized Gram negative coccobacilli are present (inset, arrows). (B) Fecal sample from a germ free mouse. No bacteria are present and most debris does not take up the Gram stain, but occasional Gram-positive bacteria-like particles are present (arrow). Inset shows higher magnification. (C) Fecal sample from a germ free mouse. Particles that resemble Gram-negative bacteria but that vary in size and shape are sometimes present (arrows).
Figure 4.
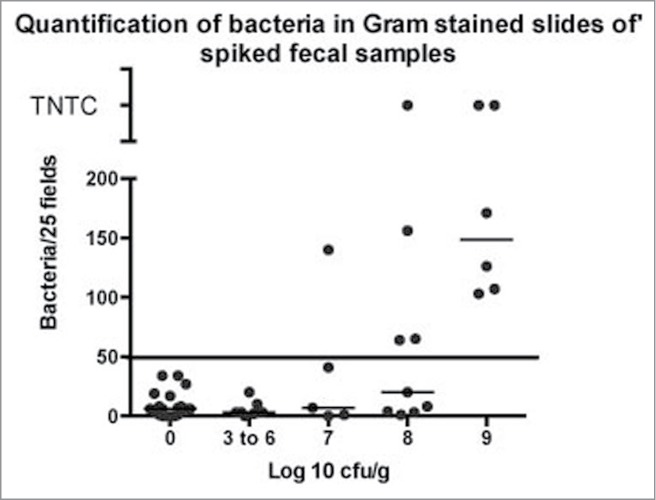
Fecal samples were spiked with broth-cultured E. coli as described above and samples were Gram-stained and bacteria counted as described.
In summary, the spiked samples revealed that the detection limit was best for culture (103 cfu/g) and worst for Gram stain (109 cfu/g). Based on the results from spiked samples, thresholds for defining "test positive" results were set as follows:
Culture: More than 3 colonies of the same morphology per plate
Gram stain: at least 50 bacteria or bacteria-like particles per 25 contiguous fields
qPCR: CT = 26 or less for the 178 base-pair amplicon or 33 or less for the 1504 base pair amplicon.
These values were used to determine sensitivity, specificity, and predictive value for each assay (see methods).
Test verification: Sensitivity, specificity, and predictive value
Results included in these calculations were from feces or cecal contents from contaminated isolators (N = 8), feces from gnotobiotic experimental mice (N = 23), and feces or cecal content from germ free sentinel mice (N = 26). Each sample was tested once, but in several cases there was more than one sample from the same isolator or cage. In that case, each repeat was considered as separate sample for the purposes of test verification. Calculation of sensitivity, specificity, and predictive value requires a "gold standard" to define true positive and true negative samples. True positive and true negative samples were defined as described in the methods.
Sensitivity, specificity, accuracy, and positive and negative predictive value for each assay were calculated by conventional means (see methods). Calculations were based on results from 26 cultures (17 positive and 9 negative), 77 qPCR samples (36 positive and 41 negative), and 52 Gram stains (20 positive and 32 negative) (Table 1).
Table 1.
Sample numbers and test results
| qPCR | Sample positive | Sample negative | Total |
|---|---|---|---|
| Test positive | 32 | 1 | 33 |
| Test negative | 4 | 40 | 44 |
| Total | 36 | 41 | 77 |
| Culture | |||
| Test positive | 17 | 2 | 19 |
| Test negative | 0 | 7 | 7 |
| Total | 17 | 9 | 26 |
| Gram stain | |||
| Test positive | 19 | 2 | 21 |
| Test negative | 1 | 30 | 31 |
| Total | 20 | 32 | 52 |
Accuracy of the 3 assays is shown in Table 2. All the tests were more than 90% accurate, but there were some differences. Culture was the most sensitive and detected contaminants 100% of the time. It was relatively non-specific, however. Two of our 9 negative samples were culture positive, probably because of contamination of the sample in transit to the laboratory. These overall results demonstrated that culture is excellent for identifying uncontaminated samples, but that positive cultures should be approached with caution.
Table 2.
Accuracy of diagnostic tests
| Culture | qPCR | Gram stain | |
|---|---|---|---|
| Sensitivity | 100% | 89% | 95% |
| Specificity | 78% | 98% | 94% |
| Positive predictive value | 89% | 97% | 90% |
| Negative predictive value | 100% | 91% | 97% |
| Accuracy | 92% | 94% | 94% |
In contrast to culture, qPCR was highly specific (98%), but was less sensitive. There were few false positives, but an unexpectedly high number of false negatives. This was at first surprising, since PCR is considered a highly sensitive test that is able to detect very small amounts of template DNA. However, simple calculations demonstrate that the lack of sensitivity may be attributable to the small aliquot of material screened by this method. The samples that we used for determination of detection limit were 200–500 mg of feces that contained between 0 and 109 cfu of E. coli/g. Thus, samples in the 103 to 104 range contained approximately 200–5000 bacteria in 200 ul, between 1- 25 bacterial equivalents/microliter. The PCR reaction used 1 ul of this as a template for amplification. Given the likely loss of sample during processing, uneven distribution of bacteria within the sample, and other unknown effects, it is not surprising that the presence or absence of detectable template in these samples was variable.
Gram stain was intermediate in accuracy between culture and qPCR. Both sensitivity (95%) and specificity (94%) were high, and positive and negative predictive value were both greater than 90%. Ninety-four percent of Gram stains were correct, a similar accuracy to qPCR and slightly better than culture. This high level of accuracy was somewhat unexpected, giving the high limit of detection, and was attributed to the fact that all the contaminated samples were heavily colonized.
Heat-killed bacteria
A common concern regarding bacterial detection in germ free feces is the possibility that dead bacteria (from lab chow or bedding ingested by the mice) could lead to false positive results. Indeed, bacteria-like particles are commonly encountered in Gram stains of germ free mouse feces (see Fig. 3),11,12 and they are presumed to be derived from either food or bedding.12 it is possible that at least some of these could represent dead bacteria. Whether or not detectable bacterial DNA is present in food or bedding is not known (see discussion, below). Since we autoclave food and bedding prior to entry into the isolators, we determined if bacteria in autoclaved food or feces (ie, heat-killed bacteria) could result in false-positive PCR results.
In order to determine if ingested heat-killed bacteria are recognizable in Gram stained feces or by qPCR, we fed mice an artificial diet that contained heat killed Gram-positive and Gram-negative bacteria at about 109 bacteria per gram of food. Mice were fed this diet for at least 2 weeks, and fecal samples were collected and examined by Gram stain. In addition, bacterial DNA was isolated from feces as well as from the food itself, and examined by qPCR, as described above. Figure 5a shows that heat-killed bacteria were recognizable by size and shape in the Gram stained slides of mouse feces, but in contrast to live bacteria in feces (Fig. 5b), none of the bacteria detected retained the Gram's crystal violet. This suggests that while the cell walls were present to the extent that they could be visualized, they were damaged to the extent that they did not retain the crystal violet stain. As seen in Table 3, of the 6 Gram stained samples of feces from mice fed heat-killed bacteria, all 6 had more than 50 bacteria counted per 25 fields, and 3 had too many to count (TNTC), comparable in number to slides from contaminated or gnotobiotic mice.
Figure 5.
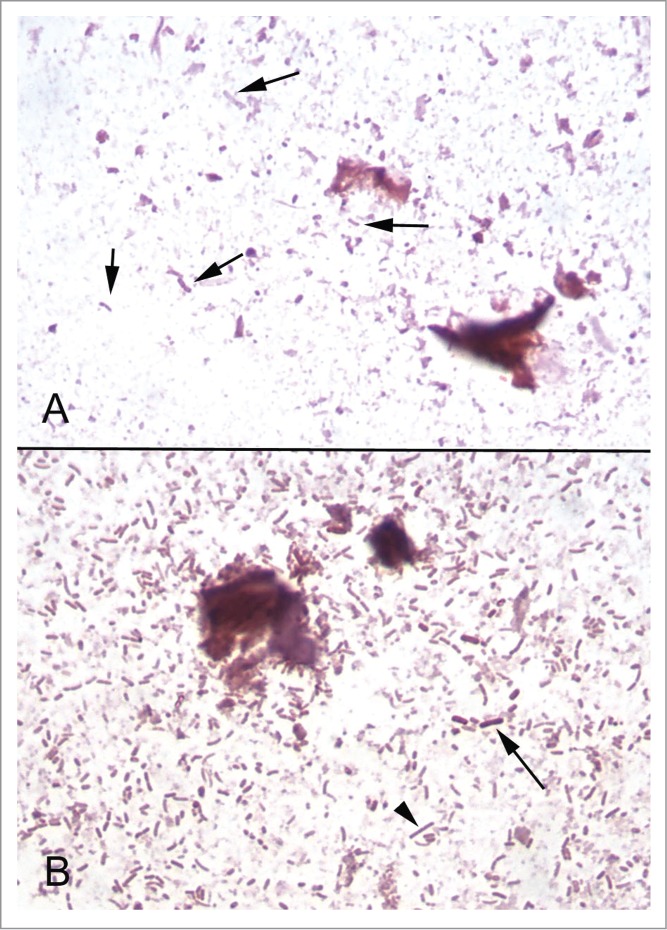
Gram stained slides of fecal samples. (A) Fecal sample from a mouse fed chow containing approximately 109 of heat-killed bacteria per gram. Bacteria of different shapes are identifiable (arrows), but have lost their Gram staining properties. (B) Fecal sample from a mouse colonized with an 11-member bacterial community (see text). Many Gram-positive (arrow) and Gram-negative (arrowhead) bacteria are present.
Table 3.
Gram stain scores of feces from colonized mice compared with mice fed dead bacteria
| Sample type | No. of slides | No with >50 bacteria/25 hpfa | No with <50 bacteria/25hpf | No with TNTCb |
|---|---|---|---|---|
| Contaminated isolator | 7 | 7 | 0 | 3 |
| Gnotobiotic mice | 6 | 5 | 1 | 4 |
| Heat-killed bacteria | 6 | 6 | 0 | 3 |
| Germ free mice | 20 | 0 | 20 | 0 |
hpf = high -power field (1000x, oil immersion).
TNTC = too numerous to count.
Unlike the Gram stain, qPCR failed to detect heat-killed bacteria. Of the 3 fecal samples and one food sample that was examined, CT was 28 (178 base-pair amplicon or 36–37 (1504 base-pair amplicon). This indicates that the bacterial DNA was sufficiently degraded that specific amplification was not possible. Figure 6 shows the CT values for fecal samples or cecal content from all groups of mice: germ free, gnotobiotic (mono- or poly-colonized with known bacteria), contaminated, and fed heat-killed bacteria.
Figure 6.
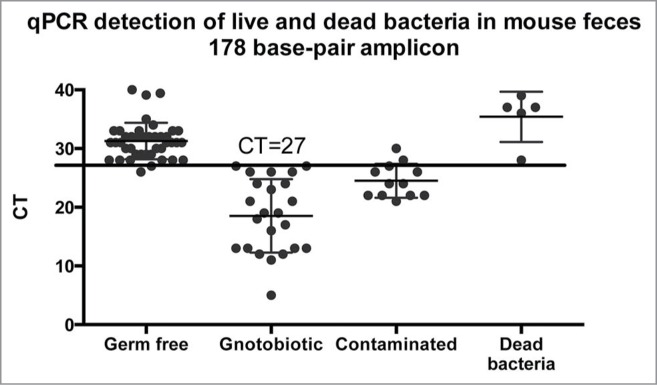
qPCR amplification of conserved bacterial rDNA sequences from germ free mice, mono- or poly-colonized germ free mice, mice from contaminated isolators, and germ free mice fed heat-killed bacteria. qPCR reactions to detect a 178 base-pair amplicon specific for 16S rDNA was performed as described in the methods. The horizontal line indicates the threshold of detection of bacteria in feces (see text). CT = cycle threshold.
Discussion
Traditional microbiological methods such as aerobic and anaerobic culture and Gram stain are commonly used as screening tools to detect contamination of germ free animals. These methods are relatively inexpensive and simple to perform, but may have limitations that could lead to errors or inability to detect contaminants. Bacterial culture is a sensitive measure, but may miss unculturable or poorly growing species, and detection of strict anaerobes requires specialized equipment and careful handling. Conversely, cultures are easy to contaminate, and false positives may lead to unnecessary loss of time or animals. Examination of Gram stained smears of fecal material or of intestinal content of animals will detect even unculturable species, but only if they grow to sufficiently high numbers in the intestine. Also, while Gram-positive organisms are relatively easy to detect, Gram-negative organisms, particularly smaller coccobacilli, may be difficult to see, and screening requires an experienced microscopist. Because of these potential technical limitations, modern users of germ free animals have begun to use PCR-based methods of detection, presumably to increase the sensitivity of screening and maximize detection of poorly growing or difficult to detect bacterial contaminants.5,9,13 Concerns remain, however, as to whether or not currently used methods detect all contaminants and, conversely, if irrelevant material (such as dead bacteria) can result in false positive screens.5,9
The purpose of the current study was to determine the relative accuracy of the assays, as well as provide information as to the limit of detection. The results showed, that while the limits of detection of the 3 assays varied, all were reasonably accurate. Bacterial culture was the most sensitive, detecting 100% of the contaminated samples. In view of the rarity of culturable bacterial species in the world, this may seem surprising. However, it may be explained by the fact that the bacterial species that are most likely to contaminate germ free isolators are also the most likely to grow in culture. The most likely sources of contamination of isolators are 1) organisms that are in use in the laboratory (laboratory contaminants), 2) skin or fecal contaminants from workers or non-germ free animals (inadvertent biological contaminants), or 3) inadequate sterilization of food, bedding, or supplies entered into the isolators. Laboratory contaminants would, of course, grow on artificial media, since that is how they got into the laboratory in the first place. Contamination from biological material would be likely to involve multiple species, many of which (staphylococci from skin, enterics from feces, etc) grow quite well on artificial media. Thus, at least one of the contaminants would be likely to grow, particularly if that organism is able to grow well in the intestine of germ free mice. Similarly, failure of sterilization likely would permit contamination by multiple species, at least one of which could be detected by culture. Thus, as we confirmed, culture would be expected to be a highly sensitive method of detecting contamination and has a high negative predictive value. Negative results are very likely to be truly negative.
Culture remains a relatively non-specific assay, however. Of our small sample, 2 positive cultures were subsequently shown to be false positives. Because materials are easily contaminated during transport to the laboratory, false positives occur, and positive predictive value is relatively low. Thus, positive cultures should be viewed with care and must be verified by other means.
Examination of Gram stained smears was also an extremely sensitive assay in our hands, detecting 95% of contaminated samples. This high sensitivity appears at odds with the relatively high limit of detection, 109 organisms/gram of feces. The high sensitivity of the assay, however, was attributed to the fact that all of the contaminated samples were heavily colonized. This is expected because bacteria grow very quickly to high numbers in the absence of competing bacteria species (ie in the intestine of germ free animals). Thus, any organism that is able to grow in or on animals, will grow to high numbers in germ free animals, and thus will be easily detectable by microscopic examination. Indeed, most of the inadvertently contaminated samples had more bacteria per microscopic field than could be enumerated. In addition to its sensitivity, Gram stain was also quite specific. Of all the negative samples examined, 94% were correctly identified as negative, based on the presence of fewer than 50 bacteria-like particles per microscopic field. Thus, both positive and negative predictive values were high.
Perhaps the most surprising result was the qPCR. This was the least sensitive assay. Of all the positive samples tested, only 89% were detected based on a CT threshold that identified spiked samples containing 105 cfu/g or more. Both the low sensitivity and the high limit of detection were surprising to us, given the ability of PCR to detect very small amounts of DNA. As noted above, however, the limitation of PCR based methods is probably because of the necessity for sampling a very small fraction of the available material. While culture and Gram stain screen at least microgram quantities of material, PCR samples are likely in the picogram range. Thus, simple chance may determine whether or not an amplifiable 16S rDNA gene is present. Increased cycle number, different amplicon sequences, and alterations in annealing temperature (not shown) did not improve the limit of detection by PCR. As seen in Figure 2, 35 cycles of amplification did reveal a faint band from feces containing fewer than 105 cfu, but this band was also present in feces from germ free mice, and was not detectable by qPCR. For these reasons, it is interpreted as non-specific background.
It is possible that continuing improvements in DNA isolation methods could improve the limit of detection, at least with qPCR. For example, some laboratories use "bead-beating" to physically disrupt bacteria, a method that could increase the amount of bacterial DNA released from organisms in feces9 We were unable to compare this method to our method directly, but in one report that used bead-beating, the quantification of bacteria appeared similar to ours. . Packey et al9 did not quantify colonization, but did quantify the number of copies of rRNA genes in their fecal samples. They found a range of 107 to 108 copies per microgram of fecal DNA, suggesting heavy colonization similar to that found in our samples. It is likely that with the current growing interest in the microbiome, improvements in DNA extraction technology will continue. Further work will be needed to determine if bead-beating or other altered methodology could increase the sensitivity of PCR or qPCR without compromising specificity.
Also surprising to us was the failure of PCR to detect genetic sequences from heat-killed bacteria. This was not due to a limitation in sample size. The concentration of bacteria in the diet fed to the experimental mice was much greater than would be found naturally in plant products processed into lab chow. In fact, the number of organisms in the diet was so high, that the Gram stains of feces from those mice were indistinguishable from feces from mice that were colonized with live bacteria of the same species. In spite of this large number, no intact 16S rDNA sequences were detected in either the food or feces of the mice fed heat-killed bacteria. This result indicates that heat-killed bacteria are unlikely to be a confounding factor in qPCR screening of feces from germ free mice. This is concordant with a previously published study in which bacterial 16S sequences were not detected in autoclaved lab diet.9 It is possible, of course, that irradiated food might retain bacteria that are non-viable but sufficiently intact to contain amplifiable DNA, but the results of the current study indicate that autoclaving is sufficient to prevent false positive PCR results.
In contrast to PCR, Gram stained fecal smears from mice fed heat-killed bacteria clearly demonstrated large numbers of organisms, leading to the concern that they represent a potential false-positive result in Gram stained slides. In fact, several older publications did report spurious Gram stain results because of high numbers of dead bacteria in fecal samples of germ free mice.11,12 At the time, these results were attributed to the presence of killed bacteria in the diet fed to the animals. In our study, few to no bacteria were detected in Gram stains of germ free mouse feces, suggesting that if there are bacteria in the diet they are below the limit of detection by the time they reach the feces. It is possible that the bacteria-like particles commonly found in Gram stains of germ free mouse feces, as indicated in Figure 3 are, in fact, dead bacteria that have been ingested and passed through the intestinal tract intact. However, they were few enough in number that they did not interfere with the specificity of the assay.
To our knowledge, this is the first published report comparing the accuracy of culture, Gram stain, and PCR in detection of bacterial contamination of isolators. A few recent studies have reported the use of PCR as a screening tool,5,9,13 but most have simply mentioned or described the technique without any evaluation of its accuracy.5,13 One recent study did evaluate PCR and qPCR for detecting bacteria in the feces of gnotobiotic and contaminated germ free mice, but did not quantify limits of detection or calculate accuracy.9 Nevertheless, while previously published studies differ from ours, some comparisons can be made. For example, Packey et al9 did not quantify the limit of detection of their PCR methods, but their reported results suggest that those limits were similar to what we found (see above). In contrast to our study, Packey et al9 failed to detect background bands on gels from germ free isolators. However, they only used 25 cycles rather than the 40 cycles used in this study. This is consistent with our qPCR results showing that 26 cycles is a threshold for determining specific and non-specific amplification. Thus, the 2 studies agree that when contamination occurs it is heavy, and that PCR-based methods are adequate to detect contamination at least most of the time. Given the differences in primer sequences, PCR protocol, DNA isolation protocol, and likely other laboratory-specific methods between our study and theirs, the results appear highly concordant.
Packey et al. 9 did not compare PCR directly to Gram stain or culture, and did not describe their methods of culture or Gram stain in detail. However, they do report a single isolator contaminant that was detected by PCR but not be culture or Gram stain. The contaminant was identified by PCR as Bacillus simplex, a Gram positive aerobic spore-former that, based on their PCR results, was present in high numbers. The authors did not speculate as to why they were not able to either culture this organism or visualize it on Gram stain.
In summary, the results of the current study showed that while culture, Gram stain, and PCR are all fairly accurate in detecting bacterial contamination of isolators, none of the screening assays, including qPCR were able to detect fewer than 105 cfu/g of feces. This, then, leaves open the 70- year-old question of whether or not germ free animals can be contaminated by poorly colonizing bacterial species that are present below the limit of detection of our assays. The theoretical possibility of undetected colonization by low numbers of unculturable bacteria remains. In our hands, however, examination of Gram stained slides and bacterial culture were sufficient to allow detection of all contaminated samples. Gram stain and culture have limits, (the need for an experienced microscopist, and false positive results, for example), but the tests are inexpensive and easy to perform. In our hands, PCR did not offer any advantage, and it does add to the cost screening in both materials as well as technical time.
As a final note, it must be observed that we did not address screening for fungi or other eukaryotic contaminants, procedures that require separate screening methods not applicable to this study. In fact, at times non-quantitative methods such as "mold traps" (wet food samples left in isolators to allow detection of airborne fungi or bacterial spores), and detection of abnormal odors emanating from isolators can be the first indication of microbial contamination of any type. In the final analysis, of course, each laboratory will develop its own screening method and validate it for its own use. However, the observation made by Reyniers in 1943 still holds true, and must always be kept in mind: "The so-called germ-free animal is germ free only within the limits of the techniques used to determine its freedom from microbic contamination."
Methods
Experimental design
For detection of bacteria in feces, 3 screening assays were evaluated: culture (aerobic and anaerobic), Gram stain of smears from feces or cecal contents, and qPRC. To determine the limits of detection of the 3 assays, sterile feces from germ free mice were inoculated with known quantities of broth cultured E. coli HS ("spiked samples"). For this, germ free fecal samples were collected aseptically, removed from the bubble isolators, pooled, and divided into aliquots of 200–500 mg. Mid-log phase broth cultured E. coli were enumerated by spectrometry (OD600), and fold10- dilutions were added to the fecal aliquots and homogenized.
To determine the sensitivity, specificity, predictive value, and accuracy of the 3 assays, fecal samples from 1) uninfected germ free mice, 2) inadvertently contaminated formerly germ free mice, and 3) experimentally monocolonized or polycolonized (gnotobiotic) experimental mice were used. Experimentally colonized gnotobiotic mice had been orally inoculated with one or more of the following: Escherichia coli, Citrobacter rodentium, Bacteroides thetaiotaomicron, Prevotella distasonis, or an artificial enteric microbial community consisting of a mixture of 11 species: B. thetaiotaomicron, Bacteroides. uniformis, P. distasonis, Bacteroides vulgatus, E. coli, Bacteroides intestinalis, Lactobacillus reuteri, Bifidobacterium longum, Roseburia inulinovorans, Eubacterium rectale, and Faecalibacterium prausnitzii. Attempts were made to perform all 3 assays on all samples. This was not always possible, however, because of experimentation protocols and/or available resources. All animal studies were approved by the University of Michigan Committee on Use and Care of Animals.
Sample collection
Germ free and gnotobiotic mice were housed in either Trexler-type soft-sided "bubble" isolators (CBClean), individual Isocages™ (Tecniplast), or sterile microisolator cages in Class IIB biosafety cabinets. Feces were aseptically collected from germ free or gnotobiotic mice directly from the anus into sterile ependorff tubes. For culture, sterile swabs were used to transfer fecal material to blood agar plates, which were incubated at 37C either in air or in anaerobic jars overnight to detect aerobic or aerotolerant bacteria. For microscopic examination, swabs were then transferred to glass slides and fecal material was spread evenly in a thin layer over the surface of the slide. Slides were air-dried and heat-fixed, and Gram stained by routine methods. The remainder of the sample was stored at -80C until DNA extraction.
In some cases, cecal content from sentinel mice was used. Mice were aseptically removed from the isolator or cage, euthanized, and placed into an anaerobic Coy chamber (0% oxygen). The abdomen was opened aseptically, and cecal and/or colon contents were inoculated onto pre-deoxygenated blood agar plates. Gram stains and DNA extraction were performed as above.
PCR
Bacterial DNA was isolated from fecal samples with a QIAmp DNA Stool Mini Kit. For gel documentation, universal primers used to amplify bacterial 16S rRNA genes were forward: AGAGTTTGATCATGGCTCAG, reverse: GGGTTACCTTGTTACGACTT, and amplified a 1504 base pair amplicon between nucleotides 7 and 1511 of the 16S rrnah gene. PCR reactions were held for 4 minutes at 95C followed by 35 cycles of: 95C for 15 seconds, followed by 61C for 30 seconds, followed by 72C for 2 minutes. Fifteen microliters of each reaction was separated on a 1.5% Agarose in 1X TBE at 100 V for 60 minutes using a Bio-Rad Model 1000/500 Power Supply. The gel was photographed with a Bio-Rad Gel Doc XR+, Model #: Universal hood II.
For qPCR one of 2 primer sets was used: the the first, described above, produced a 1504 base-pair amplicon and the second (forward: CGATGCAACGCGAAGAACCT, reverse: CCGGACCGCTGGCAACAAA), produced a 178 base pair amplicon between nucleotides 961 and 1139. qPCR reactions were run on an Applied Bioscience AB 7500 Fast Real-Time PCR System in 25ul total volume. Cycle times for the short amplicon were: 95C for 10 minutes followed by 40 cycles of 95C for 10 seconds then 55C for 30 Seconds. Cycle times for the long amplicon were: 95C for 4 minutes followed by 40 cycles of 95C for 15 seconds then 58–63C for 30 seconds then 72C for 2 minutes. Melt curves for both fragments were continuous from 58C to 95C. All runs included a no-template control to verify absence of DNA contamination, a negative control from germ free mouse feces, and a positive control from infected mouse feces.
Heat-killed bacteria
The same 11 bacterial species used for the artificial community (above) were cultured separately in 4L volumes, centrifuged, re-suspended in water, autoclaved for 20 min, frozen, lyophilized, weighed, pooled, mixed with 1,000 ml water, and autoclaved again for 20min. Lab Diet® Autoclavable Rodent Breeder Diet 5013 was ground to a powder in a food processor, and 200 ml of the autoclaved bacterial sample was added per 1000 g of powdered diet. The mixture was homogenized, molded into golfball sized pieces by hand, frozen and freeze dried, and autoclaved one more time before being fed to the mice as their sole available food source. The calculated concentration of heat-killed bacteria was equivalent to approximately 109 cfu/g of food.
Gram stain scoring
Gram stained slides were de-identified and randomized before being scored by an experienced microscopist (KAE). For scoring, 25 contiguous 1000x (oil immersion) microscopic fields were examined and all bacteria or bacteria-like particles were enumerated. To err on the side of caution, anything that looked like a bacterium was counted as a bacterium. Results are expressed as the total number of bacteria and bacteria-like particles per 25 fields.
Calculation of sensitivity, specificity, predictive value, and accuracy
Thresholds for defining positive and negative results of the assays ("test positive" and "test negative") were determined based on quantification of spiked samples (see results). True positives and true negatives were identified as follows. Samples were considered positive if all 3 assays were positive in at least 2 repeated trials, or if one or 2 assays were positive and the remaining assays became positive with repeated samples (ie fresh samples from the same mouse or cage). Samples were considered negative if all 3 assays were negative or if one or 2 assays were positive but at least 2 repeated samples were negative in all 3 assays and remained negative thereafter. For test verification, results from germ free mice, gnotobiotic mice, and inadvertently contaminated mice were used. Standard formulae for verification of diagnostic test accuracy were as follows:
Funding
This study was supported in part by the University of Michigan Microbiome Initiative, and by P30CA046592 from the NCI and P30 DK 34933 from the NIH.
Disclosure of Potential Conflicts of Interest
No potential conflicts of interest were disclosed.
Acknowledgments
The authors thank Eric Martens, Gabriel Nunez, Grace Chen, and members of their laboratories for access to fecal samples from experimental gnotobiotic mice.
References
- 1. Reyneirs J, Trexler PC, Ervin RF. Rearing germ-free albino rats. In: Reyniers JA, Ervin RF, Gordon HA, eds. Lobund reports, volume 1 Volume 1. Notre Dame, : University of Notre Dame Press, 1946:1-87. [PubMed] [Google Scholar]
- 2. Reyniers J, Reyniers JA, Ervin RF, Gordon HA. Lobund reports: Germfree life studies volume 2. Volume 2: University of Notre Dame Press, 1949:1-149 [Google Scholar]
- 3. Reyniers JA, Reyniers JA, Gordon HA, Ervin RF, Ervin RF, Gordon HA, Wagner M, Wagner M. Germ free life studies no. Three. Notre Dame, : University of Notre Dame Press, 1960:1-203. [Google Scholar]
- 4. Reyniers JA, Reyniers JA, Trexler PC, Kopac MJ, Hildebrand EM, Woolpert OC, Hudson NP, Glaser RW, White PR, Rosenstern I, Kammerling F, Wells WF. Micrugical and germ-free methods. Springfield, Ill: Charles C. Thomas, 1943; 125. [Google Scholar]
- 5. Arvidsson C, Hallén A, Bäckhed F. Generating and analyzing germ-free mice. Curr Protocols Mouse Biol 2012; 2:307-316. [DOI] [PubMed] [Google Scholar]
- 6. Gordon HA. The germ-free animal. Amer J Dig Dis 1960; 5:841-867; PMID:13707167; http://dx.doi.org/ 10.1007/BF02232187 [DOI] [PubMed] [Google Scholar]
- 7. Hecht G, Bar-Nathan C, Milite G, Alon I, Moshe Y, Greenfeld L, Dotsenko N, Suez J, Levy M, Thaiss CA, Dafni H, Elinav E, Harmelin A. A simple cage-autonomous method for the maintenance of the barrier status of germ-free mice during experimentation. Lab Animals 2014; 48:292-297; http://dx.doi.org/ 10.1177/0023677214544728 [DOI] [PubMed] [Google Scholar]
- 8. Trexler PC. The design, development and study of germfree isolators for use with patients and in research. Final Report Lobund 1962, 1962:1-37. [Google Scholar]
- 9. Packey CD, Shanahan MT, Manick S, Bower MA, Ellermann M, Tonkonogy SL, Carroll IM, Sartor RB. Molecular detection of bacterial contamination in gnotobiotic rodent units. Gut Microbes 2013; 4:361-370; PMID:23887190; http://dx.doi.org/ 10.4161/gmic.25824 [DOI] [PMC free article] [PubMed] [Google Scholar]
- 10. Tyler JS, Beeri K, Reynolds JL, Alteri CJ, Skinner KG, Friedman JH, Eaton KA, Friedman DI. Prophage induction is enhanced and required for renal disease and lethality in an ehec mouse model. PLoS Pathog 2013; 9:e1003236; PMID:23555250; http://dx.doi.org/ 10.1371/journal.ppat.1003236 [DOI] [PMC free article] [PubMed] [Google Scholar]
- 11. Midtvedt T, Gustafsson BE. Digestion of dead bacteria by germ-free rats. Curr Microbiol 1981; 6:13-15; http://dx.doi.org/ 10.1007/BF01566719 [DOI] [Google Scholar]
- 12. Taylor DM, Read L, Neal DL. Determining the viability of faecal bacteria present in germ-free mice. Lab Animals 1986; 20:22-26; http://dx.doi.org/ 10.1258/002367786781062106 [DOI] [PubMed] [Google Scholar]
- 13. Faith JJ, Rey FE, Donnell D, Karlsson M, McNulty NP, Kallstrom G, Goodman AL, Gordon JI. Creating and characterizing communities of human gut microbes in gnotobiotic mice. ISME J 2010; 4:1094-1098; PMID:20664551; http://dx.doi.org/ 10.1038/ismej.2010.110 [DOI] [PMC free article] [PubMed] [Google Scholar]