

Abstract
The analysis of ribonucleic acids (RNA) by mass spectrometry has been a valuable analytical approach for more than 25 years. In fact, mass spectrometry has become a method of choice for the analysis of modified nucleosides from RNA isolated out of biological samples. This review summarizes recent progress that has been made in both nucleoside and oligonucleotide mass spectral analysis. Applications of mass spectrometry in the identification, characterization and quantification of modified nucleosides are discussed. At the oligonucleotide level, advances in modern mass spectrometry approaches combined with the standard RNA modification mapping protocol enable the characterization of RNAs of varying lengths ranging from low molecular weight short interfering RNAs (siRNAs) to the extremely large 23 S rRNAs. New variations and improvements to this protocol are reviewed, including top-down strategies, as these developments now enable qualitative and quantitative measurements of RNA modification patterns in a variety of biological systems.
Keywords: biological ribonucleic acids, LC-MS/MS, MALDI-MS/MS, modified RNA, modified bases, RNA sequencing, rRNA, tRNA, tandem mass spectrometry
Introduction
Ribonucleic acids (RNAs) play a critical role in both transcription and translation. A unique feature of many RNAs is that they are significantly modified post-transcriptionally, with such modifications believed to have important structural and functional roles.1 Currently, there are >100 post-transcriptional modifications known in RNA.2 Due to these post-transcriptional modifications, methods that can provide both sequence and modification status of RNAs are required. Mass spectrometry (MS) has proven to be a powerful analytical tool for revealing both pieces of information. This review will cover developments in the field of MS of modified ribonucleosides and ribonucleic acids over the past decade. For a more historical description of this area, a number of excellent reviews and book chapters can be consulted.3-10
When RNA modifications are viewed through the lens of MS, there are essentially 3 different sample types one could analyze: nucleosides and nucleotides (treated in MS as small molecules), oligonucleotides, and intact nucleic acids (the latter 2 both treated as larger biopolymers). Techniques and strategies in small molecule MS – usually arising from developments in organic mass spectrometry – have not only been applied to nucleosides and nucleotides, but also to oligonucleotides. As these well-established approaches are utilized on larger and more complex samples, the information that one can obtain about the biological status of the sample increases. Thus, a goal of this review is to illustrate how these analytical strategies yield biological insights pertinent to modified RNAs. In this manner, we hope the reader will better appreciate the capabilities of MS in the field of RNA modifications and become more aware of the possibilities of including MS to increase the quality and quantity of biological information available.
Modified Nucleosides and Nucleotides
Identification of new modified nucleosides
As of the writing of this review, nearly 100% of the modified nucleosides that are reported in the literature and are collected in one of the 2 databases devoted to modified nucleosides – Modomics11 and The RNA Modification Database12 – were either initially discovered by MS or were structurally characterized, in part or in total, by MS. In fact, as with any low molecular weight organic compound, high performance mass spectrometry data, that is molecular weight measurements obtained at high mass measurement accuracy, is necessary for publishing the structure of any new modification. Moreover, MS can reveal the possibility of new modifications, even ahead of the final structural characterization and identification. For example, while determining the modified sequence of tRNALys from Trypanosoma brucei, 3-(3-amino-3-carboxypropyl)-5,6-dihydrouridine (acp3D) was found in the variable loop by Kirpekar and co-workers.13 A second modification was also found in this tRNA at position 37 through the unique mass shift detected by mass spectrometry; however sample limitations precluded complete characterization of this modification.
An illustration of the utility of MS for the characterization of new modified nucleosides is the structural determination of the modified cytidine, agmatidine. Agmatidine was found in Archaea to be present in the wobble position of tRNAIle instead of the common lysidine modification that is found in Bacteria.14,15 When the enzyme responsible for the catalysis of agmatidine was knocked out and the tRNA with the anticodon UAU was expressed, a new modification was discovered at the wobble position. This modification was found to contain a cyanomethyl group on the uridine,16 although interestingly this modification appears to be limited to organisms within the euryarchaea branch.
Even in established, well-studied systems such as Escherichia coli tRNA, MS has revealed new and complex modifications. Geranylated uridines (Fig. 1) have been identified at position 34, the wobble position, where a large geranyl group is found on the sulfur at the second position of the base.17,18 This modification was found to be catalyzed by selU through MS analysis of nucleosides from knock out strains and in vitro activity. Besides E. coli, the geranylated modifications has also been shown to be present in other bacteria including Enterobacter aerogenes, Pseudomonas aeruginosa, and Salmonella typhimurium.18 The discovery of agmatidine, cyanomethyluridine and these geranylated uridines is consistent with the cellular use of metabolic intermediates and products as reagents for RNA modification.19
Figure 1.
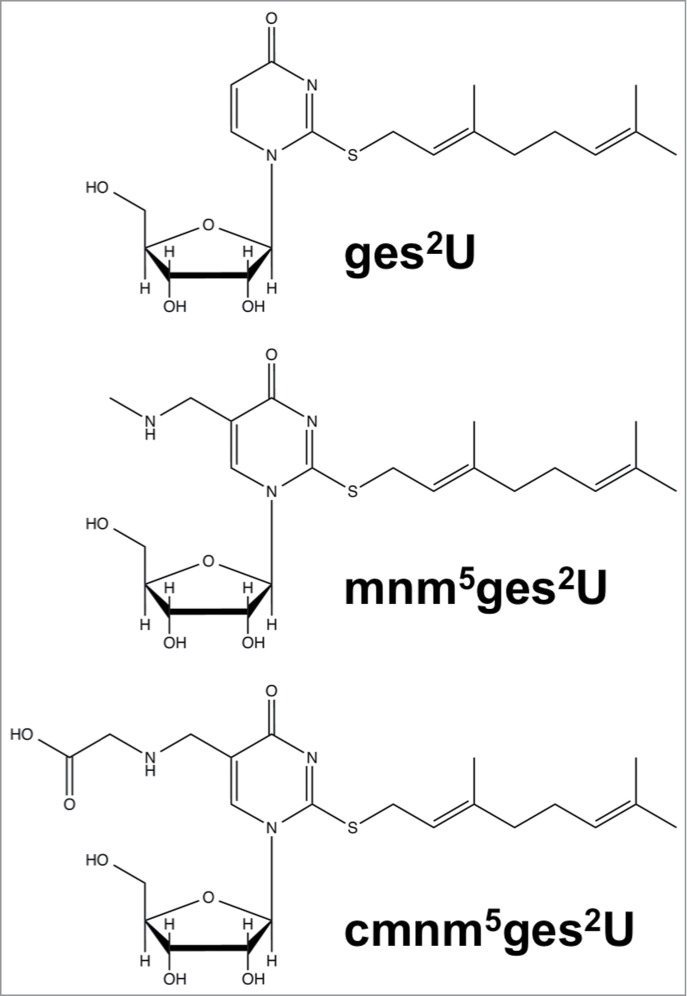
Structures of geranylated uridines: geranylated 2-thiouridine (ges2U), geranylated 5-methylaminomethyl-2-thiouridine (mnm5ges2U), and geranylated 5-carboxymethylaminomethyl-2-thiouridine (cmnm5ges2U).
A rather unique example of an RNA modification that appears to have been overlooked for many years was reported by Suzuki and colleagues.20 N6-threonylcarbamoyladenosine, t6A, is a common tRNA modification that has been identified in Bacteria and Eukaryotes. Suzuki and colleagues discovered this modification actually exists in a cyclic form, ct6A, in most organisms (Fig. 2). The cyclic modification can be converted to t6A depending on isolation conditions. The ct6A is labile in the presence of amine containing buffers and can form adducts with amine containing buffers such as Tris and ethanolamine.20 While this opening of the cyclic modification does not greatly change the data that is known for tRNAs to date, this report does illustrate that the final mass spectrometry data obtained on modifications can be influenced by both sample isolation and mass spectrometry experimental conditions.
Figure 2.

Structural determination of N394. (A) The CID spectra of unlabeled (top) and deuterium (D)-labeled (bottom) ct6A bases (BH2+). The product ions are assigned in the chemical structures of the ct6A base. D-labeled product ions are shown in red. Unassigned spectra containing the D-labeled portion are indicated by asterisks. (B) LC/MS coinjection of the synthetic and natural ct6A. UV traces (254 nm) and mass chromatograms (m/z 395) of synthetic ct6A (top), natural ct6A in E. coli total RNA (middle) and co-injected natural and synthetic ct6A (bottom). ct6A peaks in the UV trace are indicated by red arrows. (C) The chemical structures of ct6A and t6A are mutually convertible by hydration and dehydration. Reprinted by permission from Macmillan Publishers Ltd: Nature Chemical Biology, volume 9, pages 105–111 (2013).
Modification networks – quantifying changes in modified nucleosides
Staying consistent with the desire in the natural and physical sciences to examine systems of greater complexity, MS is now used to provide the complete census of modified nucleosides within any particular system and – more powerfully – can be used to reveal the dynamics of modified nucleosides within a system. The paradigmatic example was the work of Dedon and coworkers, who studied the changes in modified nucleoside abundance for yeast as the organism was subjected to different stress conditions.21
In this study, a single labeled deoxyadenosine standard was mixed with the sample to allow the authors to normalize the signal response from analysis to analysis and from sample to sample. They then found statistically significant differences in the signal response for 23 modifications between untreated and treated yeast cells. This work led them to identify modifications that decreased or increased with respect to the untreated sample when cells were treated with varying amounts of oxidizing reagents. The largest differences found resulted from hydrogen peroxide treatment where 5-methylcytidine (m5C), 2′-O-methylcytidine (Cm) and N2,N2-dimethylguanosine (m22G) increased in abundance while 5-methyluridine (m5U), 1-methylguanosine (m1G), N2-methylguanosine (m2G), 5-carbamoylmethyl-2-thiouridine (mcm5s2U), N6-isopentenyladenosine (i6A), wybutosine (yW), and 1-methyladenosine (m1A) decreased in abundance (Fig. 3). In accordance with these finding, knock out mutants of trm4 (catalyzes m5C) and trm7 (catalyzes Cm) were found to be less viable after hydrogen peroxide exposure as compared to wild type yeast.21 The capability to routinely monitor dynamic changes in RNA modification levels22 enabled Dedon and Begley to propose a regulatory model that correlates such changes with the transcriptional and translational needs of an organism.23
Figure 3.
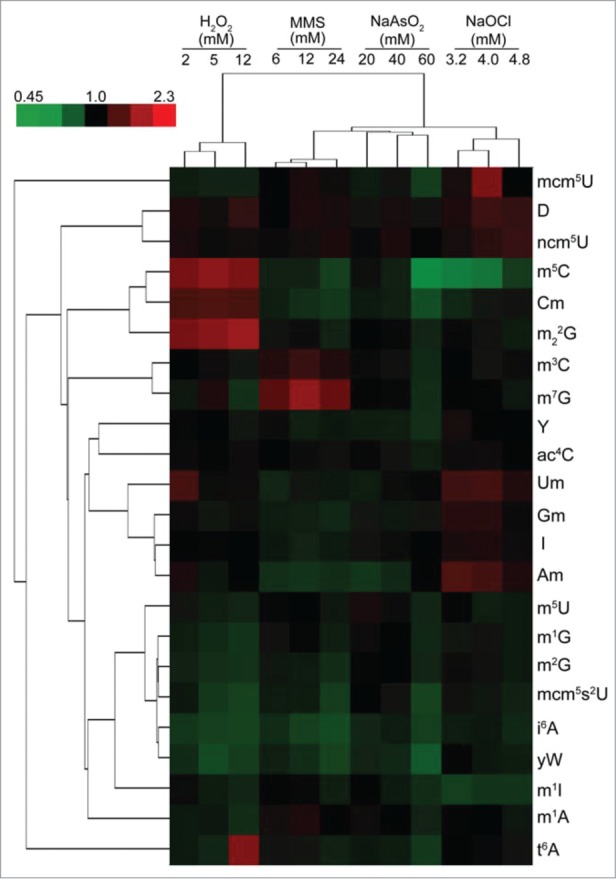
Hierarchical cluster analysis of toxicant-induced changes in tRNA modification spectra in wild-type yeast exposed to concentrations of MMS, H2O2, NaOCl, and NaAsO2 producing 20%, 50%, and 80% cytotoxicity. The top-left color bar indicates the range of fold change values. Figure reproduced from ref (21).
While an internal standard can provide a means to compare 2 samples, a more accurate determination of the quantity of individual nucleosides can be obtained by using an isotope dilution method.24 Isotope dilution methods require adding a known amount of an isotopically labeled standard to quantify the amount of that nucleoside. The direct comparison of the signal of the unlabeled sample and the labeled standard allows a very accurate and reproducible measurement. Although isotope dilution has been used in the past to quantify individual modified nucleosides, recently the Carell group synthesized 12 isotopically labeled standards to measure the levels of multiple nucleosides in 8 tissues from mouse and pig.25 By using well-calibrated analytical measurements, they showed that the levels of individual nucleosides vary considerably from one tissue type to another.
While the Carell group's approach is very appealing for quantification purposes, the synthesis of isotopically labeled modified nucleosides for every modification of interest is not a possibility for every lab. To circumvent this issue, Helm and co-workers used isotopically labeled media to label every nucleoside from an RNA extract with either 15N or 13C. As an example, 5-methyluridine, m5U (or ribosylthymidine, rT), is labeled with either 10 13C atoms or 2 15N atoms shifting the mass by +10 Da or +2 Da, respectively (Fig. 4).26 They then measured the absolute quantity of these labeled nucleosides using unlabeled, commercially available standards. This technique thus allows for the addition of the quantified, isotopically labeled sample to test samples for quantification of a wide array of modified nucleosides. This strategy also allowed for the identification of unknown modifications with the added benefit of determining the number of carbon and nitrogen atoms in the new modifications. With these various options for quantifying large numbers of modified nucleosides across multiple samples, it appears likely that mass spectrometry will become an even more important tool as modifications are evaluated within a metabolomics framework.27
Figure 4.
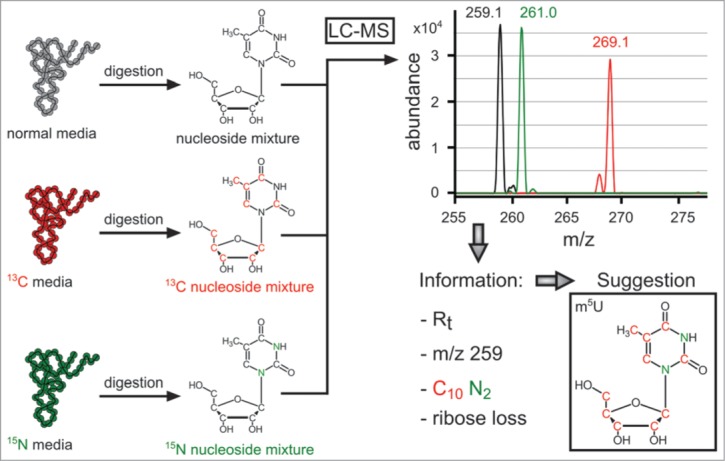
Information obtained by LC-MS/MS of multiplexed isotope RNA labeling, displayed for m5U as a typical ubiquitous modification. Note that the spectrum is an overlay of 3 consecutive injections. Reproduced from Ref. (26) with permission from The Royal Society of Chemistry.
Mass spectrometry analysis of modified nucleotides
Although nucleosides and nucleotides are quite similar – differing by only a phosphate—and are both analyzed by the techniques and instrumentation of small molecule MS, progress in the area of nucleotide MS analysis is much more limited than what has been illustrated for nucleosides. One of the main limiting factors is the ability to separate the modified nucleotides by high performance liquid chromatography (HPLC) prior to detection. Fabris and coworkers have utilized the ability of ion mobility MS to provide separation of nucleotides based on the collisional cross section in the gas phase.28 The desire would be to separate every nucleotide based on the collisional cross section or mass. At this time commercially available instruments do not have the resolving power in the ion mobility cell to separate a large number of structurally similar nucleotides, such as methylated nucleotides that simply differ by the methylation site along the aromatic ring or ribose sugar. Nevertheless, potential advantages arising from the ability of electrospray ionization (ESI) to ionize nucleotides preferentially over nucleosides suggests more efforts in this area will be forthcoming.
Modified Oligonucleotides – RNA Modification Mapping by Mass Spectrometry
RNA modification mapping of tRNAs and rRNAs
Not long after the development of ionization methods such as ESI and matrix-assisted laser desorption/ionization (MALDI) that are capable of sensitive analysis of biomolecules, MS of oligonucleotides was reported.29,30 This area of analysis can be separated into 2 sample types – synthetically generated modified oligonucleotides, such as those created for therapeutic applications, and biologically isolated modified oligonucleotides. For the former, direct mass spectrometry sequencing is often used to characterize these synthetic modified oligonucleotides.31 Within the latter type, while direct analysis of smaller RNAs, such as small interfering or micro RNAs (siRNAs and miRNAs) has been reported,32 MS approaches for the analysis of large RNAs, such as tRNAs (tRNAs) and rRNAs (rRNAs), are primarily used to map modified nucleosides onto an already known RNA sequence. These RNA modification mapping approaches typically seek to characterize modified large RNAs through the initial generation of smaller oligonucleotides, which may or may not be modified, as these smaller oligonucleotides are quite compatible with modern techniques and instrumentation available in MS. Keeping with the overall focus of this review, MS analysis of therapeutic oligonucleotides will not be covered in any further detail, although there are several excellent summaries of advances in the field that the interested reader may consult for further information.31,33-35
Ribonuclease (RNase) fingerprinting is a biochemical approach developed in the early 1960's for sequence and structural analysis of RNA.36 As originally developed, a specific RNase such as RNase T1, which cleaves 3′ of any unmodified guanosine residues, is used to digest a larger RNA into smaller digestion products. These products were end-labeled, separated by ionophoresis (electrophoresis) and the resulting bands detected by radioisotope imaging. The presence of modified nucleosides in T1 digestion products was determined by anomalous migration within the gel. In 1993, ∼30 years after the original, McCloskey created a mass spectrometry-based protocol, which obviated the need for radiolabeling and gel separation (Fig. 5).37 By using tandem mass spectrometry (MS/MS) on HPLC separated RNase T1 digestion products, the McCloskey RNA modification mapping approach became the standard technique in MS for placing modified nucleosides onto the primary sequence of large RNAs.38-40
Figure 5.
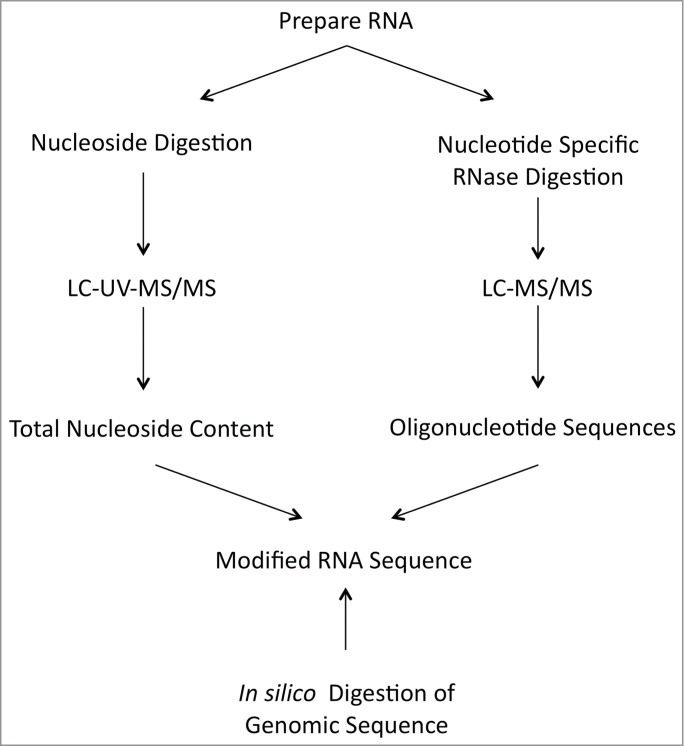
Protocol for the determination of post-transcriptionally modified nucleosides in RNA.
RNA modification mapping for an individual RNA typical begins by obtaining information on all of the modified nucleosides present in the RNA through LC-MS/MS analysis of nucleoside digests (represented by the left side of Fig. 5), which was described above. This information simplifies the analysis of subsequent RNase digestion products and also provides identification on specific modifications, such as methylated nucleosides, that cannot be directly determined by RNase digestion. The sample is then digested with the guanine-specific RNase T1, the pyrmidine-selective RNase A, and/or the purine-selective RNase U2. These RNase digestion products can be separated by HPLC and concurrently analyzed by MS/MS (as illustrated on the right side of Fig. 5).
MS/MS is commonly implemented in RNA modification mapping by MS as the fragmentation of oligonucleotides has been studied to the point where one can now predict the fragment ions that may be produced by a particular sequence.41-44 Because one can predict the fragment ions produced, one can also determine the sequence of an oligonucleotide based on the mass and the fragment ions generated de novo. From the precursor mass a list of potential nucleotide compositions can be generated, and depending on the enzyme used, some limitations of compositions can be incorporated into the analysis scheme. For instance, RNase T1 digests on the 3’ end of unmodified guanosine,45 and has been found to be inhibited by N2-methylguanosine (m2G) in certain instances.46 By limiting the number of guanosines to one in a composition, the number of compositions to be evaluated against the experimental data is reduced. With this limited number of potential compositions, the resulting MS/MS data can be analyzed to determine the composition that is correct and the order of the nucleotides in the sequence.
This RNA modification mapping process is illustrated in Figure 6. From a separate LC-MS/MS analysis of the nucleoside digest of this RNA (not shown in this figure), the nucleosides determined to be present in the sample are the typical C, U, G and A found in RNA as well as modified nucleosides dihydrouridine (D), pseudouridine (Ψ), 5-methylcytosine (m5C), m5U, m2G, and queuosine (Q). With this information in hand, the tRNA was then digested with RNase T1 and the resulting digestion products were analyzed by LC-MS/MS to determine where each of these modified nucleosides were to be located on the primary RNA sequence. The digestion product of most interest for this work was that of the anticodon of the tRNA with the sequence CCU[Q]UCA[m5C]Gp.46 This oligonucleotide was found to elute at 39.0 min. with other nearly co-eluting oligonucleotides. The sequence of this RNase T1 digestion product is confirmed by collision induced dissociation tandem mass spectrometry (CID MS/MS). The fragmentation obtained by CID produces primarily –c and –y ions for the canonical nucleotides and most modified nucleotides (Fig. 7).41-43,47,48 Therefore the MS/MS data is inspected for the expected product ions for this oligonucleotide. The same analysis can then be performed for every detectable oligonucleotide to map each modification detected onto the gene sequence, and finally arriving at the complete modified sequence (Fig. 6). The procedure is also repeated with other RNase digestions, if necessary, to ensure appropriate sequence coverage of the RNA of interest.46
Figure 6.

Schizosaccharomyces pombe Asp-tRNAGUC contains queuosine at position 34. (A) LC-MS/MS was performed on T1 digested tRNA producing a total ion chromatogram (TIC). (B) A digestion produce (m/z 1002.6) was found eluting at 39.0 min., as shown by the extracted ion chromatogram (XIC). The MS spectra at this time point depicts a signal from 3 oligonucleotides CCU[Q]UCA[m5C]Gp (m/z 1504.25−2 and 1002.58−3), AAUCCCGp (m/z 1120.33−2 and 746.67−3), and UACACAAG>p (m/z 1288.25−2 and 858.42−3). (C) Collision induced dissociation of m/z 1002.58 produces the nearly all expected –c and –y ions for the sequence CCU[Q]UCA[m5C]Gp. (D) Sequence of S. pombe Asp-tRNAGUC. Reprinted and adapted with permission from ACS Chemical Biology. Copyright 2014 American Chemical Society.
Figure 7.
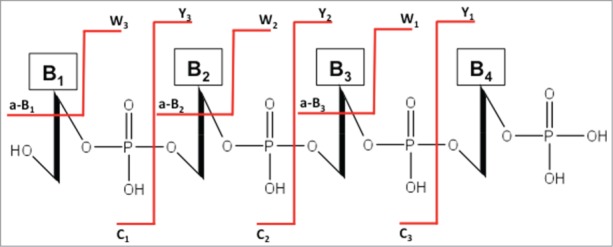
The standard nomenclature for oligonucleotide fragmentation during collision-induced dissociation tandem mass spectrometry (CID-MS/MS). The numbering of a-B, c and w, y fragments starts from the 5′ and 3′ terminus, respectively.
Most commonly, the RNA modification mapping approach has been used for the placement of modified nucleosides onto a single RNA sequence, although large numbers of smaller RNA sequences or very large (e.g., rRNA) sequences can be analyzed in a serial fashion. For example, the Suzuki group used their Chaplet chromatography system49 to isolate each bovine mitochondrial tRNA for LC-MS/MS analysis of both the nucleosides and oligonucleotide digests. The number of characterized bovine mitochondrial tRNAs was increased from 11 to 22 tRNAs, and 5 tRNAs that were previously characterized were found to contain additional modifications that were originally not reported or reported as unknown modifications.50
McCloskey and coworkers, building extensively on their RNA modification mapping protocol,37 have mapped modified nucleosides onto the sequences of 16S rRNA from Haloferax volcanii,51 Thermus thermophilus,39 and Thermotoga maritima40 by LC-MS/MS. Also using LC-MS/MS, Rozenski and coworkers mapped modifications onto the 16S rRNA sequences of Clostridium acetobutylicum52 and Legionella pneumophila.53 MALDI-MS has been used by Kirpekar and coworkers to map modifications onto the sequence of various 23S rRNAs including the A-loop (helices 90–92) from Sulfolobus acidocaldarius, Bacillus subtilis, and Bacillus stearothermophilus,54 and the entire 23S rRNAs of Thermus thermophilus55 and Haloarcula marismortui,56 as well as the 5S rRNA from Solfolobus acidocaldarius, Bacillus Stearothermophilus, Halobacterium halobium, and Haloarcula marismortui.57 As modifications have been mapped onto various rRNA sequences, a database, which is currently limited to 16S rRNAs, has been established to enable various biochemical and phylogenetic analyses of rRNA modification patterns (http://rna.rega.kuleuven.be/ssu/).58
Another common application of RNA modification mapping is for the characterization of modification enzyme substrates and activity. For example, the human DNA methyltransferase Dnmt2, which was known to catalyze the production of m5C, was recently found to also be active on tRNAs.59 The tRNA sequence location of this methylation was identified by MS, and Dnmt2 has since been implicated in stress sensitivity. Moreover, homologs have been found in many organisms outside of vertebrates including Schizosaccharomyces pombe, Dictyostelium discoideum, Entamoeba hystolitica, and the bacterium Geobacter sulfurreducens, to name a few.60-63
Limitations of the RNA modification mapping approach
One limitation of the traditional RNA modification mapping approach by MS is the reliance on mass differences to identify the sequence location for a modified nucleoside. Modifications that share the same mass value, e.g., methylations such as 7-methylguanosine (m7G), 1-methylguanosine (m1G), N2-methylguanosine (m2G) and 2’-O-methylguanosine, cannot be differentiated within the MS/MS data. In those cases, the total nucleoside analysis – conducted separately – can be used to limit the possibilities. In cases where that additional information cannot resolve the discrepency, one can resort to using phylogenetic conservation of modification locations (found in the Modomics Database)11 or to using nucleoside digests of fractionated RNase digests37 to help clarify modification placement.
A more severe limitation of this RNA modification mapping approach arises when trying to place pseudouridine onto specific sequence locations of an RNA. Pseudouridine is a structural isomer of the cannonical nucleoside uridine, thus no mass difference will be revealed during MS/MS analysis that can differentiate pseudouridine from uridine. To overcome this limitation, 2 general methods for mapping pseudouridines onto primary RNA sequences by mass spectrometry, derivitization or fragmentation-based identification have been developed.64-69 The fragmentation-based method is very convenient because it does not require special sample treatment, but does require more sample to be analyzed for the detection of specific product ions from fragmentation that will indicate a pseudouridine is present on the end of the oligonucleotide or in the middle of the oligonucleotide.64,67 The derivitization method typically involves treating the sample to chemically label pseudouridines and not uridines, with methylvinylsulfone, acrylonitrile or 1-cyclohexyl-(2-morpholinoethyl)carbodiimide metho-p-toluene sulfonate (CMCT), which was originally used for biochemical pseudouridine detection by strong stops during primer extension.66,69,70 The added mass after any of these chemical treatments can easily be detected and the sites of pseudouridylation identified. However, great care must be taken to ensure that pseudouridines are labeled selectively. This derivatization strategy was used by the Suzuki group to place pseudouridines when characterizing the bovine mitochondrial tRNAs described above.50
Variations of RNA Modification Mapping
Signature digestion products
Within the past decade, several variations of the RNA modification mapping by mass spectrometry approach have been introduced. One of the earliest arose from the realization that RNA modifications can be used to identify the presence or absence of specific RNAs through the unique increase in mass brought about by modification.71 Hossain and Limbach then introduced the concept of signature digestion products (SDPs), which are RNase digestion products that can be used for the identification of the source RNA. Using this method with total E. coli tRNA, 19 tRNA families could be identified using RNase T1 and 13 tRNA families with RNase A (Fig. 8).72 The number of SDPs can be increased for any given sample by using multiple RNases for the analysis.73 The identification of signature digestion products can be performed in MS mode only, but the use of MS/MS will enhance the number of signature digestion products identified.74
Figure 8.
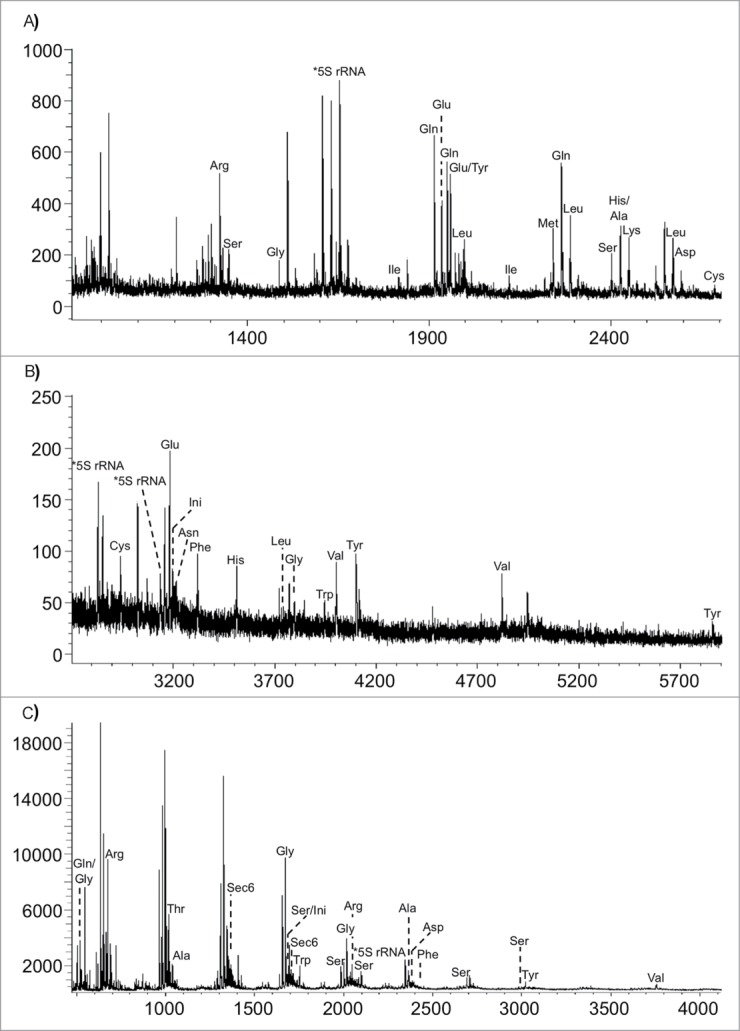
MALDI mass spectra obtained from the RNase T1 digestion of E. coli tRNAs. (A) m/z 900–2700; (B) m/z 2700–6000. (C) MALDI mass spectra obtained from the RNase A digestion of E. coli tRNAs. Figure reproduced from ref (72).
Isotopic Labeling of RNase Digestion Products
Another variation has been to incorporate isotopic labels within RNase digestion products to enhance the identification and/or quantification of (modified) RNAs. The first reported isotopic labeling strategy involved using labeled water during the RNase digestion of an RNA.75 The catalytic mechanism for RNase digestion involves the transfer of an oxygen (as a hydroxyl) from water onto the 3’-terminus of the oligonucleotide digestion product. This enzymatic incorporation of isotopic labels has been used to improve data analysis in MS/MS experiments,75 enable the relative quantification of RNAs (modified or not) present in 2 samples,76,77 and allowed for the comparative analysis of RNA digests (CARD) approach,78,79 which is described further below.
More recently, Waghmare and Dickman showed the advantages of incorporating isotopic labels through the culturing medium.80 RNA could be labeled by growing E. coli in 14N and 15N enriched media. They illustrated how isotopic labeling improved the identification of RNase digestion products, as the mass shift arising from 15N allows one to confine the number of nitrogen atoms in any particular digestion product. In addition, various ratios of labeled RNAs were combined and analyzed by mass spectrometry to determine the accuracy and precision of RNA quantification by this strategy. As proof-of-concept of the utility of this labeling strategy, they were able to obtain relative quantitative information on modified and unmodified oligonucleotides from RNase digests of 16 S rRNA (Fig. 9).
Figure 9.
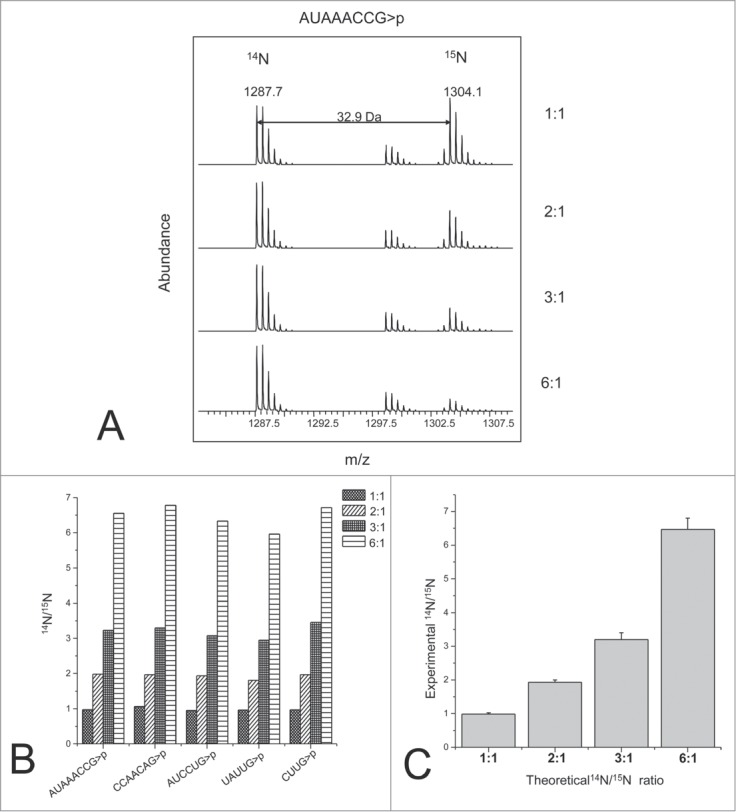
RNA quantification using stable isotope labeling and mass spectrometry analysis. (A) TOF MS spectra of the light and heavy oligoribonucletide AUAACCG>p observed from a range of different light:heavy ratios. (B) Light to heavy ratios obtained for 5 different oligoribonucleotides identified. (C) RNA quantification of the theoretical and experimental data from 5 different oligoribonucleotides generated from the 16S rRNA digest. The error bars represent the standard deviation. Reprinted with permission from Analytical Chemistry, volume 83, pages 4894–4901. © 2011 American Chemical Society.
Subsequently, the Williamson lab adapted this labeling strategy to study rRNA modification pattern changes during the assembly of bacterial ribosomes. Labeling of the RNA was accomplished with 15N ammonium sulfate, CD3 methionine (for labeling methylations), and/or 5,6-D-uracil (for labeling uracil and pseudouridine). The non-enriched medium was used to isolate fully formed 70 S ribosomal particles isolated by sucrose gradient, which was considered 100% modified for comparison purposes. The example of this analysis in Figure 10 depicts results obtained from 15N labeling of a oligonucleotide with 23 nitrogens. The mass shift allows the direct comparison of signal intensity between the 2 samples for quantification purposes. The isotopically enriched RNA was fractionated using sucrose gradients and the modification status across the gradient were compared to the fully formed 70 S particle. Using this approach, early, middle and late occurring rRNA modifications during the course of rRNA maturation could be determined.81 As with measurements at the nucleoside level, the ability to incorporate isotopic labels into RNA samples and use such labels for quantitative evaluation of changes in modified RNAs appears to be a powerful marriage of methodology and technology.
Figure 10. (See previous page).
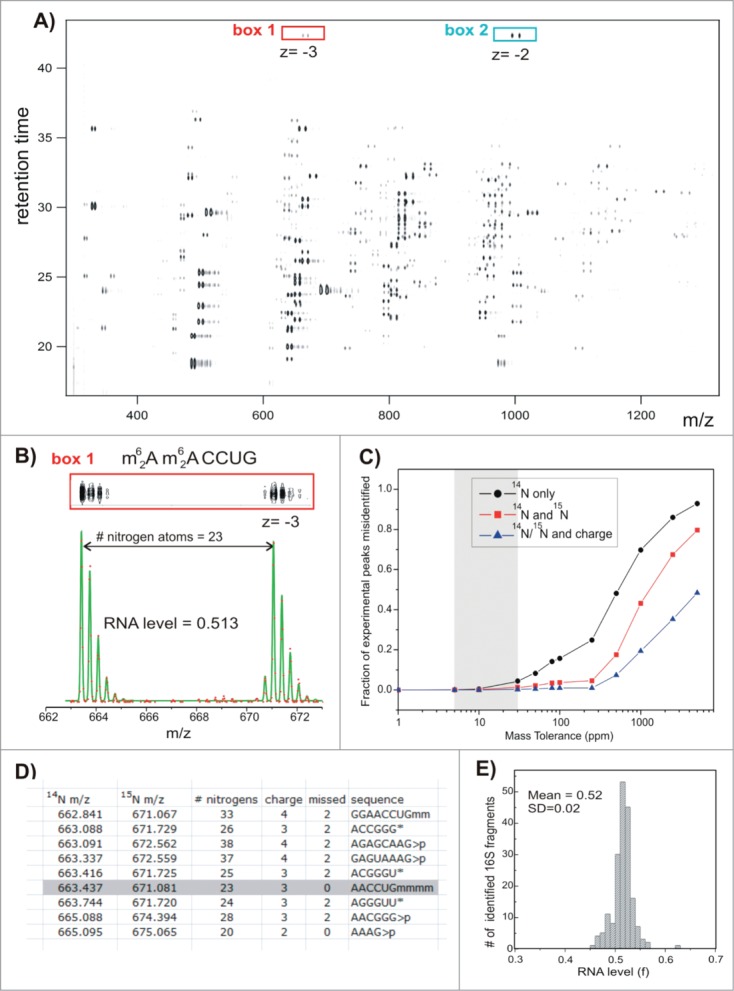
LC-MS separation and data fitting. Results of the control experiment in which 14N- and 15N-labeled and individually purified 16S RNA were mixed in a 1:1 molar ratio and digested with ribonuclease T1. (A) Low-resolution contour plot of the LC-MS run, showing pairs of the co-eluting 14N/15N rRNA fragments. Data were collected using negative ionization mode. (B) High-resolution LC-MS peak profiles (box 1), MS isotope distributions (red dots), and their least-squares fits (green traces) for a representative 16S fragment (box1 in A). (C) Ambiguity of peak identification as a function of the mass tolerance parameter (ppm). MS peaks were matched against the 16S theoretical digest (described in D), and the fraction of experimental peaks assignable to more than one rRNA fragment was calculated. Peak identification was carried out using m/z values for 14N-labeled fragments only (black); m/z for both 14N- and 15N-labeled fragments and assuming that fragments should elute within 0.1 min of each other (red); using 14N and 15N m/z and charge state (z) of the 2 species (blue). (D) Excerpt of the RNase T1 theoretical digest containing predicted 16S RNA fragments and their monoisotopic m/z values in the ‘vicinity’ of (m62A)(m62A)CCUG (gray box). Digest includes RNA species with charges 1–4, with 0−2 missed cleavages and either linear or cyclic (>p) phosphate at 3′ terminus. List is sorted by 14N m/z values. m − is a methyl group, >p − cyclic phosphate (otherwise linear), and * marks compositionally nonunique RNA fragments included as a single entry. (E) Histogram of RNA level values calculated for all 16S rRNA fragments identified in the control experiment. Reprinted with permission from Journal of the American Chemical Society, volume 136, pages 2058–2069. © 2014 American Chemical Society.
Comparative analysis of RNase digestion products
Most recently, our group introduced a multiplex approach for measuring changes in RNA sequence and/or modification status that combines isotopic labeling with concepts originating within the signature digestion product approach.78 Here multiplex analysis is obtained by digesting one of the samples with 18O water. The labeling of one sample with an additional 2 Da allows the direct comparison of the labeled sample to one that is digested in non-enriched water, which can enable the identification of differences among the digestion products of the 2 samples.
We subsequently used the CARD approach for the comparative sequencing of nearly all of the tRNAs from the bacterium Citrobacter koseri by using the previously characterized E. coli tRNAs as the reference for comparison.79 One advantage of the CARD approach for mapping modifications onto RNAs is that rather complex mixtures, such as mixtures of total tRNAs, can be analyzed without requiring the de novo sequencing of all detected digestion products nor requiring the purification of individual RNAs prior to analysis by techniques such as Chaplet chromatography.49 However, a limitation of this CARD approach arises when 18O water is used for isotopic labeling. The small mass difference (+2 Da) between the reference and unknown digestion products become challenging to characterize due to the presence of natural isotopes (e.g., 13C and 15N), which can overlap and obscure the doublets expected from identical digestion products. A remedy to this problem involves culturing samples in 12C-enriched/13C-depleted medium.74 Reducing the 13C isotope contribution significantly simplifies the identification of singlets and doublets in the CARD approach (Fig. 11).
Figure 11.
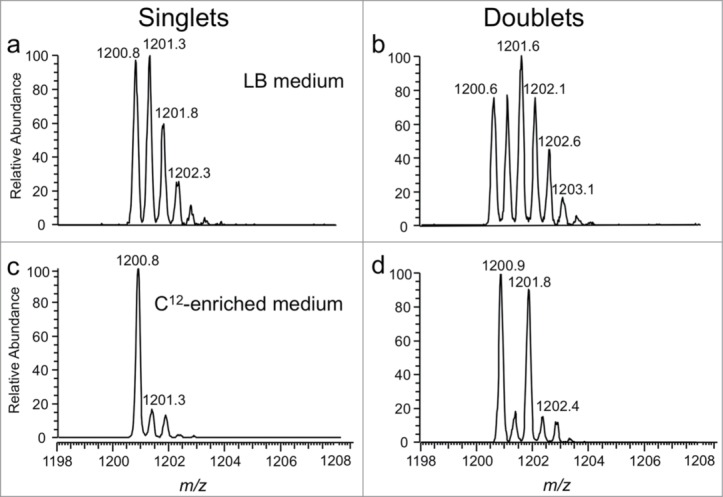
Improvements in singlet and doublet identification using 12C-enriched medium as illustrated with the doubly-charged E. coli total tRNA RNase T1 digestion product A[ms2i6A]AACCGp (MW 2403.4 Da). (a) Mass spectrum from sample grown in LB medium and labeled with 16O during RNase T1 digestion. (b) Same sample as in (a) except labeled with both 16O and 18O during RNase T1 digestion. (c) Mass spectrum obtained when sample grown in 12C-enriched medium and labeled with 16O during RNase T1 digestion. (d) Same sample as in (c) except labeled with both 16O and 18O during RNase T1 digestion. Singlet and doublet identifications are simplified in (c) and (d), respectively, by use of 12C-enriched medium. Figure reproduced with permission from ref (121).
Intact RNAs
While RNase digestions produces reliable data by decreasing the size of the analyte to be analyzed, at times analysis of the intact molecule may be desirable or even beneficial. In the case of relatively small non-coding RNAs, the molecules can be separated chromatographically before MS analysis if desired and can provide complete or nearly complete sequence information.32 In some cases where the location of a modification has been determined, MS is used for validation purposes to determine the mass of the intact RNA, which should match the expected mass. One such situation is the use of MS to confirm the presence of a single methylation on plant microRNAs.82 The methylation was found to be located on the terminal nucleotide of the micro RNAs. The enzyme responsible for the catalysis of the methylation is HEN1 and has since been found to block uridylation, which leads to microRNA degradation. Homologs have also been found in Drosophila to methylate siRNAs and piRNAs83 and in mouse to methylate piRNAs.84
The analysis of intact RNAs (referred to as top-down analysis) up to the length of tRNAs has been demonstrated primarily by the groups of McLuckey and Breuker.85,86 The general scheme for analysis is to purify the RNA of interest to near homogeneity, infuse the RNA for ESI, which produces a wide range of charge states of the molecule, isolate one of the species in the gas phase, and perform tandem mass spectrometry on the isolated molecule by CID and/or electron detachment dissociation (EDD). The resulting fragmentation of the RNA is very complex but near complete sequence coverage has been obtained using both methods of tandem mass spectrometry.
The McLuckey group performed their analysis with a prototype QqTOF. Commercially prepared yeast tRNAPhe was ionized by electrospray, and a single charge state was selected in the gas phase for fragmentation. After fragmentation of the tRNA by CID, the charge state of the product ions was reduced by introducing a singly positively charged ion. The charge state is reduced in the gas phase due to ion/ion interactions, and finally the product ions are analyzed by the time of flight to provide high accuracy data for identification. The sequence coverage, however, was not complete, especially in the middle region of the tRNA near the anticodon loop where many modifications of interest are found.85
The Breuker group utilized a Fourier transform ion cyclotron resonance (FT-ICR) mass spectrometer and infused a commercially prepared E. coli tRNAVal in the presence of piperidine and quinuclide to generate highly charged species of the tRNA. The tRNA was isolated and fragmented by CID and EDD independently. The product ions from both methods of fragmentation allowed nearly complete sequence coverage of the tRNA (99%) (Fig. 12). The high resolution and accuracy obtained from the FT-ICR allowed the identification of highly charged product ions and confidence in the identification. This method provides an intriguing possibility to analyze large intact molecules that are synthesized or post-transcriptionally modified using commercially available instrumentation.86
Figure 12.
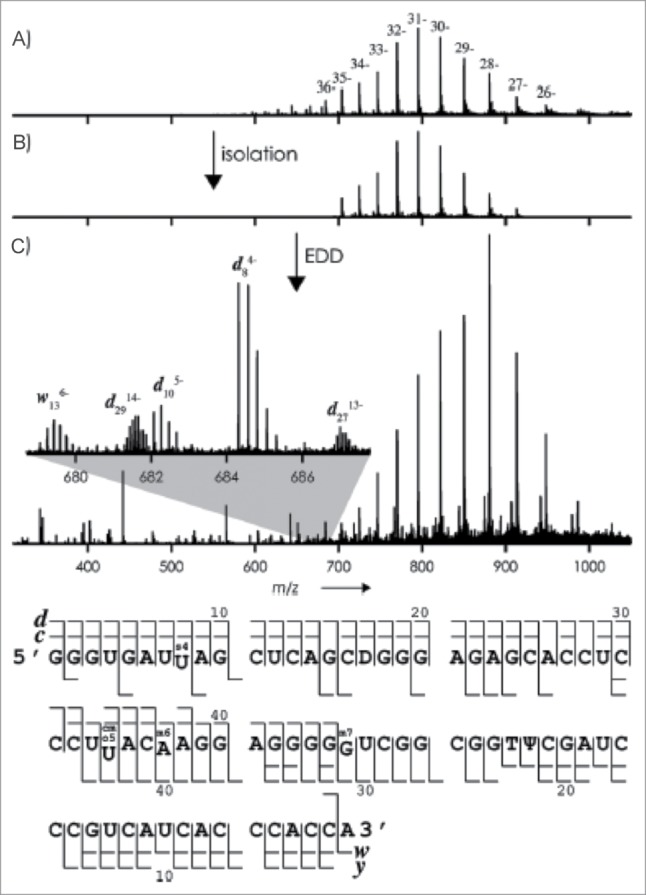
(A) ESI mass spectrum of tRNAVal (2 mm) in H2O/CH3OH (1:1) with piperidine (10 mm) and quinuclidine (10 mm); (B) isolation of ions with m/z values between 700 and 920; (C) mass spectrum after exposure of these ions to 28 eV electrons (the inset shows isotopically resolved fragment-ion signals). Bottom: Fragment-ion map illustrating sequence coverage from CAD and EDD of tRNAVal. Figure adapted with permission from ref (86).
The Techniques for RNA Mass Spectrometry
High-performance liquid chromatography - nucleosides
HPLC has become an indispensable analytical technique for the analysis of modified nucleosides and for RNA modification mapping. Within the field of nucleoside analysis, the most common chromatography method, based on C18 stationary phases, was originally published approximately 40 years ago87 and was then adapted to LC-MS analysis by Pomerantz and McCloskey.88 These chromatographic conditions have changed little in the past 25 years. The use of columns that can withstand very highly aqueous conditions have been employed and the scale of the chromatography has been reduced to use less solvent and improve desolvation by reducing the flow rate. Yet, all of these changes have occurred to better match the HPLC conditions to the ESI source often used during LC-MS/MS.
While not commonly implemented, hydrophilic interaction liquid chromatography (HILIC) has been investigated to allow for separations using a higher percentage of solvent to aid desolvation.89-92 Unfortunately, these methods have not been applied to nucleoside digests of biologically isolated modified RNAs, and thus limited information is available regarding the expected retention times for modified nucleosides.
There are few reports of the development of appropriate HPLC conditions that would enable LC-MS/MS analysis of modified nucleotides. Ion pairing reverse phase (IP-RP) chromatographic conditions have been described for the LC-MS analysis of nucleotides,93,94 although primarily standard nucleotides were investigated. Similarly, while HILIC coupled to ESI-MS has been described for the analysis of standard nucleotides,90 it is unclear if that approach is applicable to mixtures of modified nucleotides. Further investigations and developments in this area are warranted.
High-performance liquid chromatography - oligonucleotides
The most widely used chromatography for oligonucleotide analysis for LC-MS/MS analysis is IP-RP chromatography.95,96 This method allows the separation of RNase digested RNAs, although the combination of triethylamine, as the ion pairing agent, and 1,1,1,3,3,3-hexafluoro-2-isopropanol, as a mobile phase additive to improve ESI performance, can lead to instrument contamination, which will be an issue if other analytes and/or chromatographies are to be used on the same LC-MS system. Recently, a variety of HPLC mobile phases that are more friendly to instrumentation have been investigated, primarily within the field of therapeutic oligonucleotide analysis.34 While those methods have not yet been exported into an LC-MS/MS approach for RNA modification mapping, one would expect to see a greater variety of IP-RP conditions being used for separating and analyzing RNase digests of RNA in the near future.
Far less common in RNA modification mapping is the use of non-RP methods. As for nucleoside chromatography, HILIC has also been investigated for the on-line separation and ESI-MS analysis of oligonucleotides.97-99 Although RNase digests have not been analyzed using HILIC, these early reports do suggest this alternative may provide advantages for LC-MS/MS within an RNA modification mapping strategy. The chromatographic method that is usually avoided for oligonucleotide separation is anion exchange (AE) chromatography. While AE is commonly used in biochemical laboratories for oligonucleotide separations, the requirement of high salt concentrations for effective separations precludes its direct coupling with ESI-MS.100
Mass spectrometry instrumentation
Mass spectrometers for nucleoside, nucleotide, and oligonucleotide analysis vary greatly and each has benefits and disadvantages. These benefits and disadvantages match those found in typical mass spectrometry applications – that is, instrumentation that provides high resolution and high mass measurement accuracy, which are requirements for characterizing new modified nucleosides, may not yield the best sensitivity, which is a requirement for accurate quantification of modified nucleosides. The descriptions below arise from the author's own experiences and biases – and exceptions can certainly be found for every generalization provided. More detailed descriptions of mass spectrometer configurations, especially as used in small and large molecule biological research, can be found in a number of recent reviews.4,9,31,33-35,101,102
The most common mass spectrometry platform for nucleoside analysis depends on the analytical goals of the experiment. Without question, for quantitative analyses – especially those illustrated by the work of the Dedon and Helm labs 21,26 – a triple quadrupole mass analyzer configuration is preferred. Triple quads, as they are called, provide outstanding sensitivity especially when operated in multiple reaction monitoring (MRM) mode. During MRM operation, the mass spectrometer can isolate a particular m/z for the nucleoside in question using the first quadrupole, fragment the nucleoside using the second quadrupole, and detect a particular fragment ion using the third quadrupole. The high sensitivity arises due to the unique precursor to product ion transition (Q1 → Q3) that limits background noise and enhances the selectivity of nucleoside quantification. In typical experiments, a number of transitions are established prior to the HPLC run, enabling global quantification of the entire complement of modified nucleosides within the sample. Because these MRM transitions are established before sample analysis, this mode of operation is typically used only when the sample components are already identified.
For the discovery of unknown modifications, or when qualitatively characterizing modified nucleosides from isolated RNAs, other mass analyzers such as ion traps and time-of-flight (TOF) configurations can be used. These instruments are generally less sensitive than a triple quadrupole in MRM mode, thus requiring more sample for analysis. However, the duty cycle of these instruments readily exceeds that found for triple quadrupoles, allowing them to be used in applications requiring extensive characterization of sample mixtures. Common iterations include linear ion traps or quadrupole-TOFs (qTOF) coupled to HPLC for the characterization of RNase digests. Both instrument configurations retain their good sensitivity when coupled with HPLC, with qTOFs being preferred as the chromatographic time scale (i.e., peak widths) decrease.
At the high end of mass spectrometry instrumentation, many qTOF and MALDI-TOF/TOF systems possess sufficient mass resolving power and mass measurement accuracy to allow for elemental composition prediction, which is essential for the identification of new modifications. The alternative for identification of new modifications are Fourier transform-based mass analyzers, either FT-ICR or orbitrap instruments, that provide unparalleled mass accuracy. These high end mass analyzers are also quite appropriate for standard analysis and detection of modified nucleosides or for RNA modification mapping by MS/MS analysis of RNase digests. We note that while the user will gain significant information through such higher performance instruments because the higher resolving power can be used to better identify the sample or interpret the MS/MS data, linear ion traps and Q-TOF configurations can be used with little overall effect on the modification mapping strategy.
Software and database tools for RNA analysis by mass spectrometry
As is common in nearly all areas of biological mass spectrometry, the demands of data analysis software and bioinformatic tools to help make sense of data obtained from the analysis of modified RNAs outstrip the supply of tools on hand for the researcher. Fortunately, over the past several years, solutions are being developed that – at a minimum – now simplify the process of interpreting and understanding mass spectral data. Within the area of modified RNA analysis, the solutions can be grouped into 2 broad categories – databases and software.
As mentioned in an earlier section, there are 2 major databases that are devoted to modified nucleosides – Modomics (http://modomics.genesilico.pl/)11 and The RNA Modification Database (http://mods.rna.albany.edu/home).12 While sharing similarities, each database has a different focus on the topic of modified nucleosides. Modomics provides a repository of the biosynthetic pathways, enzymes and sequence locations for all known modified nucleosides in RNA. The RNA Modification Database provides a comprehensive listing of the chemical properties of modified nucleosides, including citations to the original synthesis and structural characterization of each. In this manner, these databases are complementary and either can be consulted when seeking to learn about the types and diversity of RNA modifications found in nature. There are also more specialized databases devoted to modified RNAs that can be of use during RNA modification mapping. As mentioned earlier, the 16 S rRNA database58 (http://rna.rega.kuleuven.be/ssu/) contains a listing of all reported modifications within the small subunit RNA. A similar database of modified nucleosides in rRNAs for model organisms is also a useful resource (http://people.biochem.umass.edu/fournierlab/3 dmodmap/main.php).103 Two databases devoted to modified tRNAs, the tRNAdb (http://trna.bioinf.uni-leipzig.de/DataOutput/)104 and RNAccess (http://bearcatms.uc.edu/rnaccess/)72 are also resources that can be consulted to assist in RNA modification mapping of those specific RNAs.
The status of software geared for RNA mass spectrometry has improved significantly over the past several years.105 Simple calculators that can be used to predict expected molecular weights of modified nucleosides or RNAs are available (MongoOligo – an online calculator (http://mods.rna.albany.edu/Masspec-Toolbox) and MO Predict – a downloadable calculator (http://bearcatms.uc.edu/new/limbachgroup_publication/mo-predict-software.html)). These calculators also allow one to predict expected MS/MS fragmentation patterns, which can be useful during the interpretation of data obtained by mass spectrometry. Two database search strategies for RNA mass spectrometry data, RRM106 and Ariadne,107 permit the analysis of RNA MS and MS/MS data in a similar manner as the polypeptide analysis suite MASCOT and other similar protein-focused software.108 RRM allows one to search genome or RNA sequence databases using MS data. Ariadne takes tandem mass spectrometry data generated from either biologically or in vitro-derived RNA and scores the comparison of the data to an inputted database of theoretical ribonuclease digested and CID-fragmented RNA sequences.
In addition to these databases, stand-alone software also exists to assist in the interpretation and annotation of raw mass spectral data, including MS/MS data. Nyakas et al. developed the programs OMA and OPA, which allow analysis of MS and MS/MS data with a customizable database of nucleotides, thus all known RNA modifications can be analyzed.109 Most recently, we have reported on the software program RoboOligo (http://bearcatms.uc.edu/new/limbachgroup_publication/robooligo-software.html), which allows for the manual annotation of MS/MS data from modified oligonucleotides.110 Further, RoboOligo also has a de novo annotation feature, that can automate and batch-process LC-MS/MS datasets, in particular those obtained during RNA modification mapping. While additional tools will benefit the field and accelerate the pace of research, all of the components – chromatography, mass spectrometry and software – exist to enable mass spectrometry to be applied to increasingly complex samples and more involved experimental conditions.
The Future – Promises and Challenges
As we hope is clear from the all too brief summary of recent developments in the field, mass spectrometry is an extremely powerful analytical tool for the detection and characterization of modified nucleosides and RNAs. In the opinion of these authors, this technique remains surprisingly underutilized and underappreciated by researchers in RNA-related fields. To be sure, genomic-based technologies are more widespread, usually of lower cost, and are more familiar to biological researchers. As such, one can now see an emphasis on creating methods for detecting RNA modifications that utilize genomic-based technologies, e.g., microarrays or RNA-seq.111-115 Such methods do provide advantages related to sensitivity, broad applicability to sample types such as mRNA, and more readily available informatics tools to assist in processing large amounts of data. One trade-off is the limited number of modifications that can be characterized, at this time, by such approaches.
However, it is instructive to note those areas where genomic-based technologies have advantages over mass spectrometry to identify areas where mass spectrometry improvements would be beneficial. Among the most critical challenges facing mass spectrometry-based approaches is the relatively poor sensitivity of ionization methods for nucleosides and oligonucleotides, with the former being far worse than the latter, along with the need for rigorous sample preparation to generate RNA samples compatible with MS. A recent example illustrates these points well.116 Hori and coworkers have shown that only 20 ng of a single purified tRNALeu from Thermoplasma acidophilum was required for mapping modified nucleosides onto this RNA sequence. The less sensitive nucleoside analysis required 40 × more sample (800 ng), although both of these sample amounts appear to be compatible with many biological investigations. However, the total amount of sample actually required for all of the sample purification steps, while not specifically reported in this work, was significantly greater as total RNA isolation, gel purification, tRNA precipitation and probe-isolation of the specific tRNA were all necessary to prepare the < 1 μg sample amount used in the MS analyses. Contrasted with RNA-Seq protocols that require from 100 ng to 10 μg of sample for total RNA analysis, mass spectrometry still has room for improvement if it is to compete with the sensitivity of amplification-based technologies.
Another advantage of most genomics-based technologies is the high level of multiplexing available. Whether microarrays or RNA-Seq, large numbers of unique RNA sequences are amenable to analysis in any given experiment. In contrast, as noted earlier in this review, mass spectrometry approaches have more commonly been applied in a serial fashion (i.e., one RNA sequence at a time) and even in cases where multiplexing has been used (e.g., total census of modified nucleosides, CARD), there are still significant limitations on the upper number of RNA sequences that are amenable to analysis. The challenge in the standard RNA modification mapping approach is seen by simply calculating the expected number of RNase digestion products from any given group of RNA sequences. For example, a recent publication demonstrating the mapping of modifications onto the total tRNA pool from Lactococcus lactis required the analysis of > 250 RNase T1 digestion products that were detected during LC-MS/MS.117 Even then, multiple RNase digestions were required to obtain complete mapping coverage of the 40 unique tRNAs from this bacterium. Noting that the goal in mass spectrometry applications is the detection and characterization of digestion products containing modified nucleosides, such large numbers of RNase digestion products require improvements in chromatographic resolution and instrumental dynamic range. While true shotgun analysis of such digestion products has not yet been reported, the success of that approach within the field of proteomics118 provides one future opportunity for expanding sample complexity and multiplexing the analysis of RNA sequences for modifications.
Additional opportunities may arise by examining more powerful separation strategies such as 2D-HPLC or gas-phase separation via ion mobility. Again, learning from the field of proteomics, 2D-HPLC, wherein peptide mixtures are separated on 2 different (and ideally orthogonal) stationary phases, increases peak capacity and can improve peptide sequencing results yielding greater protein identifications.119 There is no inherent reason why a similar strategy could not also be used for RNase digestion mixtures, although additional research into stationary phases that yield orthogonal separations of smaller oligoribonucleotides would be beneficial. Similarly, ion mobility separations are another area whereby increases in sample complexity could be handled by new instrumentation and technology.
A challenge as significant looms within the top-down characterization strategy. As with proteomics, this strategy currently relies quite heavily on specialized high-end mass spectrometers or on specialized ion-ion/ion-molecule chemistry. For this approach to become more widely used in solving biological problems, methods are needed to improve the characterization of RNA mixtures – where a goal of characterizing the complete cellular mixture of RNAs could be foreseen in a manner similar to that reported in proteomics.120 Here, as with the bottom-up strategy, improvements in analyte separation prior to mass spectrometry will be key.
In closing, it is important to keep in mind the particular advantages and disadvantages of any analytical technique. For mass spectrometry as used in the field of RNA modifications, the advantages of this technique remain its ability to detect previously unknown modifications, its ability to detect a broad range of modifications within any single analysis, and its improving capabilities for readily mapping modifications onto RNA sequences. While challenges arising from the needs of biological analyses will continue to spur developments in the field, the continued refinement of analysis methods along with improving software for simplified data reduction and interpretation105 should increase the applicability of this tool for generating useful and desired information about RNA modification status.
Disclosure of Potential Conflicts of Interest
No potential conflicts of interest were disclosed.
Funding
The author's work in the area of mass spectrometry of modified RNAs is supported by the National Science Foundation (CHE1212625) and the National Institutes of Health (GM58843 and RR27671).
References
- 1. Agris PF. Decoding the genome: a modified view. Nucleic Acids Res 2004; 32:223-38; PMID:14715921; http://dx.doi.org/ 10.1093/nar/gkh185 [DOI] [PMC free article] [PubMed] [Google Scholar]
- 2. Cantara WA, Crain PF, Rozenski J, McCloskey JA, Harris KA, Zhang X, Vendeix FA, Fabris D, Agris PF. The RNA modification database, RNAMDB: 2011 update. Nucleic Acids Res 2011; 39:D195-201; PMID:21071406; http://dx.doi.org/ 10.1093/nar/gkq1028 [DOI] [PMC free article] [PubMed] [Google Scholar]
- 3. Giessing AMB, Kirpekar F. Mass spectrometry in the biology of RNA and its modifications. J Prot 2012; 75:3434-49; PMID:22348820; http://dx.doi.org/ 10.1016/j.jprot.2012.01.032 [DOI] [PubMed] [Google Scholar]
- 4. Hofstadler SA, Sannes-Lowery KA, Hannis JC. Analysis of nucleic acids by FTICR MS. Mass Spectrom Rev 2005; 24:265-85; PMID:15389854; http://dx.doi.org/ 10.1002/mas.20016 [DOI] [PubMed] [Google Scholar]
- 5. Limbach PA. Indirect mass spectrometric methods for characterizing and sequencing oligonucleotides. Mass Spectrom Rev 1996; 15:297-336; http://dx.doi.org/ 10.1002/(SICI)1098-2787(1996)15:5%3c297::AID-MAS2%3e3.0.CO;2-D [DOI] [PubMed] [Google Scholar]
- 6. Nordhoff E, Kirpekar F, Roepstorff P. Mass spectrometry of nucleic acids. Mass Spectrom Rev 1996; 15:67-138; http://dx.doi.org/ 10.1002/(SICI)1098-2787(1996)15:2%3c67::AID-MAS1%3e3.0.CO;2-8 [DOI] [PubMed] [Google Scholar]
- 7. McCloskey JA. Structural characterization of natural nucleosides by mass spectrometry. Acc Chem Res 1991; 24:81-8; http://dx.doi.org/ 10.1021/ar00003a004 [DOI] [Google Scholar]
- 8. McCloskey JA, Nishimura S. Modified nucleosides in transfer RNA. Acc Chem Res 1997; 10:403-410. http://dx.doi.org/ 10.1021/ar50119a004 [DOI] [Google Scholar]
- 9. Banoub JH, Newton RP, Esmans E, Ewing DF, Mackenzie G. Recent developments in mass spectrometry for the characterization of nucleosides, nucleotides, oligonucleotides, and nucleic acids. Chem Rev 2005; 105:1869-915; PMID:15884792; http://dx.doi.org/ 10.1021/cr030040w [DOI] [PubMed] [Google Scholar]
- 10. McCloskey J, Whitehill A, Rozenski J, Qiu F, Crain P. New techniques for the rapid characterization of oligonucleotides by mass spectrometry. Nucleosides & Nucleotides 1999; 18:1549-53; PMID:10474232; http://dx.doi.org/ 10.1080/07328319908044782 [DOI] [PubMed] [Google Scholar]
- 11. Machnicka MA, Milanowska K, Osman Oglou O, Purta E, Kurkowska M, Olchowik A, Januszewski W, Kalinowski S, Dunin-Horkawicz S, Rother KM, et al. MODOMICS: a database of RNA modification pathways–2013 update. Nucleic Acids Res 2013; 41:D262-7; PMID:23118484; http://dx.doi.org/ 10.1093/nar/gks1007 [DOI] [PMC free article] [PubMed] [Google Scholar]
- 12. Cantara WA, Crain PF, Rozenski J, McCloskey JA, Harris KA, Zhang X, Vendeix FA, Fabris D, Agris PF. The RNA modification database, RNAMDB: 2011 update. Nucleic Acids Res 2011; 39:D195-D201; PMID:21071406; http://dx.doi.org/ 10.1093/nar/gkq1028 [DOI] [PMC free article] [PubMed] [Google Scholar]
- 13. Krog JS, Espanol Y, Giessing AM, Dziergowska A, Malkiewicz A, de Pouplana LR, Kirpekar F. 3-(3-amino-3-carboxypropyl)-5,6-dihydrouridine is one of two novel post-transcriptional modifications in tRNALys(UUU) from Trypanosoma brucei. FEBS J 2011; 278:4782-96; PMID:22040320; http://dx.doi.org/ 10.1111/j.1742-4658.2011.08379.x [DOI] [PubMed] [Google Scholar]
- 14. Mandal D, Kohrer C, Su D, Russell SP, Krivos K, Castleberry CM, Blum P, Limbach PA, Soll D, RajBhandary UL. Agmatidine, a modified cytidine in the anticodon of archaeal tRNA(Ile), base pairs with adenosine but not with guanosine. Proc Natl Acad Sci U S A 2010; 107:2872-7; PMID:20133752; http://dx.doi.org/ 10.1073/pnas.0914869107 [DOI] [PMC free article] [PubMed] [Google Scholar]
- 15. Ikeuchi Y, Kimura S, Numata T, Nakamura D, Yokogawa T, Ogata T, Wada T, Suzuki T, Suzuki T. Agmatine-conjugated cytidine in a tRNA anticodon is essential for AUA decoding in archaea. Nat Chem Biol 2010; 6:277-282. http://dx.doi.org/ 10.1038/nchembio.323 [DOI] [PubMed] [Google Scholar]
- 16. Mandal D, Kohrer C, Su D, Babu IR, Chan CT, Liu Y, Soll D, Blum P, Kuwahara M, Dedon PC, et al. Identification and codon reading properties of 5-cyanomethyl uridine, a new modified nucleoside found in the anticodon wobble position of mutant haloarchaeal isoleucine tRNAs. RNA 2014; 20:177-88; PMID:24344322; http://dx.doi.org/ 10.1261/rna.042358.113 [DOI] [PMC free article] [PubMed] [Google Scholar]
- 17. Chen P, Crain PF, Näsvall SJ, Pomerantz SC, Björk GR. A 'gain of function' mutation in a protein mediates production of novel modified nucleosides. EMBO J 2005; 24:1842-51; PMID:15861125; http://dx.doi.org/ 10.1038/sj.emboj.7600666 [DOI] [PMC free article] [PubMed] [Google Scholar]
- 18. Dumelin CE, Chen Y, Leconte AM, Chen YG, Liu DR. Discovery and biological characterization of geranylated RNA in bacteria. Nat Chem Biol 2012; 8:913-9; PMID:22983156 [DOI] [PMC free article] [PubMed] [Google Scholar]
- 19. Helm M, Alfonzo JD. Posttranscriptional RNA Modifications: Playing metabolic games in a cell's chemical legoland. Chem Biol 2014; 21:174-85; PMID:24315934; http://dx.doi.org/ 10.1016/j.chembiol.2013.10.015 [DOI] [PMC free article] [PubMed] [Google Scholar]
- 20. Miyauchi K, Kimura S, Suzuki T. A cyclic form of N6-threonylcarbamoyladenosine as a widely distributed tRNA hypermodification. Nat Chem Biol 2013; 9:105-11; PMID:23242255; http://dx.doi.org/ 10.1038/nchembio.1137 [DOI] [PubMed] [Google Scholar]
- 21. Chan CT, Dyavaiah M, DeMott MS, Taghizadeh K, Dedon PC, Begley TJ. A quantitative systems approach reveals dynamic control of tRNA modifications during cellular stress. PLoS Genet 2010; 6:e1001247; PMID:21187895; http://dx.doi.org/ 10.1371/journal.pgen.1001247 [DOI] [PMC free article] [PubMed] [Google Scholar]
- 22. Su D, Chan CTY, Gu C, Lim KS, Chionh YH, McBee ME, Russell BS, Babu IR, Begley TJ, Dedon PC. Quantitative analysis of ribonucleoside modifications in tRNA by HPLC-coupled mass spectrometry. Nat Protoc 2014; 9:828-41; http://dx.doi.org/ 10.1038/nprot.2014.047 [DOI] [PMC free article] [PubMed] [Google Scholar]
- 23. Dedon PC, Begley TJ. A system of RNA modifications and biased codon use controls cellular stress response at the level of translation. Chem Res Toxicol 2014; 27:330-7; PMID:24422464; http://dx.doi.org/ 10.1021/tx400438d [DOI] [PMC free article] [PubMed] [Google Scholar]
- 24. Dalluge JJ, Hashizume T, McCloskey JA. Quantitative measurement of dihydrouridine in RNA using isotope dilution liquid chromatography-mass spectrometry (LC/MS). Nucleic Acids Res 1996; 24:3242-5; PMID:8774907; http://dx.doi.org/ 10.1093/nar/24.16.3242 [DOI] [PMC free article] [PubMed] [Google Scholar]
- 25. Brandmayr C, Wagner M, Bruckl T, Globisch D, Pearson D, Kneuttinger AC, Reiter V, Hienzsch A, Koch S, Thoma I, et al. Isotope-based analysis of modified tRNA nucleosides correlates modification density with translational efficiency. Angewandte Chemie 2012; 51:11162-5; PMID:23037940; http://dx.doi.org/ 10.1002/anie.201203769 [DOI] [PMC free article] [PubMed] [Google Scholar]
- 26. Kellner S, Neumann J, Rosenkranz D, Lebedeva S, Ketting RF, Zischler H, Schneider D, Helm M. Profiling of RNA modifications by multiplexed stable isotope labelling. Chem Commun 2014; 50:3516-8; PMID:24567952; http://dx.doi.org/ 10.1039/c3cc49114e [DOI] [PubMed] [Google Scholar]
- 27. Frickenschmidt A, Fröhlich H, Bullinger D, Zell A, Laufer S, Gleiter CH, Liebich H, Kammerer B. Metabonomics in cancer diagnosis: mass spectrometry-based profiling of urinary nucleosides from breast cancer patients. Biomarkers 2008; 13:435-49; PMID:18484357; http://dx.doi.org/ 10.1080/13547500802012858 [DOI] [PubMed] [Google Scholar]
- 28. Quinn R, Basanta-Sanchez M, Rose RE, Fabris D. Direct infusion analysis of nucleotide mixtures of very similar or identical elemental composition. J Mass Spectrom 2013; 48:703-12; PMID:23722961; http://dx.doi.org/ 10.1002/jms.3207 [DOI] [PMC free article] [PubMed] [Google Scholar]
- 29. Covey TR, Bonner RF, Shushan BI, Henion J. The determination of protein, oligonucleotide and peptide molecular weights by ion-spray mass spectrometry. Rapid Commun Mass Spectrom 1988; 2:249-56; PMID:2577836; http://dx.doi.org/ 10.1002/rcm.1290021111 [DOI] [PubMed] [Google Scholar]
- 30. Stults JT, Marsters JC, Carr SA. Improved Electrospray Ionization of Synthetic Oligodeoxynucleotides. Rapid Commun Mass Spectrom 1991; 5:359-63; http://dx.doi.org/ 10.1002/rcm.1290050806 [DOI] [Google Scholar]
- 31. Okafo G, Elder D, Webb M, eds. Analysis of oligonucleotides and their related substances. Hertfortshire, UK: ILM Publications, 2013. [Google Scholar]
- 32. Kullolli M, Knouf E, Arampatzidou M, Tewari M, Pitteri SJ. Intact MicroRNA analysis using high resolution mass spectrometry. J Am Soc Mass Spectrom 2014; 25:80-7; PMID:24174127; http://dx.doi.org/ 10.1007/s13361-013-0759-x [DOI] [PMC free article] [PubMed] [Google Scholar]
- 33. Beverly MB. Applications of mass spectrometry to the study of siRNA. Mass Spectrom Rev 2010; PMID:20201110 [DOI] [PubMed] [Google Scholar]
- 34. Bonilla J, Srivatsa G, eds. Handbook of Analysis of Oligonucleotides and Related Products. Boca Raton, FL USA: CRC Press, 2011. [Google Scholar]
- 35. Banoub JH, Limbach PA, eds. Mass Spectrometry of Nucleosides and Nucleic Acids. Boca Raton, FL USA: CRC Press, 2010. [Google Scholar]
- 36. Sanger F, Brownlee GG, Barrell BG. A two-dimensional fractionation procedure for radioactive nucleotides. J Mol Biol 1965; 13:373-98; PMID:5325727; http://dx.doi.org/ 10.1016/S0022-2836(65)80104-8 [DOI] [PubMed] [Google Scholar]
- 37. Kowalak JA, Pomerantz SC, Crain PF, McCloskey JA. A novel method for the determination of post-transcriptional modification in RNA by mass spectrometry. Nucl Acids Res 1993; 21:4577-85; PMID:8233793; http://dx.doi.org/ 10.1093/nar/21.19.4577 [DOI] [PMC free article] [PubMed] [Google Scholar]
- 38. Douthwaite S, Kirpekar F. Identifying modifications in RNA by MALDI mass spectrometry. Methods Enzymol 2007; 425:3-20; PMID:17673077 [DOI] [PubMed] [Google Scholar]
- 39. Guymon R, Pomerantz SC, Crain PF, McCloskey JA. Influence of phylogeny on posttranscriptional modification of rRNA in thermophilic prokaryotes: the complete modification map of 16S rRNA of Thermus thermophilus. Biochemistry 2006; 45:4888-99; PMID:16605256; http://dx.doi.org/ 10.1021/bi052579p [DOI] [PubMed] [Google Scholar]
- 40. Guymon R, Pomerantz SC, Ison JN, Crain PF, McCloskey JA. Post-transcriptional modifications in the small subunit ribosomal RNA from Thermotoga maritima, including presence of a novel modified cytidine. RNA 2007; 13:396-403; PMID:17255199; http://dx.doi.org/ 10.1261/rna.361607 [DOI] [PMC free article] [PubMed] [Google Scholar]
- 41. Schürch S, Bernal-Méndez E, Leumann CJ. Electrospray tandem mass spectrometry of mixed-sequence RNA/DNA oligonucleotides. J Am Soc Mass Spectrom 2002; 13:936-45; PMID:12216734; http://dx.doi.org/ 10.1016/S1044-0305(02)00413-0 [DOI] [PubMed] [Google Scholar]
- 42. Tromp JM, Schürch S. Gas-phase dissociation of oligoribonucleotides and their analogs studied by electrospray ionization tandem mass spectrometry. J Am Soc Mass Spectrom 2005; 16:1262-8; PMID:15978835; http://dx.doi.org/ 10.1016/j.jasms.2005.03.024 [DOI] [PubMed] [Google Scholar]
- 43. Monn STM, Schürch S. New aspects of the fragmentation mechanisms of unmodified and methylphosphonate-modified oligonucleotides. J Am Soc Mass Spectrom 2007; 18:984-90; PMID:17383194; http://dx.doi.org/ 10.1016/j.jasms.2007.02.006 [DOI] [PubMed] [Google Scholar]
- 44. Nyakas A, Stucki SR, Schürch S. Tandem mass spectrometry of modified and platinated oligoribonucleotides. J Am Soc Mass Spectrom 2011; 22:875-87; PMID:21472522; http://dx.doi.org/ 10.1007/s13361-011-0106-z [DOI] [PubMed] [Google Scholar]
- 45. Steyaert J. A decade of protein engineering on ribonuclease T1. Atomic dissection of the enzyme-substrate interactions. Eur J Biochem 1997; 247:1-11; PMID:9249002; http://dx.doi.org/ 10.1111/j.1432-1033.1997.t01-1-00001.x [DOI] [PubMed] [Google Scholar]
- 46. Zallot R, Brochier-Armanet C, Gaston KW, Forouhar F, Limbach PA, Hunt JF, de Crecy-Lagard V. Plant, Animal, and Fungal Micronutrient Queuosine Is Salvaged by Members of the DUF2419 Protein Family. ACS Chem Biol 2014; 9:1812-1825. doi: 10.1021/cb500278k [DOI] [PMC free article] [PubMed] [Google Scholar]
- 47. Huang TY, Kharlamova A, Liu J, McLuckey SA. Ion trap collision-induced dissociation of multiply deprotonated RNA: c/y-ions versus (a-B)/w-ions. J Am Soc Mass Spectrom 2008; 19:1832-40; PMID:18799321; http://dx.doi.org/ 10.1016/j.jasms.2008.08.009 [DOI] [PubMed] [Google Scholar]
- 48. Wu J, McLuckey SA. Gas-phase fragmentation of oligonucleotide ions. Int J Mass Spectrom 2004; 237:197-241; http://dx.doi.org/ 10.1016/j.ijms.2004.06.014 [DOI] [Google Scholar]
- 49. Suzuki T. Chaplet column chromatography: isolation of a large set of individual RNAs in a single step. Methods Enzymol 2007; 425:231-9; PMID:17673086; http://dx.doi.org/ 10.1016/S0076-6879(07)25010-4 [DOI] [PubMed] [Google Scholar]
- 50. Suzuki T, Suzuki T. A complete landscape of post-transcriptional modifications in mammalian mitochondrial tRNAs. Nucleic Acids Res 2014; 42:7346-57; PMID:24831542; http://dx.doi.org/ 10.1093/nar/gku390 [DOI] [PMC free article] [PubMed] [Google Scholar]
- 51. Kowalak JA, Bruenger E, Crain PF, McCloskey JA. Identities and phylogenetic comparisons of posttranscriptional modifications in 16 S ribosomal RNA from Haloferax volcanii. J Biol Chem 2000; 275:24484-9; PMID:10818097; http://dx.doi.org/ 10.1074/jbc.M002153200 [DOI] [PubMed] [Google Scholar]
- 52. Emmerechts G, Barbé S, Herdewijn P, Anné J, Rozenski J. Post-transcriptional modification mapping in the Clostridium acetobutylicum 16S rRNA by mass spectrometry and reverse transcriptase assays. Nucleic Acids Res 2007; 35:3494-503; PMID:17478509; http://dx.doi.org/ 10.1093/nar/gkm248 [DOI] [PMC free article] [PubMed] [Google Scholar]
- 53. Emmerechts G, Maes L, Herdewijn P, Anné J, Rozenski J. Characterization of the posttranscriptional modifications in Legionella pneumophila small-subunit ribosomal RNA. Chem Biodivers 2008; 5:2640-53; PMID:19089822; http://dx.doi.org/ 10.1002/cbdv.200890218 [DOI] [PubMed] [Google Scholar]
- 54. Hansen MA, Kirpekar F, Ritterbusch W, Vester B. Posttranscriptional modifications in the A-loop of 23S rRNAs from selected archaea and eubacteria. RNA 2002; 8:202-13; PMID:11911366; http://dx.doi.org/ 10.1017/S1355838202013365 [DOI] [PMC free article] [PubMed] [Google Scholar]
- 55. Mengel-Jørgensen J, Jensen SS, Rasmussen A, Poehlsgaard J, Iversen JJL, Kirpekar F. Modifications in thermus thermophilus 23 S ribosomal RNA are centered in regions of RNA-RNA contact. J Biol Chem 2006; 281:22108-17; PMID:16731530; http://dx.doi.org/ 10.1074/jbc.M600377200 [DOI] [PubMed] [Google Scholar]
- 56. Kirpekar F, Hansen LH, Rasmussen A, Poehlsgaard J, Vester B. The archaeon Haloarcula marismortui has few modifications in the central parts of its 23S ribosomal RNA. J Mol Biol 2005; 348:563-73; PMID:15826654; http://dx.doi.org/ 10.1016/j.jmb.2005.03.009 [DOI] [PubMed] [Google Scholar]
- 57. Kirpekar F, Douthwaite S, Roepstorff P. Mapping posttranscriptional modifications in 5S ribosomal RNA by MALDI mass spectrometry. RNA 2000; 6:296-306; PMID:10688367; http://dx.doi.org/ 10.1017/S1355838200992148 [DOI] [PMC free article] [PubMed] [Google Scholar]
- 58. McCloskey JA, Rozenski J. The small subunit rRNA modification database. Nucleic Acids Res 2005; 33:D135-8; PMID:15608163; http://dx.doi.org/ 10.1093/nar/gki015 [DOI] [PMC free article] [PubMed] [Google Scholar]
- 59. Goll MG, Kirpekar F, Maggert KA, Yoder JA, Hsieh CL, Zhang X, Golic KG, Jacobsen SE, Bestor TH. Methylation of tRNAAsp by the DNA methyltransferase homolog Dnmt2. Science 2006; 311:395-8; PMID:16424344; http://dx.doi.org/ 10.1126/science.1120976 [DOI] [PubMed] [Google Scholar]
- 60. Tovy A, Siman Tov R, Gaentzsch R, Helm M, Ankri S. A new nuclear function of the Entamoeba histolytica glycolytic enzyme enolase: the metabolic regulation of cytosine-5 methyltransferase 2 (Dnmt2) activity. PLoS Pathog 2010; 6:e1000775; PMID:20174608; http://dx.doi.org/ 10.1371/journal.ppat.1000775 [DOI] [PMC free article] [PubMed] [Google Scholar]
- 61. Becker M, Muller S, Nellen W, Jurkowski TP, Jeltsch A, Ehrenhofer-Murray AE. Pmt1, a Dnmt2 homolog in Schizosaccharomyces pombe, mediates tRNA methylation in response to nutrient signaling. Nucl Acids Res 2012; 40:11648-58; PMID:23074192; http://dx.doi.org/ 10.1093/nar/gks956 [DOI] [PMC free article] [PubMed] [Google Scholar]
- 62. Muller S, Windhof IM, Maximov V, Jurkowski T, Jeltsch A, Forstner KU, Sharma CM, Graf R, Nellen W. Target recognition, RNA methylation activity and transcriptional regulation of the Dictyostelium discoideum Dnmt2-homologue (DnmA). Nucl Acids Res 2013; 41:8615-27; PMID:23877245; http://dx.doi.org/ 10.1093/nar/gkt634 [DOI] [PMC free article] [PubMed] [Google Scholar]
- 63. Shanmugam R, Aklujkar M, Schafer M, Reinhardt R, Nickel O, Reuter G, Lovley DR, Ehrenhofer-Murray A, Nellen W, Ankri S, et al. The Dnmt2 RNA methyltransferase homolog of Geobacter sulfurreducens specifically methylates tRNA-Glu. Nucl Acids Res 2014; 42:6487-96; PMID:24711368; http://dx.doi.org/ 10.1093/nar/gku256 [DOI] [PMC free article] [PubMed] [Google Scholar]
- 64. Addepalli B, Limbach PA. Mass spectrometry-based quantification of pseudouridine in RNA. J Am Soc Mass Spectrom 2011; 22:1363-72; PMID:21953190; http://dx.doi.org/ 10.1007/s13361-011-0137-5 [DOI] [PMC free article] [PubMed] [Google Scholar]
- 65. Durairaj A, Limbach PA. Mass spectrometry of the fifth nucleoside: A review of the identification of pseudouridine in nucleic acids. Anal Chim Acta 2008; 623:117-25; PMID:18620915; http://dx.doi.org/ 10.1016/j.aca.2008.06.027 [DOI] [PMC free article] [PubMed] [Google Scholar]
- 66. Durairaj A, Limbach PA. Improving CMC-derivatization of pseudouridine in RNA for mass spectrometric detection. Anal Chim Acta 2008; 612:173-81; PMID:18358863; http://dx.doi.org/ 10.1016/j.aca.2008.02.026 [DOI] [PMC free article] [PubMed] [Google Scholar]
- 67. Pomerantz SC, McCloskey JA. Detection of the common RNA nucleoside pseudouridine in mixtures of oligonucleotides by mass spectrometry. Anal Chem 2005; 77:4687-97; PMID:16053277; http://dx.doi.org/ 10.1021/ac058023p [DOI] [PubMed] [Google Scholar]
- 68. Taucher M, Ganisl B, Breuker K. Identification, localization, and relative quantitation of pseudouridine in RNA by tandem mass spectrometry of hydrolysis products. Int J Mass Spectrom 2011; 304:91-7; PMID:21960742; http://dx.doi.org/ 10.1016/j.ijms.2010.05.024 [DOI] [PMC free article] [PubMed] [Google Scholar]
- 69. Mengel-Jørgensen J, Kirpekar F. Detection of pseudouridine and other modifications in tRNA by cyanoethylation and MALDI mass spectrometry. Nucleic Acids Res 2002; 30:e135; PMID:12466567; http://dx.doi.org/ 10.1093/nar/gnf135 [DOI] [PMC free article] [PubMed] [Google Scholar]
- 70. Emmerechts G, Herdewijn P, Rozenski J. Pseudouridine detection improvement by derivatization with methyl vinyl sulfone and capillary HPLC–mass spectrometry. J Chromatogr B 2005; 825:233-8; http://dx.doi.org/ 10.1016/j.jchromb.2005.06.041 [DOI] [PubMed] [Google Scholar]
- 71. Wagner TM, Nair V, Guymon R, Pomerantz SC, Crain PF, Davis DR, McCloskey JA. A novel method for sequence placement of modified nucleotides in mixtures of transfer RNA. Nucleic Acids Symp Ser 2004; 48:263-4; http://dx.doi.org/ 10.1093/nass/48.1.263 [DOI] [PubMed] [Google Scholar]
- 72. Hossain M, Limbach PA. Mass spectrometry-based detection of transfer RNAs by their signature endonuclease digestion products. RNA 2007; 13:295-303; PMID:17194720; http://dx.doi.org/ 10.1261/rna.272507 [DOI] [PMC free article] [PubMed] [Google Scholar]
- 73. Hossain M, Limbach PA. Multiple endonucleases improve MALDI-MS signature digestion product detection of bacterial transfer RNAs. Anal Bioanal Chem 2009; 394:1125-35; PMID:19104781; http://dx.doi.org/ 10.1007/s00216-008-2562-2 [DOI] [PubMed] [Google Scholar]
- 74. Wetzel C, Limbach PA. The global identification of tRNA isoacceptors by targeted tandem mass spectrometry. The Analyst 2013; 138:6063-72; PMID:23954863; http://dx.doi.org/ 10.1039/c3an01224g [DOI] [PubMed] [Google Scholar]
- 75. Berhane BT, Limbach PA. Stable isotope labeling for matrix-assisted laser desorption/ionization mass spectrometry and post-source decay analysis of ribonucleic acids. J Mass Spectrom 2003; 38:872-8; PMID:12938108; http://dx.doi.org/ 10.1002/jms.504 [DOI] [PubMed] [Google Scholar]
- 76. Meng Z, Limbach PA. Quantitation of ribonucleic acids using 18O labeling and mass spectrometry. Anal Chem 2005; 77:1891-5; PMID:15762601; http://dx.doi.org/ 10.1021/ac048801y [DOI] [PubMed] [Google Scholar]
- 77. Castleberry CM, Limbach PA. Relative quantitation of transfer RNAs using liquid chromatography mass spectrometry and signature digestion products. Nucleic Acids Res 2010; 38:e162; PMID:20587503; http://dx.doi.org/ 10.1093/nar/gkq578 [DOI] [PMC free article] [PubMed] [Google Scholar]
- 78. Li S, Limbach PA. Method for comparative analysis of ribonucleic acids using isotope labeling and mass spectrometry. Anal Chem 2012; 84:8607-13; PMID:22985222; http://dx.doi.org/ 10.1021/ac301638c [DOI] [PubMed] [Google Scholar]
- 79. Li S, Limbach PA. Mass spectrometry sequencing of transfer ribonucleic acids by the comparative analysis of RNA digests (CARD) approach. The Analyst 2013; 138:1386-94; PMID:23295341; http://dx.doi.org/ 10.1039/c2an36515d [DOI] [PubMed] [Google Scholar]
- 80. Waghmare SP, Dickman MJ. Characterization and quantification of RNA post-transcriptional modifications using stable isotope labeling of RNA in conjunction with mass spectrometry analysis. Anal Chem 2011; 83:4894-901; PMID:21539333; http://dx.doi.org/ 10.1021/ac200547y [DOI] [PubMed] [Google Scholar]
- 81. Popova AM, Williamson JR. Quantitative analysis of rRNA modifications using stable isotope labeling and mass spectrometry. J Am Chem Soc 2014; 136:2058-69; PMID:24422502; http://dx.doi.org/ 10.1021/ja412084b [DOI] [PMC free article] [PubMed] [Google Scholar]
- 82. Yu B, Yang Z, Li J, Minakhina S, Yang M, Padgett RW, Steward R, Chen X. Methylation as a crucial step in plant microRNA biogenesis. Science 2005; 307:932-5; PMID:15705854; http://dx.doi.org/ 10.1126/science.1107130 [DOI] [PMC free article] [PubMed] [Google Scholar]
- 83. Horwich MD, Li C, Matranga C, Vagin V, Farley G, Wang P, Zamore PD. The Drosophila RNA methyltransferase, DmHen1, modifies germline piRNAs and single-stranded siRNAs in RISC. Curr Biol 2007; 17:1265-72; PMID:17604629; http://dx.doi.org/ 10.1016/j.cub.2007.06.030 [DOI] [PubMed] [Google Scholar]
- 84. Kirino Y, Mourelatos Z. The mouse homolog of HEN1 is a potential methylase for Piwi-interacting RNAs. RNA 2007; 13:1397-401; PMID:17652135; http://dx.doi.org/ 10.1261/rna.659307 [DOI] [PMC free article] [PubMed] [Google Scholar]
- 85. Huang TY, Liu J, McLuckey SA. Top-down tandem mass spectrometry of tRNA via ion trap collision-induced dissociation. J Am Soc Mass Spectrom 2010; 21:890-8; PMID:20080046; http://dx.doi.org/ 10.1016/j.jasms.2009.12.007 [DOI] [PubMed] [Google Scholar]
- 86. Taucher M, Breuker K. Characterization of modified RNA by top-down mass spectrometry. Angewandte Chemie 2012; 51:11289-92; PMID:23042528; http://dx.doi.org/ 10.1002/anie.201206232 [DOI] [PMC free article] [PubMed] [Google Scholar]
- 87. Buck M, Connick M, Ames BN. Complete analysis of tRNA-modified nucleosides by high-performance liquid chromatography: The 29 modified nucleosides of Salmonella typhimurium and Escherichia coli tRNA. Anal Biochem 1983; 129:1-13; PMID:6190418; http://dx.doi.org/ 10.1016/0003-2697(83)90044-1 [DOI] [PubMed] [Google Scholar]
- 88. Pomerantz SC, McCloskey JA. Analysis of RNA hydrolyzates by liquid chromatography-mass spectrometry. Methods Enzymol 1990; 193:796-824; PMID:1706064; http://dx.doi.org/ 10.1016/0076-6879(90)93452-Q [DOI] [PubMed] [Google Scholar]
- 89. Tuytten R, Lemière F, Van Dongen W, Witters E, Esmans EL, Newton RP, Dudley E. Development of an On-Line SPE-LC–ESI-MS Method for Urinary Nucleosides: Hyphenation of Aprotic Boronic Acid Chromatography with Hydrophilic Interaction LC–ESI-MS. Anal Chem 2008; 80:1263-71; PMID:18198895; http://dx.doi.org/ 10.1021/ac702057u [DOI] [PubMed] [Google Scholar]
- 90. Philibert GS, Olesik SV. Characterization of enhanced-fluidity liquid hydrophilic interaction chromatography for the separation of nucleosides and nucleotides. J Chromatogr A 2011; 1218:8222-30; PMID:21974894; http://dx.doi.org/ 10.1016/j.chroma.2011.09.037 [DOI] [PubMed] [Google Scholar]
- 91. Qiu H, Wanigasekara E, Zhang Y, Tran T, Armstrong DW. Development and evaluation of new zwitterionic Hydrophilic interaction liquid chromatography stationary phases based on 3-P,P-diphenylphosphonium-propylsulfonate. J Chromatogr A 2011; 1218:8075-82; PMID:21963182; http://dx.doi.org/ 10.1016/j.chroma.2011.09.016 [DOI] [PubMed] [Google Scholar]
- 92. Rodríguez-Gonzalo E, García-Gómez D, Carabias-Martínez R. Study of retention behaviour and mass spectrometry compatibility in zwitterionic hydrophilic interaction chromatography for the separation of modified nucleosides and nucleobases. J Chromatogr A 2011; 1218:3994-4001; http://dx.doi.org/ 10.1016/j.chroma.2011.05.003 [DOI] [PubMed] [Google Scholar]
- 93. Laourdakis CD, Merino EF, Neilson AP, Cassera MB. Comprehensive quantitative analysis of purines and pyrimidines in the human malaria parasite using ion-pairing ultra-performance liquid chromatography–mass spectrometry. J Chromatogr B 2014; 967:127-33; http://dx.doi.org/ 10.1016/j.jchromb.2014.07.012 [DOI] [PMC free article] [PubMed] [Google Scholar]
- 94. Machon C, Jordheim L, Puy J-Y, Lefebvre I, Dumontet C, Guitton J. Fully validated assay for the quantification of endogenous nucleoside mono- and triphosphates using online extraction coupled with liquid chromatography–tandem mass spectrometry. Anal Bioanal Chem 2014; 406:2925-41; PMID:24633509; http://dx.doi.org/ 10.1007/s00216-014-7711-1 [DOI] [PubMed] [Google Scholar]
- 95. Apffel A, Chakel JA, Fischer S, Lichtenwalter K, Hancock WS. Analysis of oligonucleotides by HPLC−Electrospray Ionization Mass Spectrometry. Anal Chem 1997; 69:1320-5; PMID:21639339; http://dx.doi.org/ 10.1021/ac960916h [DOI] [PubMed] [Google Scholar]
- 96. Apffel A, Chakel JA, Fischer S, Lichtenwalter K, Hancock WS. New procedure for the use of high-performance liquid chromatography-electrospray ionization mass spectrometry for the analysis of nucleotides and oligonucleotides. J Chromatogr A 1997; 777:3-21; http://dx.doi.org/ 10.1016/S0021-9673(97)00256-2 [DOI] [Google Scholar]
- 97. Gong L, McCullagh JSO. Analysis of oligonucleotides by hydrophilic interaction liquid chromatography coupled to negative ion electrospray ionization mass spectrometry. J Chromatogr A 2011; 1218:5480-6; PMID:21741051; http://dx.doi.org/ 10.1016/j.chroma.2011.06.044 [DOI] [PubMed] [Google Scholar]
- 98. Li Q, Lynen F, Wang J, Li H, Xu G, Sandra P. Comprehensive hydrophilic interaction and ion-pair reversed-phase liquid chromatography for analysis of di- to deca-oligonucleotides. J Chromatogr A 2012; 1255:237-43; PMID:22204934; http://dx.doi.org/ 10.1016/j.chroma.2011.11.062 [DOI] [PubMed] [Google Scholar]
- 99. Easter RN, Kroning KK, Caruso JA, Limbach PA. Separation and identification of oligonucleotides by hydrophilic interaction liquid chromatography (HILIC)-inductively coupled plasma mass spectrometry (ICPMS). Analyst 2010; 135:2560-5; PMID:20830328; http://dx.doi.org/ 10.1039/c0an00399a [DOI] [PMC free article] [PubMed] [Google Scholar]
- 100. Castleberry CM, Rodicio LP, Limbach PA. Electrospray ionization mass spectrometry of oligonucleotides. Curr Protoc Nucleic Acid Chem 2008; Chapter 10:Unit 10 2; PMID:19085982 [DOI] [PubMed] [Google Scholar]
- 101. Dudley E, Bond L. Mass spectrometry analysis of nucleosides and nucleotides. Mass Spectrom Rev 2014; 33:302-31; PMID:24285362; http://dx.doi.org/ 10.1002/mas.21388 [DOI] [PubMed] [Google Scholar]
- 102. Forcisi S, Moritz F, Kanawati B, Tziotis D, Lehmann R, Schmitt-Kopplin P. Liquid chromatography–mass spectrometry in metabolomics research: Mass analyzers in ultra high pressure liquid chromatography coupling. J Chromatogr A 2013; 1292:51-65; PMID:23631876; http://dx.doi.org/ 10.1016/j.chroma.2013.04.017 [DOI] [PubMed] [Google Scholar]
- 103. Piekna-Przybylska D, Decatur WA, Fournier MJ. The 3D rRNA modification maps database: with interactive tools for ribosome analysis. Nucleic Acids Res 2008; 36:D178-D83; PMID:17947322; http://dx.doi.org/ 10.1093/nar/gkm855 [DOI] [PMC free article] [PubMed] [Google Scholar]
- 104. Jühling F, Mörl M, Hartmann RK, Sprinzl M, Stadler PF, Pütz J. tRNAdb 2009: compilation of tRNA sequences and tRNA genes. Nucleic Acids Res 2009; 37:D159-D62; PMID:18957446; http://dx.doi.org/ 10.1093/nar/gkn772 [DOI] [PMC free article] [PubMed] [Google Scholar]
- 105. Nakayama H, Takahashi N, Isobe T. Informatics for mass spectrometry-based RNA analysis. Mass Spectrom Rev 2011; 30:1000-12; PMID:21328601; http://dx.doi.org/ 10.1002/mas.20325 [DOI] [PubMed] [Google Scholar]
- 106. Matthiesen R, Kirpekar F. Identification of RNA molecules by specific enzyme digestion and mass spectrometry: software for and implementation of RNA mass mapping. Nucleic Acids Res 2009; 37:e48; PMID:19264806; http://dx.doi.org/ 10.1093/nar/gkp139 [DOI] [PMC free article] [PubMed] [Google Scholar]
- 107. Nakayama H, Akiyama M, Taoka M, Yamauchi Y, Nobe Y, Ishikawa H, Takahashi N, Isobe T. Ariadne: a database search engine for identification and chemical analysis of RNA using tandem mass spectrometry data. Nucleic Acids Res 2009; 37:e47-e; PMID:19270066; http://dx.doi.org/ 10.1093/nar/gkp099 [DOI] [PMC free article] [PubMed] [Google Scholar]
- 108. Kapp EA, Schütz F, Connolly LM, Chakel JA, Meza JE, Miller CA, Fenyo D, Eng JK, Adkins JN, Omenn GS, et al. An evaluation, comparison, and accurate benchmarking of several publicly available MS/MS search algorithms: sensitivity and specificity analysis. Proteomics 2005; 5:3475-90; PMID:16047398; http://dx.doi.org/ 10.1002/pmic.200500126 [DOI] [PubMed] [Google Scholar]
- 109. Nyakas A, Blum LC, Stucki SR, Reymond J-L, Schürch S. OMA and OPA—Software-Supported Mass Spectra Analysis of Native and Modified Nucleic Acids. J Am Soc Mass Spectrom 2013; 24:249-56; PMID:23264149; http://dx.doi.org/ 10.1007/s13361-012-0529-1 [DOI] [PubMed] [Google Scholar]
- 110. Sample PJ, Gaston KW, Alfonzo JD, Limbach PA. RoboOligo: Software for Mass Spectrometry Data to Support Manual and De Novo Sequencing of Post-transcriptionally Modified Ribonucleic Acids. 2015; manuscript under review [DOI] [PMC free article] [PubMed] [Google Scholar]
- 111. McKinlay A, Gerard W, Fields S. Global analysis of RNA oxidation in Saccharomyces cerevisiae. BioTechniques 2012; 52:109-11; PMID:22313409; http://dx.doi.org/ 10.2144/000113801 [DOI] [PMC free article] [PubMed] [Google Scholar]
- 112. Motorin Y, Lyko F, Helm M. 5-methylcytosine in RNA: Detection, enzymatic formation and biological functions. Nucleic Acids Res 2010; 38:1415-30; PMID:20007150; http://dx.doi.org/ 10.1093/nar/gkp1117 [DOI] [PMC free article] [PubMed] [Google Scholar]
- 113. Song CX, Yi C, He C. Mapping recently identified nucleotide variants in the genome and transcriptome. Nat Biotechnol 2012; 30:1107-16; PMID:23138310; http://dx.doi.org/ 10.1038/nbt.2398 [DOI] [PMC free article] [PubMed] [Google Scholar]
- 114. Schaefer M, Pollex T, Hanna K, Lyko F. RNA cytosine methylation analysis by bisulfite sequencing. Nucleic Acids Res 2009; 37:e12. doi: 10.1093/nar/gkn954 [DOI] [PMC free article] [PubMed] [Google Scholar]
- 115. Cattenoz PB, Taft RJ, Westhof E, Mattick JS. Transcriptome-wide identification of A >i RNA editing sites by inosine specific cleavage. RNA 2013; 19:257-70; PMID:23264566; http://dx.doi.org/ 10.1261/rna.036202.112 [DOI] [PMC free article] [PubMed] [Google Scholar]
- 116. Tomikawa C, Ohira T, Inoue Y, Kawamura T, Yamagishi A, Suzuki T, Hori H. Distinct tRNA modifications in the thermo-acidophilic archaeon, Thermoplasma acidophilum. FEBS Lett 2013; 587:3575-80; PMID:24076028; http://dx.doi.org/ 10.1016/j.febslet.2013.09.021 [DOI] [PubMed] [Google Scholar]
- 117.Puri P, Wetzel C, Saffert P, Gaston KW, Russell SP, Varela JAC, van der Vlies P, Zhang G, Limbach PA, Ignatova Z, Poolman B. Systematic identification of tRNAome and its dynamics in Lactococcus lactis. Molecular Microbiology 2014; 93:944-956. doi: 10.1111/mmi.12710 [DOI] [PMC free article] [PubMed] [Google Scholar]
- 118. Zhang Y, Fonslow BR, Shan B, Baek M-C, Yates JR. Protein analysis by shotgun/bottom-up proteomics. Chem Rev 2013; 113:2343-94; PMID:23438204; http://dx.doi.org/ 10.1021/cr3003533 [DOI] [PMC free article] [PubMed] [Google Scholar]
- 119. McQueen P, Krokhin O. Optimal selection of 2D reversed-phase–reversed-phase HPLC separation techniques in bottom-up proteomics. Expert Rev Proteomics 2012; 9:125-8; PMID:22462784; http://dx.doi.org/ 10.1586/epr.12.8 [DOI] [PubMed] [Google Scholar]
- 120. Catherman AD, Durbin KR, Ahlf DR, Early BP, Fellers RT, Tran JC, Thomas PM, Kelleher NL. Large-scale Top-down Proteomics of the Human Proteome: Membrane Proteins, Mitochondria, and Senescence. Mol Cell Proteomics 2013; 12:3465-73; PMID:24023390; http://dx.doi.org/ 10.1074/mcp.M113.030114 [DOI] [PMC free article] [PubMed] [Google Scholar]
- 121. Wetzel C, Li S, Limbach PA. Metabolic de-isotoping for improved LC-MS characterization of modified RNAs. J Am Soc Mass Spectrom 2014; 25:1114-23; PMID:24760295; http://dx.doi.org/ 10.1007/s13361-014-0889-9 [DOI] [PubMed] [Google Scholar]