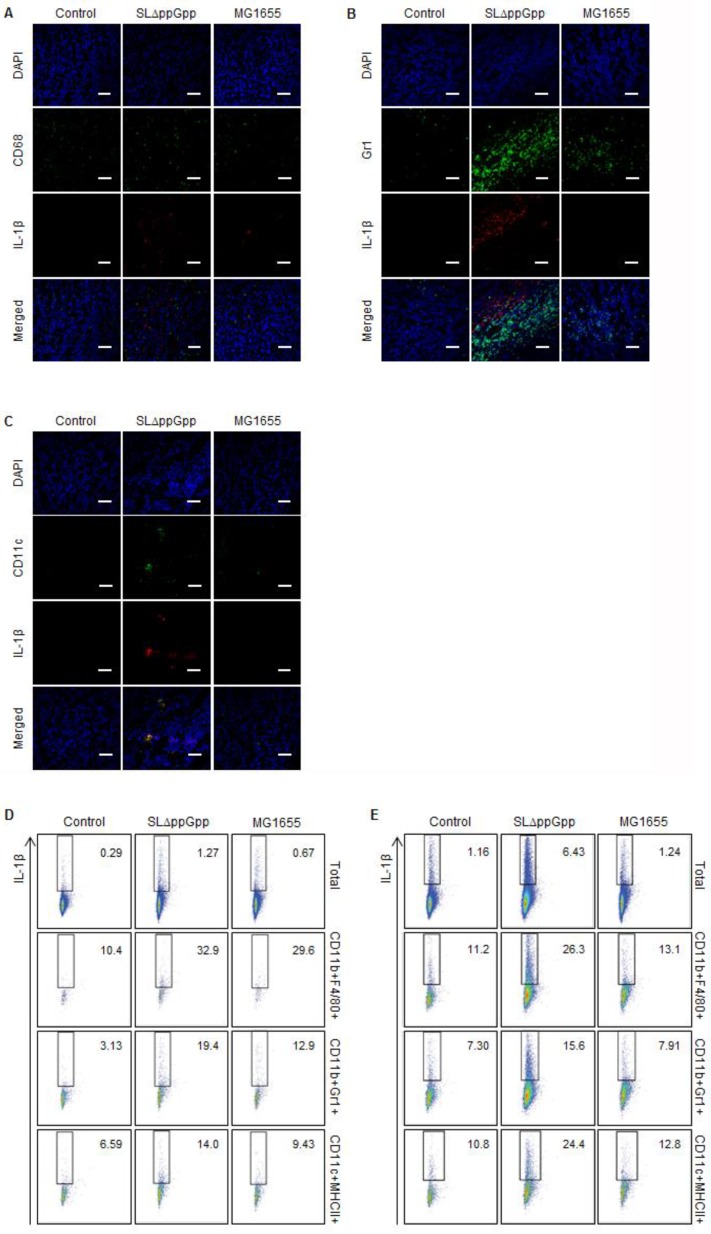
Figure 4.
Analysis of IL-1β producing cells. Tumor tissue was excised and fixed at 2 dpi, cryo-sectioned, and immunostained for IL-1β plus CD68 (macrophages), Ly-6G/Ly-6C (neutrophils), or CD11c (dendritic cells). Representative images from three independent experiments are shown (A-C). The green signal represents CD68 (A), Ly-6G/Ly-6C (B), or CD11c (C), whereas the red signal represents IL-1β. Sections were stained with DAPI (blue signal) as a control. Scale bar = 50 µm. (D, E) Cells were re-stimulated with PMA and ionomycin in the presence of GolgiStop, and the IL-1β+ population was examined by intracellular staining. Multi-color analysis was used to examine the proportion of IL-1β+ cells within the total cell, macrophage (CD11b+F4/80+), neutrophil (CD11b+Gr1+), and dendritic cell (CD11c+MHCII+) populations. The indicated values represent the IL-1β+ population in the tumor-draining lymph nodes (D) and spleen (E). Data are representative of two individual experiments, each with similar results.

