

Abstract
Nuclear landscapes were studied during preimplantation development of bovine embryos, generated either by in vitro fertilization (IVF), or generated as cloned embryos by somatic cell nuclear transfer (SCNT) of bovine fetal fibroblasts, using 3-dimensional confocal laser scanning microscopy (3D-CLSM) and structured illumination microscopy (3D-SIM). Nuclear landscapes of IVF and SCNT embryonic nuclei were compared with each other and with fibroblast nuclei. We demonstrate that reprogramming of fibroblast nuclei in cloned embryos requires changes of their landscapes similar to nuclei of IVF embryos. On the way toward the 8-cell stage, where major genome activation occurs, a major lacuna, enriched with splicing factors, was formed in the nuclear interior and chromosome territories (CTs) were shifted toward the nuclear periphery. During further development the major lacuna disappeared and CTs were redistributed throughout the nuclear interior forming a contiguous higher order chromatin network. At all stages of development CTs of IVF and SCNT embryonic nuclei were built up from chromatin domain clusters (CDCs) pervaded by interchromatin compartment (IC) channels. Quantitative analyses revealed a highly significant enrichment of RNA polymerase II and H3K4me3, a marker for transcriptionally competent chromatin, at the periphery of CDCs. In contrast, H3K9me3, a marker for silent chromatin, was enriched in the more compacted interior of CDCs. Despite these striking similarities, we also detected major differences between nuclear landscapes of IVF and cloned embryos. Possible implications of these differences for the developmental potential of cloned animals remain to be investigated. We present a model, which integrates generally applicable structural and functional features of the nuclear landscape.
Keywords: bovine preimplantation development, chromosome territory, chromatin domain, embryonic genome activation, H3K4me3, H3K9me3, in vitro fertilization (IVF), interchromatin compartment, RNA polymerase II, somatic cell nuclear transfer (SCNT)
Abbreviations
- 3D-CLSM
3-dimensional confocal laser scanning microscopy
- 3D-SIM
3-dimensional structured illumination microscopy
- B23
nucleophosmin B23
- BTA
Bos taurus
- CDC
chromatin domain cluster
- CT
chromosome territory
- major EGA
major embryonic genome activation
- EM
electron microscopy
- ENC
embryonic nuclei with conventional nuclear architecture
- ENP
embryonic nuclei with peripheral CT distribution
- H3K4me3
histone H3 with tri-methylated lysine 4
- H3K9me3
histone H3 with tri-methylated lysine 9
- H3S10p
histone H3 with phosphorylated serine 10
- IC
interchromatin compartment
- IVF
in vitro fertilization
- MCB
major chromatin body
- PR
perichromatin region
- RNA polymerase II-S2p
RNA polymerase II with phosphorylated serine 2 of its CTD domain
- RNA polymerase II-S5p
RNA polymerase II with phosphorylated serine 5 of its CTD domain
- SC-35
splicing factor SC-35
- SCNT
somatic cell nuclear transfer.
Introduction
In 1985 Günter Blobel predicted that “the genome of a higher eukaryotic organism is organized into a number of distinct 3-dimensional (3D) structures, each characteristic for a given differentiated state. These discrete 3D structures are envisioned to develop in a hierarchical and largely irreversible manner from an omnipotent 3D structure of the zygotic genome.”1 Since then the nucleus has emerged as a biological system with an unexpectedly complex and dynamic higher order organization.2-15 To test Günter Blobel's hypothesis further, it is necessary to explore how the 3D structure of the zygotic genome actually changes during early development. A number of groups, including ours, have made strong efforts to overcome the methodological obstacles, which have prevented detailed 3D analyses of nuclear architecture in space and time during preimplantation development of mammalian embryos.16-22 Despite this progress, the connections between structural and functional changes of cell nuclei during development and differentiation must be counted among the great, unresolved problems of cell biology. For a comprehensive understanding of nuclear structure-function relationships it is important to decipher the rules of a dynamic higher order nuclear organization, including detailed information on changes of the nuclear architecture during development and differentiation at large, as well as positional changes of individual genes and chromosome territories (CTs). Changes of higher order chromatin arrangements correlated with transcriptional activation and silencing of genes may reflect a functional necessity of genes to adopt a nuclear environment favorable for their active or repressed state.23,24
As a model system we chose bovine embryos generated either by in vitro fertilization (IVF) or by somatic cell nuclear transfer (SCNT) of bovine fetal fibroblasts.19,25 In bovine IVF embryos minor genome activation is already detected in 2-cell embryos, but restricted to a small number of genes.26 In contrast, major embryonic genome activation (major EGA) affects a large number of genes and occurs at the 8-cell stage.27 It marks the critical period when control of development is shifted from maternal to embryonic gene products and is essential for normal development.28,29 Major EGA secures the embryo's further supply with proteins for the special needs of normal development. Several reports described the 8- to 16-cell stage of bovine preimplantation embryos as the critical window for major EGA.30-34 A recent study based on deep RNA sequencing revealed the largest proportion of gene activation at the 8-cell stage, including the pluripotency genes POU5F1 (previously known as OCT4) and NANOG.27 This study was based on RNA sequencing and found that 58% of all genes activated between the 4-cell and the blastocyst stage were activated at the 8-cell stage. These genes can be classified as genes involved in major EGA. In cloned bovine preimplantation embryos the timing of reprogramming of gene expression is currently less well defined. In a previous study from our group25 we studied the expression of a stably integrated POU5F1-EGFP reporter gene in cloned bovine embryos and found demonstrable EGFP fluorescence only in embryos carrying 9 and more cells. Based on this observation we tentatively assume that major EGA in in vitro fertilized and reprogramming of gene expression in cloned bovine embryos occurs within the same time window. For a quantitative analysis of positional changes of this pluripotency marker gene, the chromosome territory 13 harboring the transgene, as well as the homolog territory during structural reorganization of bovine fetal fibroblast nuclei in cloned early bovine embryos we refer readers to the accompanying article by Popken et al.35
Employing both the conventional light optical resolution of 3-dimensional confocal laser scanning microscopy (3D-CLSM) and the improved resolution of 3-dimensional structured illumination microscopy (3D-SIM), we demonstrate massive changes of the global nuclear architecture in both in vitro fertilized and cloned embryos passing through major EGA. With 3D-SIM we carried out an in-depth comparative analysis of nuclear landscapes in both types of bovine preimplantation embryos, as well as of nuclei from bovine fetal fibroblast cultures. We compare these landscapes with previously studied nuclear landscapes in mouse embryonic stem cells and somatic cell types from various mammalian species.36-41 Notwithstanding major differences in the global nuclear architecture of different cell types with regard to nuclear shapes, volumes and chromatin arrangements at large, the results of all studies support the chromosome territory– interchromatin compartment (CT-IC) model of a functional nuclear architecture.6,42,43 According to this model the IC represents an interconnected system of channels and larger lacunas. It harbors macromolecular complexes and factors necessary for transcription, splicing, replication and repair and may serve for the export of ribonucleoprotein complexes with mRNA.6,44 IC-channels start/end at nuclear pore complexes (NPCs) and pervade the nuclear interior between ∼1-Mbp chromatin domains and chromatin domain clusters (CDCs) as building blocks of CTs.40 CDCs in turn give rise to chromosome band and arm domains yielding complete CTs, which typically form an interconnected higher order chromatin network attached to the nuclear lamina and expanding throughout the entire nuclear space.6 At numerous sites channels expand into larger lacunas, which carry splicing speckles and other types of nuclear bodies. Electron microscopic (EM) evidence has shown that the periphery of CDCs, which lines the IC and has been termed the perichromatin region (PR), carries functionally competent chromatin, where transcription, co-transcriptional splicing, DNA replication and repair take place.41 Evidence for the formation of nascent RNA in the PR was first provided in an EM study by Stan Fakan and colleagues, who pulse-labeled a human cancer cell line with BrUTP and demonstrated the enrichment of bromine-labeled RNA in the PR.45,46 In situ hybridization with sense and anti-sense RNA probes derived from total cellular or cytoplasmic poly(A+) RNA in combination with immunoelectron microscopy demonstrated that most transcribed DNA is concentrated in the perichromatin region.47 In another seminal EM study performed with a Chinese hamster cell line the Fakan group also observed the formation of nascent DNA within the PR.48 Employing a pulse-chase-pulse labeling protocol with iododeoxyuridine and chlorodeoxyuridine, the authors were able to demonstrate that DNA replication was followed by movements of nascent DNA of about 100 nm into the interior of lining chromatin domains. The development of light optical super-resolution microscopy provided entirely new possibilities to investigate the 3D nuclear landscape with superior resolution.36,37,40 These studies have led to the view that the IC together with the PR forms an active nuclear compartment (aNC), located side-by-side with the inactive nuclear compartment (iNC), which is contributed by the core regions of the higher order CDC network.40
Our current study extends the aNC/iNC view of a functional nuclear landscape to nuclei studied during preimplantation development of in vitro fertilized and cloned embryos. Despite major differences of global architecture between pre- and post-major EGA embryos and even within the same embryo, all nuclei showed common basic features, including a highly significant enrichment of RNA polymerase II and of H3K4me3 in the perichromatin region. H3K4me3 is a marker for transcriptionally competent chromatin.49 In contrast, H3K9me3 was enriched in the more densely DAPI-stained interior of chromatin domain clusters. H3K9me3 is enriched in a variety of (pericentromeric) repeats but also involved as a (mostly repressive) signature for fine tuning of expression levels at promoters, enhancers and gene bodies for large scale repression.49 The striking similarities and differences of nuclear landscapes between fetal fibroblast nuclei and nuclei from cloned embryos provides insights into major structural events of nuclear reprogramming involved in cloning of mammals.
The following results are presented in 3 parts. In part 1 we describe nuclear landscapes from in vitro fertilized and cloned preimplantation embryos observed with 3D confocal laser scanning microscopy, followed in part 2 by a comparison of the nuclear topography of DAPI-stained chromatin, H3K4me3, H3K9me3 and RNA polymerase II arrangements with the improved resolution of 3D structured illumination microscopy in such embryos, as well as in fetal fibroblasts employed for cloning. In part 3 we present a quantitative analysis of the changing frequencies of nuclear phenotypes described in part 1 and 2 and link topological chromatin density mapping of nuclear landscapes during preimplantation development with local enrichments and depletions of H3K4me3, H3K9me3 and RNA polymerase II arrangements.
Results
Part 1. Studies of in vitro fertilized and cloned preimplantation embryos with 3D confocal laser scanning microscopy
Global reorganization of nuclear architecture accompanies the onset of major embryonic genome activation in in vitro fertilized and reprogramming in cloned embryos
Figure 1, Panels A1–A8 show top, midplane and bottom x/y-sections from a 3D-image stack recorded with 3D-CLSM from all nuclei of a typical IVF 8-cell embryo. In all nuclei large clusters of DAPI-stained chromatin, called major chromatin bodies (MCBs) surrounded a major lacuna with a mostly central or sometimes acentric location resulting in a markedly peripheral chromatin location. Accordingly, this nuclear phenotype was termed ENP (for Embryonic Nuclei with Peripheral chromatin location). The major lacuna did not contain detectable amounts of DAPI-stained DNA except for occasional clusters of chromatin which may represent MCBs retained in the nuclear interior during ENP formation.
Figure 1.

(See previous page). Global reorganization of nuclear architecture during preimplantation development of in vitro fertilized bovine embryos studied with 3D confocal laser scanning microscopy. Panels A1–A8. Top, middle and bottom x/y-sections from image stacks of 8 DAPI-stained nuclei recorded with 3-dimensional confocal laser scanning microscopy (3D-CLSM) in an in vitro fertilized 8-cell embryo. All nuclei show the ENP phenotype (Embryonic Nucleus with a Peripheral chromatin arrangement; for a detailed description see Results). Panels B1–B8. Top, middle and bottom x/y-sections from representative DAPI-stained nuclei recorded with CLSM in an IVF 20-cell embryo. Panel B1 exemplifies one of 3 nuclei in this embryo with a persistent ENP phenotype. Panels B4–B8 provide examples for the nuclear phenotype, termed ENC, which was noted in 15 nuclei (Embryonic Nucleus with Conventional chromatin arrangement; for a detailed description see text). Two nuclei (Panels B2 and B3) apparently represent a transition stage between ENPs and ENCs, called ENP/C (for details see text). Bars: 10 μm in panel A1 is representative for all nuclei.
Panels B1-B8 of Figure 1 present top, midplane and bottom x/y-CLSM-sections of 8 representative nuclei from a 20-cell post-major EGA embryo. Panel B1 exemplifies one of 3 nuclei which had retained the ENP phenotype in this embryo. Panels B4-B8 are representative for 15 nuclei that had adopted a phenotype, called ENC (Embryonic Nuclei with Conventional architecture). In line with the architecture observed in numerous somatic cell types studied to date, ENCs are characterized by DAPI-stained chromatin expanded throughout the nuclear space and the absence of the major lacuna found in ENPs. The nuclear border of ENCs was marked by a rim of intensely DAPI-stained chromatin which was also observed around nucleoli. Other nuclei, termed ENP/Cs, apparently represent a transition stage between ENPs and ENCs. They contained a major lacuna, with a reduced size (Panels B2 and B3), in line with an invasion of chromatin into the nuclear interior. In ENP/Cs but not in ENPs we detected typical nucleoli, which were like nucleoli in ENCs surrounded by a rim of densely DAPI-stained chromatin (see below for further evidence).
Figure 2, Panels A1–A7, show top, midplane and bottom confocal sections from all nuclei of a cloned 7-cell bovine embryo obtained by somatic cell nuclear transfer (SCNT) of a bovine fetal fibroblast. Nuclear phenotypes in this embryo were strikingly similar to the ENP phenotype detected in in vitro fertilized embryos. In a cloned 25-cell embryo (Fig. 2, B1–B7) only one ENP persisted (Panel B1) and ENCs became the predominant phenotype (Panels B2–B7). Kinetochores, immunodetected by a kinetochore specific antibody, were strongly enriched in ENPs at the nuclear periphery with occasional exceptions of kinetochores associated with a rare chromatin cluster located inside the major lacuna. In ENCs kinetochores were distributed throughout the nuclear space, sometimes located directly beside a densely DAPI-stained chromatin cluster and sometimes at sites of modestly stained DNA (Fig. 2, bottom, Panels a and b). Notably, bovine chromosomes contain pericentromeric heterochromatin, which carries repetitive sequences with a high GC content.50 The total numbers of kinetochore signals counted in 3D image stacks were consistently below the number of chromosomes (2n = 60) carried by a diploid bovine nucleus suggesting that signals may represent clusters of kinetochores from several spatially adjacent CTs (data not shown).
Figure 2.

(See previous page). Global reorganization of nuclear architecture during preimplantation development of cloned bovine embryos studied with 3D confocal laser scanning microscopy (3D-CLSM). Panels A1–A7. Top, mid and bottom x/y-sections from image stacks of 7 DAPI-stained nuclei recorded with 3D-CLSM in a cloned 7-cell embryo. All nuclei show an ENP-like phenotype (compare Fig. 1, Panels A1-A8). Panels B1–B7. Top, mid and bottom x/y-sections from representative DAPI-stained nuclei recorded with CLSM in a cloned 25-cell embryo. One nucleus (Panel B1) has retained the ENP phenotype. The other nuclei (Panels B2–B7) represent the ENC phenotype (compare Fig. 1, Panels B4–B8). Nucleoli surrounded with dense chromatin were noted in all ENCs but not in ENPs. Green signals in all Panels represent immunostained kinetochores. Enlarged views from boxed areas in Panels A1 and B1 with kinetochores are shown at the bottom of this Figure (Panels a and b). Note the location of kinetochore clusters in modestly DAPI-stained areas. Bars: 10 μm in panel A1 applies to all Panels A1-7 and B1-7; 1 μm for enlarged boxes a1/a2, and b1/b2.
Chromosome painting experiments performed with a paint probe for BTA 13 in cloned embryos (see accompanying article by Popken et al.35) revealed that MCBs, isolated from each other by wide IC-channels in ENPs, represent individual CTs (Fig. 3, Panels B and C). In both fetal fibroblast nuclei and ENCs chromosome territories formed higher order networks expanding throughout the entire nuclear space. Accordingly, CTs could only be identified as discrete entities after chromosome painting (Fig. 3, Panels A and D). The striking differences of nuclear architecture between nuclei of embryos at major EGA at the 8-cell stage and nuclei of embryos both on their way toward major EGA and after major EGA are described in more detail using 3D-SIM in part 2 of Results.
Figure 3.

(See previous page). Comparison of painted chromosome territories in nuclei of bovine fetal fibroblasts and cloned embryos. Panels A–D. Midplane nuclear sections from imaging stacks recorded with CLSM from a bovine fetal fibroblast nucleus (panel A), an ENP (panel B), an ENP/C (panel C) and an ENC (panel D) from cloned embryos after 3D-FISH with a BTA 13 paint probe (green). Chromosome painting demonstrates that individual CTs 13 correspond to individual major chromatin bodies (MCBs) with variable configurations, occasionally including nearby chromatin clusters (arrow). Three further MCBs painted with the BTA 13 probe were detected in other light optical sections from this nucleus (see Supplementary Fig. S1 in accompanying article by Popken et al.35). Bars: 3 μm for A1–3, B1, B2, C1, C2, D1, D2; 2 μm for the enlarged box in A1 and for B3, B4; 1 μm for C3, C4.
Splicing factors and RNA synthesis in nuclei of in vitro fertilized embryos passing through major genome activation and in cloned embryos at corresponding stages of preimplantation development
Immunostaining revealed an enrichment of the splicing factor SC-35 within the major lacuna of ENPs in IVF embryos (Fig. 4, Panel A), while numerous SC-35 positive splicing speckles were noted in ENCs (Fig. 4, Panel B). We suggest that the formation of this large lacuna represents a storage compartment for large amounts of splicing speckles and numerous other proteins and protein complexes, which help the embryo to comply with the demands of major genome activation. The expanding major lacuna may push CTs toward the nuclear periphery. De novo RNA synthesis was demonstrated in ENPs, ENP/Cs and ENCs of in vitro fertilized embryos (Fig. 4, Panels C–E). Strong RNA synthesis was noted in nucleoli of ENCs (Fig. 4, Panel E). The long labeling period with BrUTP or BrU precludes conclusions on the actual sites of nascent RNA synthesis in this experiment. The presence of bromine-labeled RNA within the major lacuna suggests movements of nascent RNA formed in peripheral MCBs into the nuclear interior. Evidence for remarkably similar patterns of RNA synthesized in ENP- and ENP/C-like nuclei as well as in ENCs of a cloned bovine embryo is presented in Figure 4, Panels F–I.
Figure 4.

(See previous page). Arrangements of splicing speckles and de novo synthesized RNA in nuclei of in vitro fertilized and cloned embryos. Panels A and B. Midplane sections recorded by 3D-CLSM in an ENP (panel A) and an ENC (panel B) from IVF embryos stained with TO-PRO-3 DNA (red) show the enrichment of the splicing factor SC-35 (green) in splicing speckles both in the major lacuna of the ENP and distributed throughout the interchromatin compartment of the ENC. Panels C–E. Immunocytochemical detection of bromine-labeled RNA after incubation for 45 minutes with BrUTP or BrU precursors. Panel F. Projection of a confocal image stack from a 15-cell cloned embryo stained with TO-PRO-3 (red) following 45 minutes incubation with BrU shows nuclei with strikingly different phenotypes, including a pyknotic nucleus (arrow). Note that the visibility of all nuclei in this projection is precluded by nuclear overlays. Panels G–I. Enlarged views of nuclei, framed in F1 by boxes G, H and I, include an ENP-like nucleus (G), an ENP/C-like nucleus (H) and an ENC (I) (for definition of these nuclear phenotypes see Results and compare Figs. 1 and 2). These Panels also present evidence for de novo RNA synthesis in nuclei of this cloned embryo independent of differences between nuclear phenotypes. Note strong RNA synthesis in nucleoli of ENCs of both fertilized (panel E) and cloned embryos (panel I). Bars: 5 μm in A1 representative for Panels A–E, 25 μm in Panel F; 5 μm in G1 for Panels G–I.
Since DAPI has a preference for AT-rich DNA, we considered the possibility that we missed GC-rich DNA located in the major lacuna of ENPs.51 Staining of nuclear DNA with TO-PRO-3, a fluorescent dye without a DNA sequence preference, however, also revealed a lack of DNA in the major lacuna of ENPs except for occasional TO-PRO-3 stained chromatin clusters (Fig. 4, Panels A, C, G).52 This finding argues against a major contribution of chromatin loops with GC-rich DNA extending from the nuclear periphery into its interior.
Topography of DNA replication, nucleolus development, and histone markers in nuclei of in vitro fertilized embryos passing through major genome activation
Figure 5 presents confocal midplane images recorded from ENPs, ENP/Cs and ENCs of early in vitro fertilized preimplantation embryos subjected to a variety of immunostainings. ENPs resembled to some extent the nuclear phenotype of cells during the G2/prophase transition. For a direct demonstration that ENPs were present in cells transversing through interphase and prophase, we treated pre-major EGA embryos with a 30-min pulse of the thymidine analog EdU and combined the immunocytochemical detection of incorporated EdU with the detection of phosphorylated H3S10, a marker strongly expressed in cells proceeding to prophase.53 Figure 5, Panels A and B show ENPs from a 5-cell embryo. One of the 5 ENPs was strongly H3S10p positive and EdU negative, 4 ENPs were positive for EdU but barely showed H3S10p. As expected, ENCs presented conventional EdU pulse-labeling patterns during S-phase. For example, the ENC recorded from a 21-cell post-major EGA embryo (Fig. 5, Panel C) shows a pattern typical for mid S-phase with EdU labeled replication foci enriched at the nuclear periphery and around nucleoli but also noted throughout the nuclear space. Figure 5, Panel D exemplifies an ENP with nucleolar precursor bodies (NPBs) visualized by immunostaining of nucleophosmin B23.54 NPBs were located at the interior side of the peripheral CTs, whereas the ENC shown in Figure 5, Panel E contained large nucleoli in the nuclear interior. Figure 5, Panels F and G, demonstrate an ENP and an ENP/C, respectively, with peripherally located major chromatin clusters, some strongly immunostained for transcriptionally competent chromatin (H3K4me3). This pattern of H3K4me3 was consistently found in ENPs of 5- to 8-cell embryos suggesting that chromatin reaches transcriptional competence prior to the 8-cell stage (Fig. 5, Panel F, see also part II below). It is not known yet whether MCBs strongly immunopositive for H3K4me3 in different ENPs comprise variable CTs from the entire chromosome complement or a specific subset of CTs. For comparison, Figure 5, Panels H–J, present typical examples of an ENP (Panel H), ENP/C (Panel I) and ENC (Panel J) from a 14-cell embryo with major chromatin clusters, which were immunopositive for H3K9me3, a histone marker for transcriptionally silent chromatin.
Figure 5.

Representative confocal midplane sections demonstrate essential features of ENPs and ENCs in in vitro fertilized embryos. Panel A. ENP at G2/ prophase, characterized by strong immunostaining of H3S10p. Panel B. ENP in S-phase, characterized by pulse-labeling (30 min) of replication foci with EdU. Panel C. EdU pulse labeling pattern of a typical ENC in mid S-phase. Panel D. ENP with several nucleolar precursor bodies (NPBs), immunostained with the nucleolar marker B23. Panel E. Large nucleoli lined with B23 in the interior of an ENC. Panels F, G. ENP (F) and ENP/C (G) with positive H3K4me3 immunostaining of chromatin, clearly enriched in some MCBs (compare Supplementary Fig. S1). Panels H, I, J. Immunocytochemical detection of H3K9me3 in an ENP (H), an ENP/C (I) and an ENC (J). Bar: 4 μm in A1 representative for all Panels.
Major chromatin clusters will be described in more detail in part 2. We wish to make readers aware of the current lack of a generally accepted nomenclature to describe the range of higher order chromatin structures encountered at different scales of magnification. For this reason, a clarification of the terms used by us may be appropriate at this point for better comprehension of part 2 and part 3 of the present study. Major chromatin clusters may comprise a part of a single CT or a higher order structure composed from parts of several neighboring CTs with variable H3K4me3 and H3K9me3 labeling patterns, formed sometimes from modestly and sometimes from intensely DAPI-stained chromatin. As shown below, major chromatin clusters contribute to the variability, which distinguishes nuclear landscapes in in vitro fertilized and cloned embryos from each other and from somatic cell types, such as fetal fibroblasts used for animal cloning. Major chromatin clusters should neither be confused with major chromatin bodies in ENPs, representing an entire CT, nor with the much smaller chromatin domain clusters (CDCs) described in a previous study and below.40
Part 2.1 Nuclear landscapes in in vitro fertilized preimplantation embryos observed with 3D structured illumination microscopy (3D-SIM)
Compared with 3D-CLSM, 3D-SIM provides a superior resolution with an about twofold linear and eightfold volumetric improvement.55,56 All 3D-SIM studies described below were based on over 1000 individually recorded images per nucleus. Despite its reported AT affinity we chose DAPI for DNA staining in our 3D-SIM studies because of its high photostability (tolerating the high number of exposures required for the recording of a single nucleus), its DNA specificity and spectral properties fitting to our 3D-SIM system configuration. From several dyes which we tested for this purpose, only DAPI fulfilled these requirements for our setup.40
The recording of high quality 3D image stacks with a high numerical aperture microscope objective is only possible from structures located very close to precision cover glasses using immersion oil with a refractory index carefully adapted after empirical testing (see also Supplementary Information: Extended Experimental Procedures). 3D-SIM is better suited for imaging of flat nuclei, such as fibroblast nuclei than for large roundish nuclei. The thickness of bovine preimplantation embryos in the order of 100 to 150 μm prevents high quality 3D-SIM studies of nuclei in structurally intact embryos. To overcome this limitation, we recorded only those nuclei from intact embryos, which were found close to the glass surface. Alternatively, we microdissected embryos into single cells, which were placed individually on appropriate, polylysine-coated glass slides for secure attachment.
The quality of SIM images is also reduced by noise originating from the Poisson distribution of the limited number of photons recorded for each image from a given immunostained structure and by a pattern of concentric rings (Fig. 6). To overcome this problem as best as possible, images of DAPI-stained nuclei were routinely thresholded for display with a threshold just sufficient to eliminate this pattern (Fig. 6).
Figure 6.
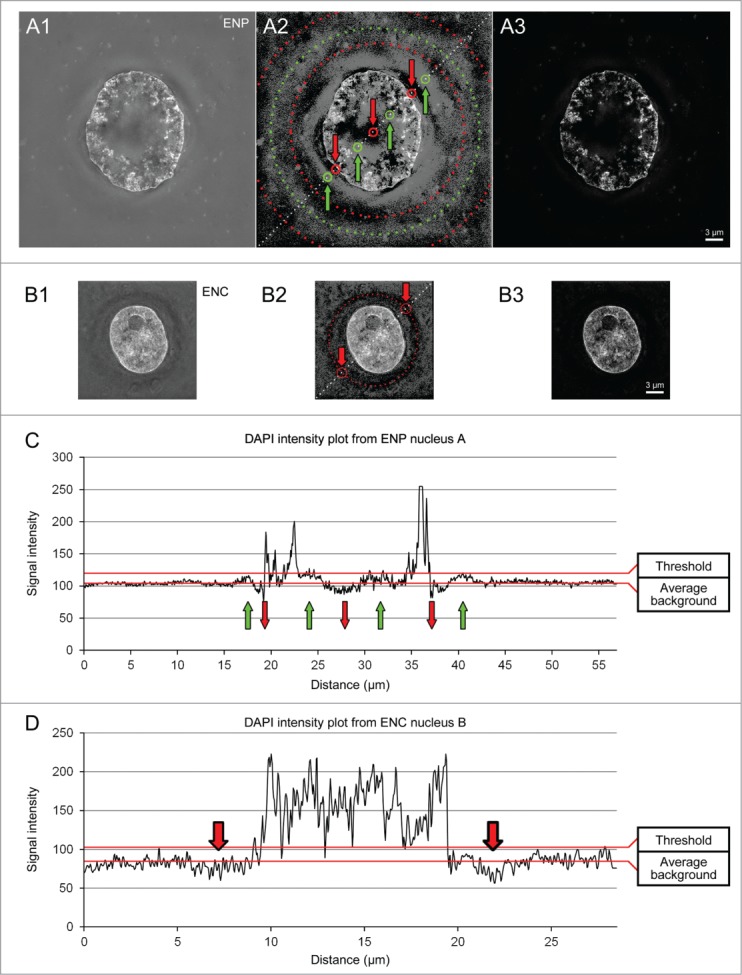
Problems and consequences of image thresholding in 3D structured illumination microscopy. Midplane SIM sections from a DAPI-stained ENP (panel A) and an ENC (panel B) without any threshold (A1, B1) and after application of a moderate threshold (A2, A3 and B2, B3). Contrast and brightness of images A2, B2 was chosen to emphasize a pronounced pattern of concentric rings, which represents an artifact of structured illumination microscopy. C and D. DAPI intensity profiles recorded along dashed lines in A2 and B2. Maintenance of these patterns in unthresholded images resulted in erroneous local increases (A2, C, green dotted line, circles and arrows) or decreases (A2, B2, C, D, red dotted line, circles and arrows) of DAPI intensities. Application of a threshold just above average background (C and D) largely removed the cocentric-ring like patterns, but at the expense that part of the real DAPI signal was also lost (A3, B3). See Supplementary Figures S2 and S3 for problems and consequences of threshold application to immunostained signals. Bars: 3 μm in A3 representative for all Panels.
Changes of higher order chromatin arrangements in nuclei of in vitro fertilized embryos studied with 3D structured illumination microscopy
Figure 7 shows sections from ENPs, ENP/Cs and ENCs recorded in IVF preimplantation embryos by 3D-SIM. The very large male and female pronuclei in an IVF zygote were recorded with 3D-CLSM (Figs. 7A and B) since they were positioned too far away from the glass surface to allow high quality imaging with 3D-SIM. Images from C to I demonstrate SIM sections from nuclei with phenotypes typical for IVF preimplantation embryos with increasing cell numbers: pre-ENPs from 2- and 4-cell embryos (C and D), an ENP from an 8-cell embryo (E) and ENCs from an embryo with 16 cells (F), a morula with around 30 cells (G) and the inner cell mass (H) and trophectoderm (I) of a blastocyst. Panels J–Q present midplane x/y-SIM sections (above) and x/z-SIM sections (below) from all nuclei of an 8-cell in vitro fertilized embryo. Seven nuclei (J–P) clearly show the major lacuna and peripheral localization of major chromatin bodies, characteristic for the ENP phenotype. One nucleus (Q) reveals major chromatin bodies isolated from each other by wide IC-lacunas, but lacks a major lacuna. Supplementary Figure S1, Panels A-H show the same DAPI stained nuclei in combination with immunostaining of H3K4me3. In line with findings described above (Fig. 5, Panel F), some MCBs were strongly immunostained, others modestly or weakly. For a more detailed inspection of the arrangements of DAPI-stained chromatin Figures 7R1– 10 provide midplane SIM sections from embryonic nuclei at higher magnification recorded from in vitro fertilized embryos prior, during and after major genome activation. Two nuclei from 4-cell embryos exemplify Pre-ENP phenotypes (R1, R2) with clustered chromatin still distributed throughout the nuclear interior. Two nuclei (R3, R4) exemplify transition stages from the pre-ENP to the ENP phenotype. Two nuclei from IVF 8-cell embryos represent typical ENPs (R5, R6) with a fully developed major lacuna and peripheral MCBs/CTs, isolated from their neighbors by wide IC-channels. Nuclei recorded from embryos after major genome activation represent examples of ENP/Cs (R7, R8) and ENCs (R9, R10), where a higher order chromatin network expanded throughout the entire nucleus. Typical nucleoli, surrounded by a rim of intensely DAPI-stained chromatin became apparent in ENP/Cs, but were absent in most nuclei of embryos prior to major genome activation. The improved resolution of 3D-SIM further revealed small chromatin domain clusters (CDCs) pervaded by numerous smaller IC-channels in these example nuclei, independent of their specific phenotype (compare the enlarged boxes a-c in R5, R6, R7 and R10). Supplementary Movies provide through view videos of 3D-SIM serial sections through DAPI-stained nuclei with typical phenotypes (movie 1: ENP (R4); movie 2: ENP (R6); movie 3: ENP/C (R8); movie 4: ENC (R10). Figure 7S provides a set of nuclear volume measurements based on 3D nuclear image stacks recorded with CLSM or 3D-SIM from in vitro fertilized embryos advancing from the 4-cell stage to >18 cells. Nuclei recorded in embryos consisting of 4 cells and 5–8 cells, respectively, did not show a significant difference of mean nuclear volumes (p = 0.4), whereas a highly significant volume decrease was detected for embryos with 5–8 cells advancing to 9–17 cells (passing through major EGA) (p < 0.006) and beyond (>18 cells) (p < 0.0003) indicating that volumes of ENCs with complete structural reconfiguration were highly significantly smaller than pre-ENPs, ENPs and ENP/Cs (p < 10−6). Although the pronounced inter-cell variability of nuclear volumes for ENPs, ENP/Cs and ENCs may in part reflect fixation of cells at different stages of interphase, volume comparisons between nuclei classified as ENPs in 5- to 16-cell embryos with nuclei classified in embryos with more than 18 cells revealed a highly significant decrease of the mean nuclear volume of the latter (p < 10−4). In contrast, the volumes of ENP/Cs did not differ significantly from the volumes of typical ENPs (p = 0.08), suggesting that the disappearance of the major lacuna was not simply enforced by nuclear volume reduction.
Figure 7.

(See previous page). Nuclear phenotypes in in vitro fertilized preimplantation embryos studied with 3D structured illumination microscopy. A–I. Midplane sections from typical DAPI-stained nuclei recorded with 3D-SIM at different preimplantation stages, male pronucleus from a zygote (A), female pronucleus from the same zygote (B), 2-cell stage (C), 4-cell stage (D), 8-cell stage (E), 16-cell stage (F), morula (G), and blastocyst (H from inner cell mass (ICM) and I from trophectoderm (TE)). The 2 pronuclei in a zygote were recorded with 3D confocal laser scanning microscopy (3D-CLSM) due to their distance to the cover glass. J–Q. Top row: Midplane-SIM sections from all DAPI-stained nuclei recorded in an IVF 8-cell embryo. Bottom row: Corresponding x/z-sections. With rare exceptions nuclei have a roundish shape and show the ENP phenotype (for definition see Results and Fig. 1). R1-R10. Midplane SIM sections present typical phenotypes of DAPI-stained nuclei at higher magnification taken from embryos with 4 cells (R1 – R3), 7 cells (R4), 8 cells (R5, R6), 9 cells (R7, R8), 19 cells (R9) and a morula with about 32 cells (R10). These nuclei were classified as pre-ENP (R1), transition state from the pre-ENP phenotype to ENP phenotype (R2) or early ENPs (R3, R4), fully developed ENPs (R5, R6), ENP/Cs (R7, R8), and ENCs (R9, R10). Typical nucleoli surrounded by intensely DAPI-stained chromatin (examples marked by asterisks in R7 – R10) were typically noted in ENP/Cs and in all ENCs. Arrows in R2 – R8 point to wide interchromatin compartment (IC) channels, pervading from the major lacuna toward the nuclear envelope between major chromatin bodies. They were first noted during the pre-ENP/ENP transition (R2), prominent in ENPs and ENP/Cs (see enlargements of boxed areas a-c in R6, R7) and disappeared together with the major lacuna during the development of ENCs (R9, R10). Major lacunas often adopted a central position in the nuclear interior of ENPs (R6), but acentric positions were also observed resulting in broad regions of direct contact of a major lacuna with the nuclear envelope (R3, arrowheads). At all stages of preimplantation development major chromatin bodies likely representing individual chromosome territories (compare Fig. 3) were built up from smaller chromatin domain clusters (CDCs) pervaded by small IC channels (see enlargements of boxed areas a-c in R5 and R10). S. Volumes recorded for a sample of nuclei recorded with 3D-CLSM or 3D-SIM from embryos with 4-cells (E4; 15 nuclei), 5 to 8 cells (E5–8; 27 nuclei), 9–16 cells (E9–16; 36 nuclei) and more than 18 cells (E > 18; 30 nuclei). Scatter plots are combined with box plots presenting mean values, quartiles and whiskers. Each dot respresents the volume of an individual nucleus. Black dots respresent ENPs, red dots ENP/Cs and blue dots ENCs. A highly significant volume decrease (P < 0.006) was noted for nuclei in embryos advancing from 5–8 cells to 9–16 cells. Bars: 5 μm in I representative for A–I; 3 μm in J representative for J–Q; 3 μm in R1 representative for R1-R10; 1 μm side length of enlarged boxes a, b and c in R5-R7, R10.
Figure 10.

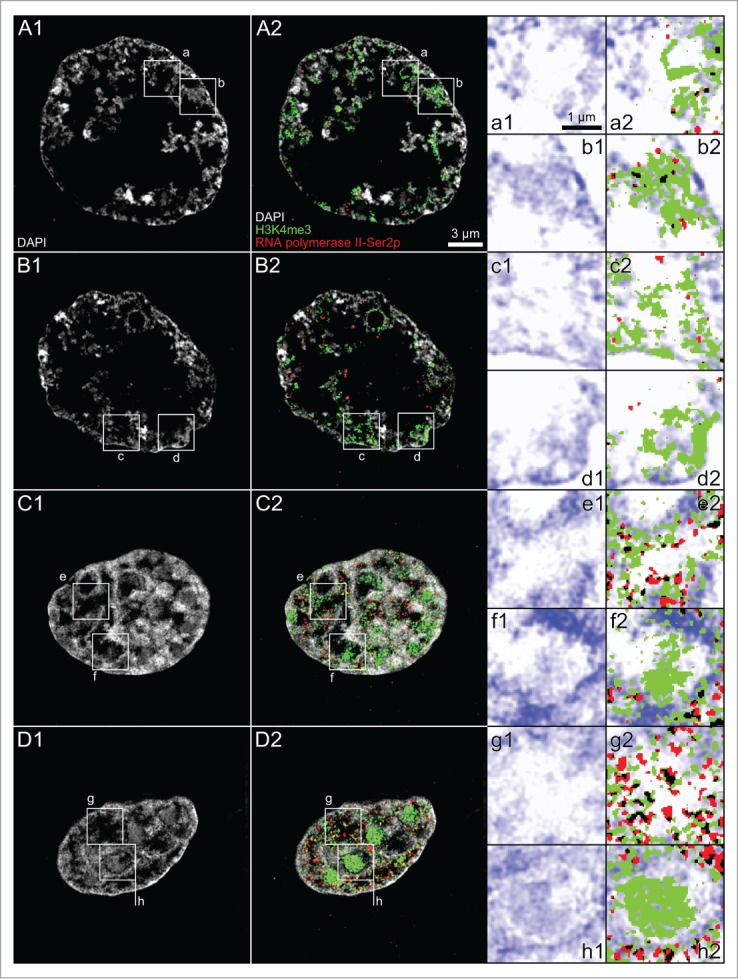
Topography of DAPI-stained chromatin, RNA polymerase II-S5p and H3K4me3 in nuclei from in vitro fertilized preimplantation embryos recorded with 3D structured illumination microscopy. Panels A and B. Midplane SIM sections from an ENP (panel A) and ENC (panel B). A1 and B1. Patterns of DAPI-stained DNA (gray). A2 and B3. Overlay of H3K4me3 (green) and RNA polymerase II-S5p signals (red) on the DAPI images. B2 shows only the H3K4me3 pattern, B4 only the RNA polymerase II-S5p pattern of this ENC. Rectangular boxes of the same size area marked in A1, A2, B1–B4 are presented as enlarged views in images a1, a3, a5, a7 and b1, b3, b5, b7. To allow a more detailed visual inspection at the level of individually recognizable pixels (39.5 nm2 pixel size) rectangular boxes marked in these views are further enlarged in a2, a4, a6, a8 and b2, b4, b6, b8. An increase in color intensity of DAPI positive pixels (blue) is tentatively considered as a reflection of a local increase in the compaction of chromatin stained with DAPI (a1, a2, b1, b2). Black pixels in a3, a4 and b3, b4 denote a colocalization of DAPI positive pixels with H3K4me3 positive pixels. Green colored H3K4me3 positive pixels were noted in DAPI negative areas of thresholded images (compare Fig. 6) (tentatively considered as interchromatin compartment channels). Red colored pixels in a5, a6 and b5, b6 are taken as an indication for RNA polymerase II-S5p positive pixels located within the interchromatin compartment, whereas black pixels in these images denote a colocalization of RNA polymerase II-S5p positive pixels with DAPI positive pixels. Black pixels in a7, a8 and b7, b8 indicate a colocalization of H3K4me3 positive pixels with RNA polymerase II-S5p positive pixels, whereas green and red pixel clusters hint to separate H3K4me3 and RNA polymerase II-S5p signals. Note the predominance of positive pixels for H3K4me3 and RNA polymerase II-S5p clusters at the periphery of chromatin clusters stained with DAPI often expanding into the IC (white). RNA polymerase II-S5p clusters show side-by-side associations with clusters of H3K4me3 labeled chromatin, but are also frequently located remote from each other. Bars: 3 μm for A1, A2, B1–B4; 1 μm for a1, a3, a5, a7 and b1, b3, b5, b7; 300 nm for a2, a4, a6, a8 and b2, b4, b6, b8.
Nucleolus development and characterization of chromatin surrounding nucleoli during early preimplantation development of in vitro fertilized embryos studied with 3D structured illumination microscopy
As already noted in the preceding 3D-CLSM study (Fig. 5, Panel D), nucleolar precursor bodies lacked the rim of intensely DAPI-stained chromatin, noted as a typical feature of nucleoli in ENP/Cs and ENCs. Small precursor bodies in ENPs were entirely positive for nucleophosmin B23, whereas larger precursor bodies and mature nucleoli were characterized by a peripheral rim of B23. Based on the higher resolution of 3D-SIM, Figure 8 provides further insights into the constitution of chromatin surrounding nucleoli. Figure 8, Panel A, shows an ENP with a particularly large nucleolar precursor or early nucleolus, which shows the peripheral B23 staining but lacks an intensely DAPI-stained rim. The typical “perinucleolar heterochromatic rim” harbors centromeric repeats and silenced (rRNA) genes and is enriched in repressive chromatin marks such as H3K9me3 and H3K27me3 and depleted in active marks such as H3K4me3.57-59 ENP/Cs in contrast revealed heterogeneous patterns (Fig. 8, Panels B–E). Some rims revealed areas of strong H3K4me3 staining (Panels B and C), whereas others showed strong H3K9me3 staining (Panel E) or a mixture of H3K4me3 and H3K9me3 staining at different parts of the rim (Panel D). It may be speculated that H3K4me3 enriched perinucleolar chromatin represents (rRNA) genes poised for transcription.
Figure 8.

(See previous page). Nucleolar precursor bodies and nucleoli in nuclei of in vitro fertilized embryos. A1–E1. Midplane SIM sections of a DAPI-stained nucleus approaching ENP (A1) and of 4 ENP/Cs (B1–E1). A2–E2. Corresponding sections with immunostained H3K4me3 (green) and B23 (red) in A2 and B2 or H3K4me3 (green) and H3K9me3 (red) in C2 – E2. Boxed areas in Panel A frame a nucleolar precursor body or early nucleolus and likely mature nuclei in Panels B–E. Enlarged images of boxed areas are presented below: A3–E3, DAPI; A4, B4, B23; C4–E4, H3K9me3; A5–E5, H3K4me3; A6, B6, colored overlays of DAPI, H3K4me3 and B23; C6–E6, colored overlays of DAPI, H3K4me3 and H3K9me3. Note that the nucleolar precursor body or early nucleolus shown in Panel A is lined by B23 (A4) but lacks a surrounding rim of intensely DAPI-stained DNA (A3) in contrast to mature nucleoli (B3–E3). Unexpectedly, most of the nucleoli shown in Panels B, D and E present variable parts of their DAPI-stained rims labeled with H3K4me3 (B5, C5, D5, see arrow heads in C5 and D5), considered as a marker for transcriptionally competent chromatin, but little detectable staining with H3K9me3, considered as a marker for silent chromatin (C4, D4). The DAPI-stained rim of the nucleolus shown in Panel E is strongly marked by H3K9me3 (E4) but shows little H3K4me3 staining (E5, arrow heads). Bars: 5 μm in A1 is representative for A1–E2, 1 μm in A3 is representative for enlarged boxes A3–E6.
Activation of ribosomal genes during preimplantation development of in vitro fertilized embryos
Figure 9 presents an evaluation of reads of intronic sequences from 83 genes coding for ribosomal proteins based on our recent transcriptome analysis of bovine oocytes and fertilized preimplantation embryos.27 We calculated the ratio of intronic reads to intronic positions not covered by reads (RINP). This parameter can be used to detect embryonic activation of specific genes based on the presence of incompletely spliced primary transcripts, whereas maternal transcripts stored in oocytes are mostly spliced and thus have a significantly lower RINP value. In line with the formation of fully active nucleoli at the 8-cell stage, this analysis provided evidence for activation of expression of 61 genes coding for ribosomal proteins during early embryonic development, including 9 genes at the 4-cell stage, 47 genes at the 8-cell stage, 4 genes at the 16-cell stage, and 1 gene at the blastocyst stage. Columns in Fig. 9 show average values of RINP for the entire pool of ribosomal protein genes. The 4-cell stage did not show a significant increase in the average RINP value in comparison with oocytes (p = 0.3). In contrast, a comparison between the 4-cell stage and the 8-cell stage indicates a massive and highly significant increase (p < 0.001) of the fraction of RNA synthesis provided on average by genes for ribosomal proteins in transcriptomes and a further rise at the 16-cell (p < 0.001) and blastocyst stage (p < 0.001). This finding is in line with the observation that typical nucleoli with intense RNA synthesis appear mostly in ENP/Cs after major genome activation, but are rarely observed in ENPs, which carry nucleolar precursor bodies or early nucleoli not yet surrounded by a rim of concentrated chromatin (compare (Fig. 4, Panels C, D, E, G, H, I; Fig. 5, Panels D and E; Fig. 8). The data, however, do not provide information on the average total amount of RNA synthesized from these genes per embryo or per cell at each stage.
Figure 9.
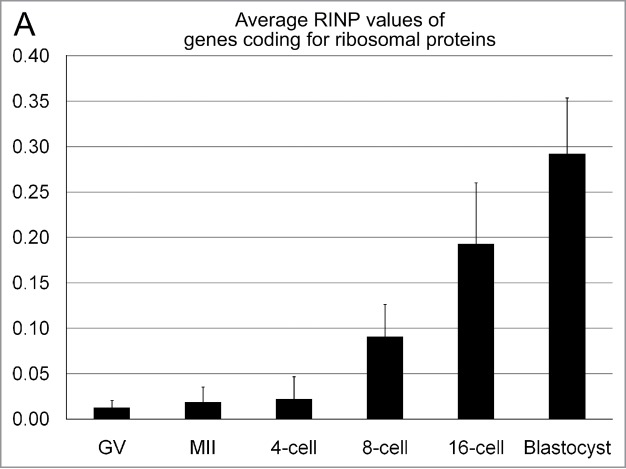
A transcriptome analysis suggests a major increase of intronic sequences from genes coding for ribosomal proteins at the 8-cell stage of in vitro fertilized embryos. Columns present the results of a transcriptome analysis of 83 genes coding for ribosomal proteins at germinal vesicle (GV) and at metaphase II stage bovine oocytes, as well as in IVF embryos with 4, 8 and 16 cells and in blastocysts.27 For all genes the parameter RINP was determined individually as a measure for the coverage of all intronic sequences in transcripts from each gene. RINP indicates the ratio of intronic read counts to not-covered intronic positions. A fold change ≥10 in RINP between subsequent replicates of the embryonic stages was considered as indicative of nascent transcription. Background was defined as the 75th percentile of RINP in the oocyte stages (for further details see Graf et al. 2014).27 A fold change ≥10 could only be confirmed for a fraction of ribosomal protein genes at each stage (for details see Results). Columns show average values of RINP for the entire pool of ribosomal protein genes.
RNA polymerase II, H3K4me3 and H3K9me3 arrangements in nuclei of in vitro fertilized preimplantation embryos
Figure 10, Panel A shows a midplane SIM section of a nucleus after immunodetection of H3K4me3 and RNA polymerase II, carrying a phosphorylated serine at position 5 (RNA polymerase II-S5p) of its C-terminal domain. This large nucleus was recorded in a 6-cell embryo and showed features of nuclei approaching the full ENP phenotype. It shows a central major lacuna surrounded by peripherally located, DAPI-stained chromatin peppered with RNA polymerase II clusters. In comparison with major chromatin bodies noted in fully developed ENPs at the 8-cell stage, chromatin appeared still more dispersed and individual MCBs separated by wide IC-channels could not yet be detected (compare Figure 7, panels J–Q, R5, R6). Figure 10, Panel B provides a typical example for the topography of H3K4me3 and RNA polymerase II-Ser5p in ENCs. In line with the distribution of a DAPI-stained higher order chromatin network focal signals of both RNA polymerase II and H3K4me3 are dispersed throughout the nuclear space. Boxed areas in the ENP (panel A) and ENC (Panel B) are shown as enlarged images (A1, A3, A5, A7 and B1, B3, B5, B7) on the right side of Figure 10. Boxes framed in these enlarged images are further enlarged in images A2, A4, A6, A8 and B2, B4, B6, B8 to provide insight into the topographical relationships of DAPI-stained chromatin, H3K4me3 and RNA polymerase II at the level of individual pixel clusters representing DAPI positive, RNA polymerase II and H3K4me3 signals. Although we noted occasional spatial overlap between RNA polymerase II clusters and H3K4me3 labeled chromatin (see black pixels in Figures 10 A7, A8 and B7, B8), numerous RNA polymerase II foci were observed without demonstrable contact to H3K4me3 positive chromatin suggesting that RNA polymerase II-S5p foci were either formed prior to their spatial association with transcriptionally competent chromatin or persisted after their spatial dissociation from transcribed chromatin.60
It should be noted that the choice of a threshold necessary to distinguish between background and true signals inevitably reflects to some extent a subjective decision. Our choice was based on the rationale that we expected little, if any true signal for RNA polymerase II or epigenetic marks outside the nucleus. Accordingly, the threshold was set with the goal to maintain signal inside the nucleus, while decreasing presumptive background outside the nucleus. The size and abundance of immunopositive RNA polymerase II and H3K4me3 signals was affected by the choice of a low, medium or high threshold (Supplementary Figs. S2 and S3). For each threshold, however, we noted a preferential localization of both markers at the periphery of chromatin domain clusters. For a quantitative assessment of the topography between higher order chromatin arrangements and the localization of RNA polymerase II, H3K4me3 and H3K9me3 see Part 3 below.
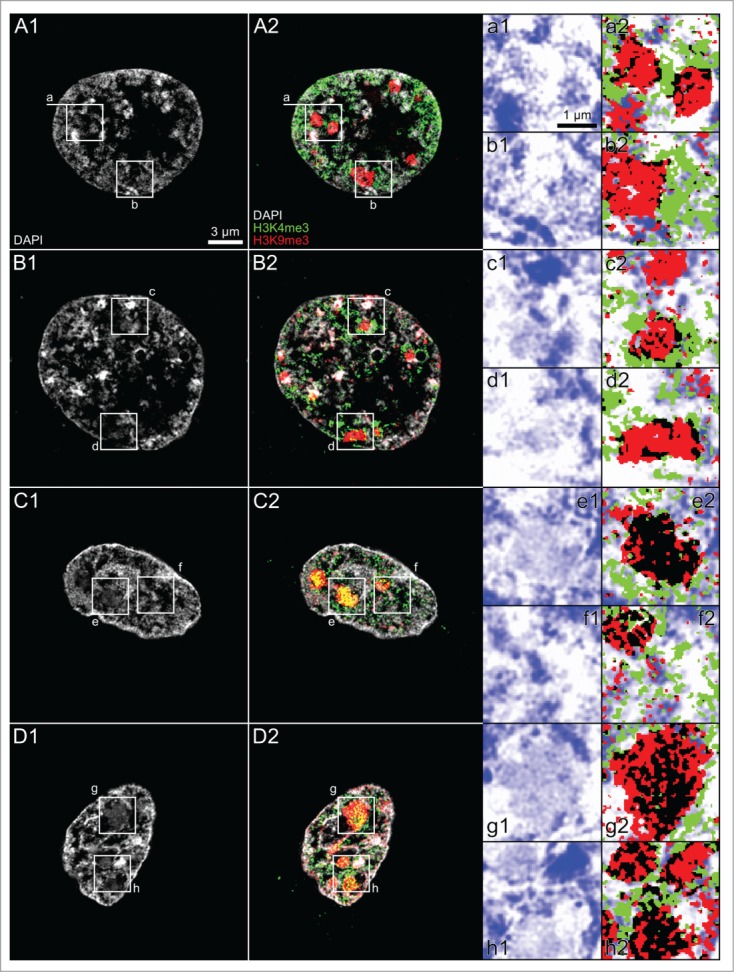
Next, we used 3D-SIM to analyze nuclear arrangements of epigenetic marks of transcriptionally competent (H3K4me3) and silent chromatin (H3K9me3), respectively, with regard to the arrangements of DAPI-stained DNA in ENPs and ENCs of IVF embryos. Striking changes in the patterns of these epigenetic marks were observed during ENP-ENP/C-ENC transitions of nuclei in embryos passing major genome activation. In typical ENPs (Fig. 11, Panel A) some MCBs were predominantly labeled with H3K4me3, others with H3K9me3, whereas still others showed only sparse evidence for the presence of either marker. H3K4me3 was frequently extended directly to the nuclear border. Figure 11, Panel B, presents an ENP/C at an early stage of post-major EGA structural transformation. Inspection of 3D-SIM image stacks revealed nucleoli surrounded by a rim of densely DAPI-stained chromatin in this ENP/C (see box c in Figure 11 B2). Figure 11, Panel C, shows an example of the arrangements of H3K9me3 and H3K4me3 marked chromatin typical for ENCs. Large H3K9me3 positive chromatin clusters were maintained in the interior of ENCs, whereas large H3K4me3 clusters had mostly disappeared. In further contrast to ENPs, H3K4me3 was barely detected at the nuclear border but nearly exclusively restricted to the nuclear interior. Several boxed areas in these nuclei are enlarged in the images on the right side of Figure 11 (Panels A, B, D, E, G, H) and provide insight into the topographical relationships of DAPI-stained chromatin, H3K4me3 and H3K9me3, employing the highest informative magnification possible. For comparison, images A1, B1, D1, E1, G1 and H1 represent only the DAPI-stained chromatin, whereas images A2, B2, D2, E2, G2 and H2 add H3K4me3 and H3K9me3 positive pixels, displayed without an attempt to distinguish between pixel intensities. We noted a nearly complete, mutual exclusion of chromatin clusters marked by H3K4me3 and clusters marked by H3K9me3. For further details see legend to Figure 11.
Figure 11.

(See previous page). Topography of DAPI-stained chromatin, H3K4me3 and H3K9me3 in nuclei from in vitro fertilized preimplantation embryos recorded with 3D structured illumination microscopy. Panels A–C. Midplane SIM sections from an ENP (A), an ENP/C (B) and an ENC (C) present typical examples of the topography of DAPI-stained DNA (gray, A1–C1) together with overlays of DAPI-stained DNA with H3K4me3 (green) and H3K9me3 (red) (A2–C2). Enlargements of boxed areas a, d, e, g and h in these nuclei are shown on the right with DAPI-stained chromatin in blue (a1, d1, e1, g1 and h1) and corresponding overlays of DAPI images with pixels (pixel size 39.5 nm2) classified as immunopositive for H3K4me3 (green) or H3K9me3 (red) (a2, d2, e2, g2 and h2). Pixels and pixel clusters positive for both H3K4me3 and H3K9me3 are denoted in black. Circles in the corresponding images d1/d2, e1/e2, g1/g2, h1/h2 were drawn into these enlarged images either to mark areas of special interest (see below) or to facilitate comparisons between images showing only the DAPI pattern (left) and their corresponding counterpart showing additional immunolabeling of epigenetic markers (right). Panel A. In this ENP most of the core parts of the strictly peripherally located DAPI-stained major chromatin bodies (MCBs) are labeled with H3K9me3. In the periphery of some of these MCBs we note intensive labeling with H3K4me3 (compare a1 and a2). H3K4me3 positive clusters can be noted directly at the nuclear border. The MCB presented at the right side of b1 and b2 exemplifies a case, strongly labeled with H3K4me3 throughout with very little additional staining of H3K9me3, whereas the MCB on the left side of b1 and b2 shows overlapping signals of H3K4me3 and H3K9me3. Panel B. This nucleus was identified as ENP/C. Nucleoli surrounded by densely DAPI-stained chromatin were noted in other sections of the 3D-SIM image stack (for an example see box c). In comparison with the ENP shown in Panel A, the size of the major lacuna is apparently reduced by the invasion of MCBs toward the nuclear interior. A clear separation of neighboring MCBs by wide IC channels is no longer possible in this nucleus. Potential MCBs or alternatively major chromatin domain clusters with contributions from several neighboring CTs were preferentially labeled with H3K4me3, while others were preferentially labeled with H3K9me3 (see boxed area e in Panel B and enlarged views e1 and e2 on the right). Enlarged boxes d1/d2 show a peripheral nuclear region with intensely DAPI-stained chromatin enriched at the nuclear border. H3K9me3 labeled chromatin is noted in clusters both at the nuclear border and away from the border. These clusters, however, colocalize only in part with the densely DAPI-stained chromatin but also extend into modestly DAPI-stained regions. Clusters of H3K4me3 labeled chromatin are distributed between the H3K9me3 labeled clusters. The enlarged views f1/f2 show that not only H3K9me3 but also H3K4me3 positive clusters can be noted directly at the nuclear border (compare with a2). Panel C. Midplane SIM section from a typical ENC nucleus. In contrast to the ENP and ENP/C, the major lacuna has disappeared. Chromatin at the nuclear border is nearly exclusively marked with H3K9me3 and extends as an interconnected chromatin network throughout the nuclear interior with numerous large and small H3K9me3 labeled clusters, whereas enrichment of H3K4me3 label is only noted in dispersed small clusters (compare g1/g2 and h1/h2). Although these enlarged views suggest a preference of H3K9me3 for regions more densely stained with DAPI, whereas H3K4me3 appears preferentially located in less densely stained regions, detailed inspection shows an occasional extension of H3K9me3 positive pixels also into regions with weakly DAPI-stained chromatin and on the contrary an extension of H3K4me3 positive pixels into intensely DAPI-stained regions (see Results part 3 for quantitative analysis). Bars: 2 μm for A1–C2 and c; 1 μm for a1–b2 and d1–h2.
Part 2.2. Nuclear landscapes in fibroblasts and cloned preimplantation embryos observed with 3D structured illumination microscopy
Higher order arrangements of DAPI-stained chromatin studied by 3D structured illumination microscopy in bovine fetal fibroblast nuclei and cloned embryos
Next we employed 3D-SIM for a comparison of nuclear landscapes in bovine fetal fibroblasts and cloned embryos (Fig. 12). Our observations confirm and expand observations made with 3D-CLSM (compare Figs. 1 and 2). Changing nuclear landscapes during preimplantation development of cloned bovine embryos show striking similarities with the landscapes described above for in vitro fertilized embryos but also notable differences. The flat-ellipsoidal shape of bovine fetal fibroblast nuclei (Fig. 12, Panels A1 to A8) was transformed into a roundish shape in all nuclei of the cloned 8-cell embryo shown in (Fig. 12, Panels B1 to B8. Compared with bovine fetal fibroblast nuclei, visual inspection of nuclei in this embryo also suggested a more pronounced clustering of chromatin with a corresponding increase of the IC, including a major, sometimes irregularly shaped lacuna, which clearly exceeded the size of the largest IC-lacunas noted in fetal fibroblast nuclei, but which was generally smaller than major lacunas discovered in in vitro fertilized 8-cell embryos (compare Figures 1 and 2; Figure 12 B1 to B8; Supplementary Figure S1). IC-lacunas in bovine fetal fibroblast nuclei should not be confused with their large, irregularly shaped nucleoli stained with B23 (Fig. 12 A1, A3, A5, A7). Roundish nuclei with a major lacuna were classified as ENP-like. Occasional nuclei presented small, round nucleoli with an intensely stained rim of DAPI-stained DNA (see Figure 12, B5 for example). This nucleolar phenotype resembled nucleoli noted in nuclei of in vitro fertilized embryos but was starkly different from the very large, irregularly shaped nucleoli in fetal fibroblast nuclei, indicating a major structural reconfiguration of such nucleoli in cloned preimplantation embryos. At this point, we do not know whether nucleoli carried by the fibroblast nucleus are dissolved and replaced by new nucleoli emerging during major genome activation of cloned embryos. For comparison, Figure 12 C1–4 and D1–4 show 8 nuclei from trophectodermal cells recorded by 3D-SIM from a non-hatched (C1–4) and a hatched (D1–4) cloned blastocyst fixed at day 8. Large nucleoli, resembling nucleoli of bovine fetal fibroblasts with an irregularly shaped rim of DAPI dense DNA, were frequently seen in nuclei of cloned blastocysts and the large majority had adopted a typical ENC phenotype with higher order chromatin networks expanding throughout the nuclear space. A comparison of volumes of bovine fetal fibroblast nuclei with nuclei from cloned embryos shows a severalfold mean volume increase of embryonic nuclei, when embryos approached major genome activation at day 2 after SCNT, followed by a strong volume reduction during post-major EGA development at day 4 (accompanying publication Popken et al.35).
Figure 12.

Comparison of nuclear phenotypes from bovine fetal fibroblasts and cloned preimplantation embryos studied with 3D structured illumination microscopy. Panels A1–A8. Midplane SIM x/y-sections (left) and y/z-sections (right) from DAPI-stained fetal fibroblast nuclei indicate their common flat-ellipsoidal shape. DAPI-stained sections are shown together with immunostaining of nucleophosmin B23 (red) and of H3K4me3 (green) in A1, A3, A5 and A7. Corresponding sections with DAPI staining alone are presented in A2, A4, A6 and A8. Panels B1–B8. Midplane SIM x/y-sections (left) and y/z-sections (right) from DAPI-stained nuclei in a cloned 8-cell embryo demonstrate the transformation of the flat-ellipsoidal shape of fibroblast nuclei into a roundish shape with a more pronounced clustering of chromatin and the formation of a major lacuna, marked by asterisks (compare Figure 7, Panels J-Q). Panels C1–C4 and D1–D4. Four nuclei recorded by 3D-SIM from a cloned, non-hatched blastocyst (C1–C4) and 4 nuclei from a cloned, hatched blastocyst (D1–D4). These nuclei were present in cells, which maintained their connection during microdissection of the embryos for 3D-SIM (see Results and Extended Experimental Procedures) and likely represent trophectoderm nuclei. Bar: 4 μm in A1 representative for all Panels.
A comparison of all nuclei from the 2 cloned 8-cell embryos shown in Figs. 2 and 12 emphasizes the pronounced variability of nuclear phenotypes in different cloned embryos with identical cell numbers. Whereas all nuclei of the cloned embryo presented in Fig. 2 show – in close correspondence with ENPs of the in vitro fertilized embryo in Figure 1 – a major lacuna, surrounded by compact and well demarcated major chromatin bodies, nuclei of the cloned embryo in Figure 12 failed to show this complete ENP morphology, although most nuclei presented an ENP-like phenotype. The more pronounced variability of nuclear landscape changes during the development of cloned embryos may reflect problems of a proper structural remodeling of bovine fetal fibroblast nuclei, as well as the higher frequency of chromosomal missegregation events during early preimplantation development of cloned versus in vitro fertilized embryos (accompanying article by Popken et al.35).
H3K4me3, H3K9me3 and RNA polymerase II arrangements in fetal fibroblast nuclei
Fig. 13 presents typical SIM midplane sections of DAPI-stained bovine fibroblast nuclei together with immunostainings of H3K4me3 (green) and nucleophosmin B23 (red) (Panel A), of H3K4me3 and RNA polymerase II-Ser2p (red) (Panel B) and of H3K4me3 and H3K9me3 (red) (Panel C). H3K4me3 labeled chromatin appeared dispersed throughout the nuclear interior. This epigenetic mark was enriched in chromatin lining IC-lacunas together with RNA polymerase II (Panels A/a and B/b) but not detected in the interior of nucleoli (Panel A) and only occasionally noted in the layer of intensely DAPI-stained DNA contacting the nuclear lamina. In addition to dispersed H3K9me3 labeled chromatin, we observed large H3K9me3 positive major chromatin clusters (Panels C/c/d). They often revealed a rim, which was intensely DAPI and H3K9me3 stained (c1, d1). These clusters may represent chromocenters and should not be confused with major chromatin bodies, which likely represent CTs (see above).61 Notably, H3K4me3 labeling inside and outside these clusters had approximately the same intensity, whereas RNA polymerase II-Ser2p was absent inside these clusters (b2). The variation of the intensity of H3K4me3 signals inside and outside these clusters was more pronounced in cloned blastocysts (see below). The intensely DAPI-stained rims of these clusters were generally connected to the intensely DAPI-stained chromatin beneath the nuclear envelope. Clusters located in the nuclear interior were connected to the nuclear border by a highly concentrated chromatin bridge (yellow boxes in B2/B4). Lining of fibroblast nucleoli with B23 was interrupted at sites, where major chromatin clusters were in direct contact with nucleoli (a2).
Figure 13.

(See previous page). Topography of DAPI-stained chromatin, nucleophosmin B23, RNA polymerase II-Ser2p, H3K4me3 and H3K9me3 in nuclei of bovine fetal fibroblasts studied with 3D structured illumination microscopy. Panels A–C. SIM midplane x/y-sections of DAPI-stained bovine fibroblast nuclei (A1, B1, C1) and x/z-sections (A3, B3, C3) are shown together with corresponding immunostainings of H3K4me3 (green) and nucleophosmin B23 (red) (A2, A4), H3K4me3 and RNA polymerase II-Ser2p (red) (B2, B4), H3K4me3 and H3K9me3 (red) (C2, C4). A fine line marked by pairs of arrows in A2/A4, B2/B4 and C2/C4 indicates the sites of the respective x/z- and x/y-sections. All nuclei contain major chromatin domain clusters with a modestly DAPI-stained core and an intensely DAPI-stained periphery. Examples are framed by white boxes. The yellow boxes in B2 and B4 indicate a major chromatin cluster in the nuclear interior connected to chromatin at the nuclear border. Panels a-d. Enlargements of white boxed areas in the 3 nuclei show major chromatin clusters with a modestly DAPI-stained core (light blue) and an intensely DAPI-stained periphery (dark blue) (a1–d1), overlays of pixels representing immunostained markers are shown in the corresponding images a2–d2. Black pixels represent colocalization of the 2 immunostained markers. Panel a presents a major chromatin cluster, which interrupts the B23 stained rim of a nucleolus. Note also the lining of an IC lacuna with H3K4me3. Panel b indicates that the core part of the chromatin domain cluster is modestly labeled with H3K4me3 but lacks RNA polymerase II-Ser2p. IC-lacunas are lined with both H3K4me3 and RNA polymerase II-Ser2p. Panel c and d show intense H3K9me3 label enriched at the intensely DAPI-stained periphery of major chromatin clusters. Bars: 3 μm for A1–C4; 2 μm for a1–d2.
H3K4me3, H3K9me3 and RNA polymerase II arrangements in nuclei of cloned preimplantation embryos
Fig. 14 shows midplane SIM sections of 2 nuclei from a cloned 8-cell embryo (Panels A and B) and 2 nuclei from a cloned, hatched blastocyst (Panels C and D) and exemplifies topographical relationships between DAPI-stained chromatin (gray), H3K4me3 (green) and H3K9me3 (red), which were typically noted in ENP-like and ENP/C-like nuclei (Panels A and B) and in ENCs (Panels C and D). The 4 representative nuclei show prominent major chromatin clusters, all prominently labeled with H3K9me3, but some of them intensely, others only modestly stained with DAPI (for examples see Panels a to h). In intensely DAPI-stained major chromatin clusters seen in ENP- and ENP/C-like nuclei we noted very little H3K4me3 label, whereas in modestly DAPI-stained clusters additional H3K4me3 labeling appeared more pronounced (compare DAPI intensities with chromatin clusters in Panel c). Intensely DAPI-stained major chromatin clusters observed in ENCs of the cloned, hatched blastocyst showed little H3K4me3 label. In remarkable contrast, however, weakly DAPI-stained major chromatin clusters showed a strong enrichment of both H3K4me3 and H3K9me3 (compare DAPI intensities with chromatin clusters in Panel h).
Figure 14.
Topography of H3K4me3 and H3K9me3 observed with 3D structured illumination microscopy in nuclei from a cloned 8-cell embryo and a cloned blastocyst. Panels A and B. Midplane SIM sections from an ENP-like (Panel A) and an ENP/C-like nucleus (Panel B) recorded from a cloned 8-cell embryo with DAPI-stained chromatin (gray), H3K4me3 (green) and H3K9me3 (red). Panels C and D. Midplane SIM sections from 2 DAPI-stained ENCs of a cloned, hatched blastocyst with immunostaining of the 2 epigenetic markers. The 4 example nuclei show prominent major chromatin clusters, some of them intensely, others modestly stained with DAPI, but all prominently labeled with H3K9me3. Panels a to h. Enlargements of boxed areas demonstrate strongly H3K9me3 labeled major chromatin clusters, which cover both modestly and strongly DAPI-stained chromatin. In ENP- and ENP/C-like nuclei such clusters are surrounded by H3K4me3 labeled chromatin, but contain little H3K4me3 in their interior (Panels a-d). Black pixels denote colocalization events of H3K4me3 and H3K9me3 positive pixels, which mostly occurred at the periphery of a given major chromatin cluster. In ENCs of the cloned, hatched blastocyst we found numerous major chromatin clusters, modestly stained with DAPI and strongly labeled with both H3K4me3 and H3K9me3 (for examples compare e1/e2 and g1/g2). Panel h1/h2 shows 3 major chromatin clusters. Black pixels indicate colocalization of H3K4me3 and H3K9me3 throughout the interior of 2 modestly DAPI-stained clusters (upper left corner and bottom). An intensely DAPI-stained major chromatin cluster (upper right corner) shows only few black pixels indicating colocalization of H3K4me3 and H3K9me3 in its interior, and an enrichment at the periphery. Bars: 3 μm for A1-D2; 1 μm for a1–h2.
Figure 15 shows SIM midplane sections recorded in 2 ENP-like nuclei from a cloned, DAPI-stained 8-cell embryo with immunostaining of H3K4me3 and RNA polymerase II-Ser2p (Panels A and B), as well as 2 nuclei from a non-hatched cloned blastocyst (Panels C and D). Enlarged images of boxed areas in these nuclei (Panels a-h) demonstrate an enrichment of RNA polymerase II together with H3K4me3 in chromatin lining IC-lacunas, in line with observations described above for fetal fibroblast nuclei (Fig. 13, Panels B/b), as well as for ENPs and ENCs of in vitro fertilized embryos (Fig. 10). The observation of major chromatin clusters strongly labeled with H3K4me3 but not with RNA polymerase II in the ENC of the cloned, non-hatched blastocyst shown in Figure 15, panel D, however, suggests that this epigenetic mark can be enriched in chromatin, which is not or not yet actively transcribed. Fig. 16 shows that major chromatin clusters with a strong enrichment of H3K4me3 were consistently detected in nuclei (n = 17) recorded by 3D-SIM in this non-hatched blastocyst, whereas we did not observe this type in fetal fibroblast nuclei (n = 57) and only rarely in another cloned blastocyst studied after hatching (1 from 11 nuclei). Similar to fibroblasts, most nuclei in this hatched blastocyst did not show an increased H3K4me3 labeling intensity inside clusters marked strongly with H3K9me3 compared to areas outside these clusters. More studies of non-hatched and hatched blastocysts are necessary in order to decide whether the observed differences represent a differentiation event correlated with embryo hatching or whether these differences reflect a strong variability of major chromatin complexes between different cloned embryos, possibly correlated with differences in their developmental potentials.
Figure 15.
H3K4me3 and RNA polymerase II-Ser2p arrangements observed with 3D structured illumination microscopy in nuclei from a cloned 8-cell embryo and a cloned, non-hatched blastocyst. Panels A and B. SIM midplane sections recorded from an ENP-like nucleus (panel A) and an ENP/C-like nucleus (panel B) of a cloned, DAPI-stained (A1, B1) 8-cell embryo following immunostaining of H3K4me3 (green) and RNA polymerase II-Ser2p (red) (A2, B2). Panels C and D. SIM midplane sections from 2 DAPI-stained nuclei (C1, C2) from a cloned, non-hatched blastocyst demonstrate dispersed RNA polymerase II-Ser2p together with dispersed H3K4me3, as well as large, H3K4me3 labeled chromatin clusters (C2, D2), particularly prominent in D2 (compare Fig. 14, Panels D, G and H). Enlarged images of boxed areas in these nuclei (Panels a-h) show major chromatin clusters strongly marked with H3K4me3 but lacking RNA polymerase II-Ser2p. An enrichment of RNA polymerase II-Ser2p together with H3K4me3 is noted in chromatin lining IC-channels/lacunas. Bars: 3 μm for A1–D2; 1 μm for a1–h2.
Figure 16.
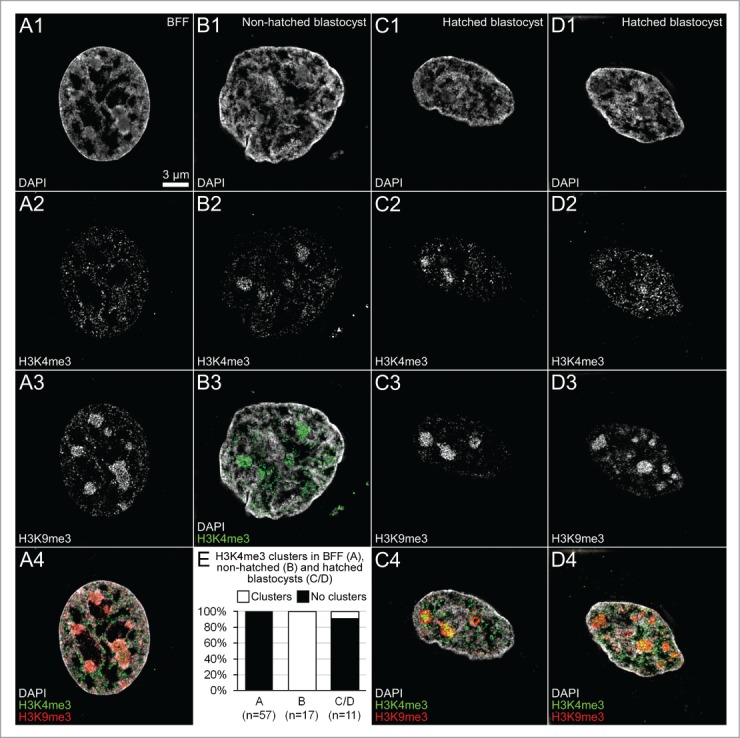
Differences between major chromatin clusters observed with 3D structured illumination microscopy in fetal fibroblast nuclei and nuclei from cloned, non-hatched and hatched blastocysts. Panel A. Corresponding midplane SIM sections from a typical DAPI-stained (A1) bovine fetal fibroblast nucleus with immunostained H3K4me3 (A2) and H3K9me3 (A3), overlay (A4; H3K4me3 green; H3K9me3 red) demonstrate numerous major chromatin domain clusters strongly labeled with H3K9me3 and sparsely with H3K4me3. Panel B. In contrast, the ENC recorded from a cloned, non-hatched blastocyst presents major chromatin domain clusters, strongly labeled with H3K4me3. Panels C and D. Two DAPI-stained ENCs (C1, D1) from a cloned, hatched blastocyst reveal major chromatin clusters strongly labeled with H3K9me3 (C3, D4), but differ with regard to H3K4me3 (C2, D2). Whereas this marker is apparently enriched in 2 of 3 clusters noted in one ENC (Panel C), no enrichment of H3K4me3 was detected in the major chromatin clusters present in the other ENC (panel D) similar to the pattern noted in the fibroblast nucleus (panel A). E. A quantitative assessment of the labeling patterns of major chromatin clusters in 57 fibroblast nuclei (A), 17 nuclei from cloned, non-hatched blastocysts (B) and 11 nuclei from cloned, hatched blastocysts (C, D) demonstrates the reproducibility of the similarities and differences of patterns described for the 4 example nuclei. Bar: 3 μm in A1 representative for all Panels.
Part 3. Quantitative analysis of similarities and differences between nuclear landscapes of in vitro fertilized embryos, cloned embryos and fetal fibroblasts
Frequencies of distinguished nuclear phenotypes in in vitro fertilized and cloned preimplantation embryos
Figure 17A provides a quantitative analysis of the frequencies of pre-ENPs, ENPs, ENP/Cs and ENCs analyzed in a total of 259 nuclei recorded with 3D-SIM in IVF embryos, including 9 embryos with 2 cells, 6 embryos with 3–4 cells, 7 embryos with 7–8 cells, 8 embryos with 9–15 cells and 6 embryos with more than 18 cells up to the morula stage (∼30 cells). In 17 nuclei recorded from 2-cell embryos pre-ENPs were the predominant phenotype (82%), although 18% of nuclei showed already a major lacuna and were classified accordingly as ENPs. In 22 nuclei recorded from embryos with 3–4 cells the percentage of pre-ENPs decreased to 27% and ENPs became predominant (73%). In addition to a major lacuna, 10% of nuclei also presented nucleoli, demarcated by a rim of intensely DAPI-stained DNA. This nucleolar phenotype was rarely noted in classical ENPs but marked the beginning of the transition from ENP to ENC after major genome activation (ENP/C). In 56 nuclei recorded from embryos with 7–8 cells 89% represented the ENP phenotype. After major embryonic genome activation the fraction of ENPs determined in 66 nuclei from embryos with 9 to 15 cells dropped to 48%, while the fraction of ENP/Cs and ENCs rose to 38% and 13%. Only one nucleus with the pre-ENP like phenotype was observed at this stage of preimplantation development. In 98 nuclei recorded from embryos with more than 18 cells to morula stage ENCs presented by far the dominant fraction (87%) and only few nuclei still showed an ENP or ENP/C phenotype. Figure 17B presents a quantification of pre-ENP-like, ENP-like and ENP/C-like nuclear phenotypes recorded in 40 nuclei from 5 cloned 8-cell embryos and 28 nuclei from 2 cloned blastocysts. The ENP-like phenotype was predominant at the 8-cell stage (48%), followed by the ENP/C-like phenotype (32%) and the pre-ENP like phenotype (20%). All nuclei studied at the blastocyst showed the ENC phenotype.
Figure 17.
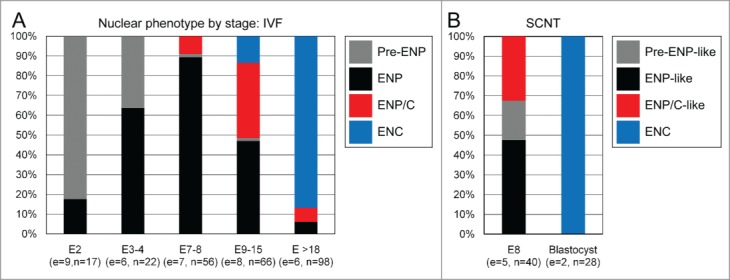
Quantitative assessment of different nuclear phenotypes recorded with 3D structured illumination microscopy during preimplantation development of in vitro fertilized and cloned embryos. A. Nuclei from 9 fertilized embryos with 2 cells (E2; 17 nuclei), 6 embryos with 3 or 4 cells (E3–4; 22 nuclei), 7 embryos with 7 or 8 cells (E7–8; 56 nuclei), 8 embryos between 9 and 15 cells (E9–15; 66 nuclei) and 6 embryos with more than 18 cells on their way toward the morula stage (about 32 cells) (E >18; 98 nuclei) were classified as pre-ENP, ENP, ENP/C and ENC according to the criteria described in Results and the examples presented in Figure 7. B. Classification of nuclei from 5 cloned 8-cell stage embryos (E8; 40 nuclei) and 2 blastocysts (28 nuclei) as pre-ENP-like, ENP-like, ENP/C-like and ENC was performed as described in Results.
Linking topological chromatin density mapping of the nuclear landscape with H3K4me3, H3K9me3 and RNA polymerase II arrangements
For a quantitative comparison of the nuclear topography of the functionally relevant hallmarks H3K4me3, H3K9me3 and RNA polymerase II with the topography of DAPI-stained chromatin, we employed a segmentation algorithm, previously developed for DAPI-stained nuclei.37,40 DAPI positive pixels in SIM sections were segmented into 7 DAPI intensity classes with equal intensity variance. This classification provided a clear visualization of nuclear landscapes shaped by color-coded DAPI intensity classes and allowed for a statistical comparison both between individual nuclei and between different areas within individual nuclei.
Fig. 18 presents midplane sections with color-coded DAPI intensity classes from typical nuclear phenotypes recorded with 3D-SIM from in vitro fertilized embryos (Panels A–E) and cloned embryos (Panels F–J). As noted above, images of DAPI-stained nuclei were routinely displayed after thresholding to remove artifacts due to patterns of concentric rings (see Fig. 6). All pixels below the chosen threshold are counted as class 1 pixels. Panels A-J show nuclear arrangements of color-coded DAPI intensity classes for both thresholded (A1–J1) and unthresholded nuclei (A2–J2).
Figure 18.
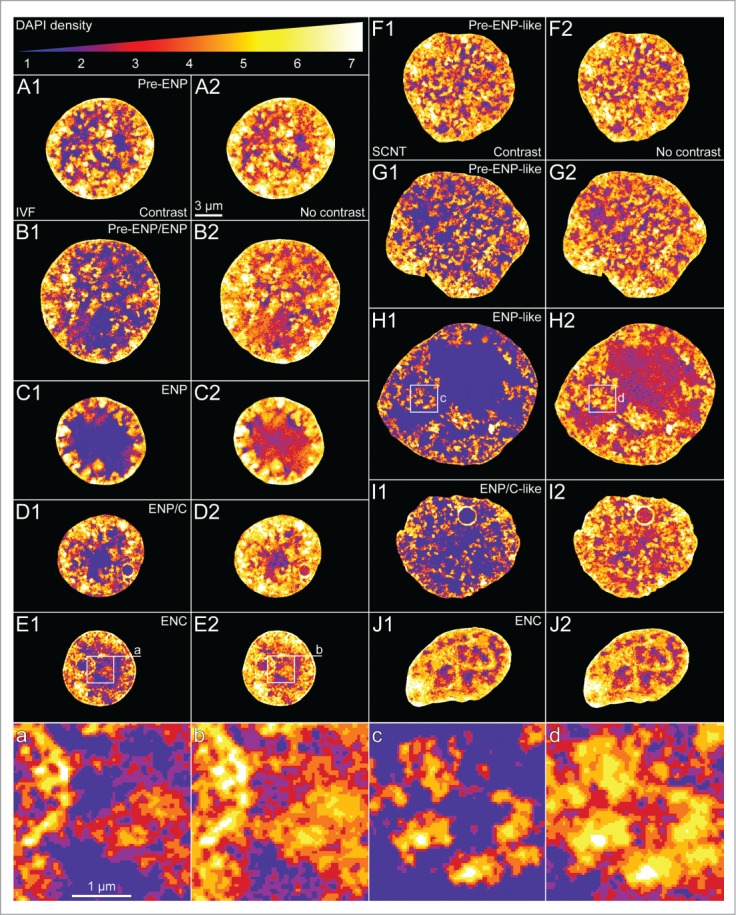
(See previous page). Typical examples of nuclei with color-coded DAPI intensity classes recorded with 3D structured illumination microscopy in in vitro fertilized and cloned embryos. Panels A–E. Midplane SIM sections with color-coded DAPI intensity classes 1 to 7 from typical nuclear phenotypes observed in in vitro fertilized embryos (A, pre-ENP; B, transition from pre-ENP to ENP; C, ENP; D, ENP/C; E, ENC). Classes 1 to 7 present increasing DAPI intensity. The color code is presented at the top. Class 1 coded blue, class 2 purple, class 3 dark red, class 4 light red, class 5 orange, class 6 yellow and class 7 white. A1-E1 provide color-coded SIM sections after thresholding to remove patterns of concentric rings and diffuse background (see Fig. 6). A2–E2 show the same sections before thresholding. Note that the size of the areas occupied by the lowest DAPI density classes, in particular class 1, are strongly increased in thresholded compared to non-thresholded sections. For quantitative assessments of the nuclear topography of RNA polymerase II, H3K4me3 and H3K9me3 arrangements presented in Figure 19 with respect to these DAPI intensity classes we used non-thresholded, color-coded SIM sections (for further details see Supplementary Fig. S4, Results and Extended Experimental Procedures). Panels F–J. Midplane SIM sections with color-coded DAPI intensity classes from typical nuclear phenotypes observed in cloned embryos (F, pre-ENP-like; G, transition from pre-ENP to ENP-like state; H, ENP-like; I, ENP/C-like; J, ENC), F1–J1 and F2–J2, color-coded SIM sections after and before thresholding. Panels a-d. Enlarged views of boxed areas depicted in 2 example nuclei (E1/E2, H1/H2) are presented in panels a/b and c/d. The enlarged box from the ENP-like nucleus shown in c demonstrates particularly well chromatin domain clusters (CDCs), separated by IC-channels (blue). Red color in the periphery of CDCs signifies less compact DAPI-stained chromatin, yellow and white colors more compacted DAPI-stained chromatin in the core part of CDCs. The strong difference between thresholded and corresponding non-thresholded images emphasizes limitations of our current approach with regard to the resolution achieved with 3D-SIM and the sensitivity of DAPI staining to distinguish unequivocally between chromatin and DNA-free parts of the interchromatin compartment. Bars: 3 μm for A1–J2; 1 μm for a-d.
Linking of DAPI density mapping with H3K4me3, H3K9me3 and RNA polymerase II arrangements was performed with unthresholded nuclei (exemplified in Fig. 18A2–J2). This approach stretched DAPI intensity classes over the widest possible range (compare Supplementary Figure S4). In non-thresholded DAPI images classes 1–3 apparently represented the interchromatin compartment, classes 4 and 5 preferentially the less intensely DAPI-stained periphery of chromatin domain clusters (CDCs), called the perichromatin region (PR) (see Introduction and Discussion) and classes 6 and 7 preferentially the intensely DAPI-stained core regions of CDCs. Class 1 (blue) is strongly increased in the thresholded nuclei.
Fig. 19 shows the results of a quantitative high-resolution analysis of RNA polymerase II, H3K4me3 and H3K9me3 positive pixels attributed to the 7 DAPI intensity classes from unthresholded ENPs and ENCs of in vitro fertilized embryos (including a few early stages of ENP/Cs) (Fig. 19A and B), ENP-like nuclei and ENCs from cloned embryos (Fig. 19C and D) and fetal fibroblast nuclei (Fig. 19E). Care was taken to correct for any shifts between the channels used for recording DAPI and the additional pairwise recording of H3K4me3 and H3K9me3 or H3K4me3 and RNA polymerase II. In each sample 3 – 6 sequential, mid-nuclear SIM sections were evaluated from a total of 20 nuclei, including 10 nuclei with immunostained H3K4me3/H3K9me3 (cloned ENP-like n = 7) and 10 nuclei with immunostained H3K4me3/RNA polymerase II (cloned ENP-like n = 8; for further details see Supplementary Information: Extended Experimental Procedures). We tested the null hypothesis of a random distribution of H3K4me3, H3K9me3 and RNA polymerase II positive pixels across the 7 DAPI intensity classes. For a random distribution the fraction of marker pixels should equal the fraction of DAPI positive pixels representing each class. In all samples the null hypothesis could be rejected with a very high probability (P < 10−15).
Figure 19.
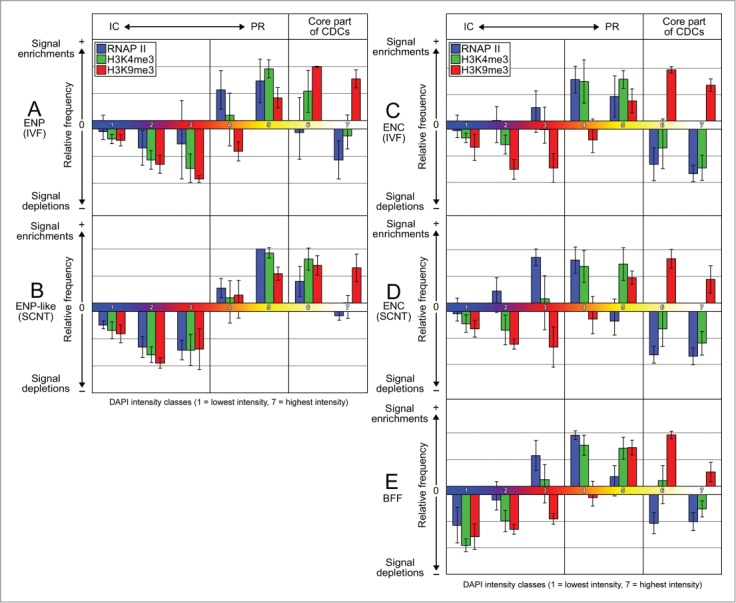
Quantitative analysis of topographical relationships between DAPI-stained chromatin, H3K4me3, H3K9me3 and RNA polymerase II in nuclei from in vitro fertilized embryos, cloned embryos and fetal bovine fibroblasts. A. ENPs from in vitro fertilized embryos (n = 20). B. ENCs from in vitro fertilized embryos (n = 20). C. ENP-like nuclei from cloned embryos (n = 15). D. ENCs from cloned embryos (n = 20). E. Nuclei from growing, non-synchronized fetal bovine fibroblast cultures (n = 20). For each sample A – E our analysis comprised 10 nuclei immunostained for H3K4me3 and H3K9me3 (cloned ENP-like n=7) and 10 nuclei immunostained for H3K4me3 and RNA polymerase II (cloned ENP-like n=8). In each nucleus 3 to 6 consecutive mid-nuclear SIM sections were analyzed. For each nucleus 7 DAPI intensity classes were distinguished in unthresholded midplane sections covering the entire range from lowest to highest pixel intensity values (Fig. 18; for details see Supplementary Information: Extended Experimental Procedures). The height of columns presents a relative measure for the overrepresentation (+) or underrepresentation (-) of H3K4me3 (green), H3K9me3 (red) and RNA polymerase II (blue) positive pixels, respectively, calculated as the relative frequency of such pixels in comparison to the number of DAPI positive pixels attributed to classes 1 to 7. For all tested combinations of DAPI, H3K4me3 and RNA Polymerse II thresholds (compare Supplementary Figs. S2, S3 and S4) the null-hypothesis of a random class assignment was rejected (P < 10−15). A comparison of A-E indicates striking similarities of local RNA polymerase II, H3K4me3 and H3K9me3 assignments to the 7 DAPI intensity classes despite the striking differences between the global nuclear architectures of ENPs and ENP-like nuclei compared with ENCs and fibroblast nuclei. The overrepresentation of RNA polymerase II signals in class 4 (P < 10−14) of ENPs, ENP-like nuclei, ENCs and fibroblast nuclei supports the hypothesis that the major transcriptionally active nuclear compartment is located at the periphery of chromatin domain clusters, called the perichromatin region (PR) (compare Fig. 18). In ENPs and ENCs of in vitro fertilized embryos (A, B) the immunostained RNA polymerase II carried a C-terminal domain (CTD) with a phosphorylated serine 5 (Ser5p), whereas the polymerase immunodetected in ENP-like nuclei and ENCs from cloned embryos (C, D), as well as fibroblast nuclei (E) carried a CTD with a phosphorylated serine 2 (S2P). The topography of RNA polymerase II in relation to the 7 DAPI intensity classes was essentially the same for both serine 2 and 5 phosphorylations.
Figure 19 demonstrates a highly non-random and consistent pattern of RNA polymerase II, H3K4me3 and H3K9me3 in all samples despite the strikingly different global nuclear landscapes of ENPs and ENP-like nuclei compared with ENCs and fibroblast nuclei. DAPI intensity classes 6 and 7 showed a significant enrichment of H3K9me3 with a higher accumulation in class 6, whereas a distinct depletion was typically found in class 7 for H3K4me3 and RNA polymerase II. These 2 markers were consistently enriched in class 4. In contrast, all 3 markers were depleted in class 1. In our analyses of in vitro fertilized embryos we studied RNA polymerase II with a phosphorylated serine 5 of its CTD domain, while analyses of cloned embryos and fetal fibroblasts were carried out with RNA polymerase II carrying a phosphorylated serine 2. A noticeable difference between the nuclear arrangements of the 2 enzyme modifications was not detected. The patterns described in Figure 19 were robustly supported for a range of thresholds applied to SIM sections of immunostained markers (Supplementary Fig. S4; for further details see Extended Experimental Procedures) despite the fact that the size and abundance of immunopositive pixel clusters for RNA polymerase II, H3K4me3 and H3K9me3 was affected by the choice of low, medium and high thresholds (Supplementary Figs. S2 and S3).
The comparison of nuclear samples from in vitro fertilized and cloned embryos was complicated by major chromatin clusters strongly marked with H3K4me3, H3K9me3 or both. We noted such clusters in both types of embryos but they appeared particularly prominent relative to the nuclear volume in the small ENCs of cloned blastocysts. Supplementary Figure S5 presents a separate analysis of immunopositive pixels present in individual strongly H3K9me3 decorated major chromatin clusters to the 7 DAPI intensity classes. Supplementary Figure S6 provides such an analysis for major chromatin clusters decorated with H3K4me3. These Supplementary Figures indicate a pronounced variability of the topography of H3K9me3 and H3K4me3 in different major chromatin clusters even within the same nucleus. For the evaluation of ENPs and ENCs from in vitro fertilized embryos and ENP-like presented in Figure 19A, B entire SIM sections were used, since the modest presence of major chromatin clusters did not make any important difference relative to the nuclear volume. For the evaluation of ENCs from cloned blastocysts shown in Figure 19C, D we deliberately analyzed sections with few if any major chromatin clusters to ensure that the analysis represents the signal distribution in the interchromatin compartment, perichromatin region and core regions of CDCs (see above).
In summary, despite major differences of the global landscapes the detailed inspection of SIM-images (Figs. 10– 15) and quantitative image analyses (Fig. 19) indicate for all types of nuclei a local accumulation of H3K9me3 in the core of chromatin domain clusters and of H3K4me3 and RNA polymerase II in the less intensely DAPI-stained periphery of these clusters, whereas these markers were depleted in the interchromatin compartment.
Discussion
Preimplantation development of in vitro fertilized and cloned embryos is accompanied by massive changes of nuclear landscapes
Major embryonic genome activation occurs at the 8-cell stage of in vitro fertilized bovine embryos.27 A major change of the gene expression status may also occur in cloned 8-cell bovine embryos as suggested by the activation of pluripotency genes at this stage.25 In vitro fertilized and cloned bovine embryos approaching the 8-cell stage were characterized by the formation of a major lacuna, enriched in splicing factors, and presumably many other storage factors, whose nuclear topography was not tested in the present study. Occasional DAPI or TO-PRO-3 stained chromatin bodies were found in the interior of the major lacuna, but otherwise current evidence suggests that these lacunas constitute a rather DNA-free space. DNA staining with these compounds may, however, not suffice to exclude occasional giant chromatin loops, penetrating from peripheral CTs deep into the major lacuna. The peripheral chromatin surrounding major lacunas presented itself as major chromatin bodies (MCBs), separated from each other by wide interchromatin compartment (IC) channels, whereas smaller IC-channels pervaded the interior of MCBs as well. Chromosome painting experiments identified individual MCBs as distinct chromosome territories (CTs).19 For nuclei with this phenotype we introduced the term ENP (for Embryonic Nucleus with Peripheral distribution of CTs). Although typical ENPs were also noted in cloned 8-cell embryos, the major lacuna was often smaller and the corresponding shift of chromatin toward the nuclear periphery, as well as chromatin compaction was less pronounced. To account for such differences – notwithstanding the striking similarities of these nuclear phenotypes in in vitro fertilized and cloned embryos – we designated the phenotype of such nuclei as ENP-like.
Preimplantation development after major EGA was characterized in both in vitro fertilized and cloned embryos by the disappearance of the major lacuna and the formation of much smaller nuclei with a 3D higher order chromatin network expanding throughout the entire nuclear space. We called nuclei with this phenotype ENCs (for Embryonic Nuclei with Conventional architecture), because they adopted common features of nuclear landscapes, previously described for a variety of somatic cell types.6,40
To our best knowledge, the ENP phenotype was first described in an EM study of 8-cell bovine IVF embryos.62 The authors argued for a difference in the distribution of major chromatin bodies between nuclei from IVF embryos and nuclei from conventionally fertilized embryos obtained from cows at slaughter. In these in vivo embryos they observed a distribution of MCBs throughout the nuclear space. It is not clear, whether a systematic difference between nuclear phenotypes in IVF and in vivo embryos truly exists or whether this difference reflects slightly different developmental stages of IVF and in vivo generated embryos.
The observed coincidence of major embryonic genome activation and the formation of rather compact CTs, separated by wide IC-channels, in in vitro fertilized 8-cell embryos was an unexpected finding.27 We would rather have expected a correlation of major EGA with a more decondensed state of CTs. Surprisingly, the rather compact CTs detected in ENPs share structural similarities with senescence associated heterochromatic foci (SAHF) observed in human fibroblast cultures at the end of their replicative life span as well as in CTs driven into a senescence-like state after exposure with the thiodioxopiperazine metabolite chaetocin.63,64 Like ENPs, senescent fibroblasts formed CTs separated from each other by wide IC-channels but lacked a major central lacuna. A functional compartmentalization with transcriptionally competent chromatin at the periphery and silenced chromatin in the compact interior of SAHFs and SAHF-like chromatin bodies was consistently observed.63,64 The picture in ENPs is more heterogeneous. Some major chromatin bodies observed in ENPs of in vitro fertilized embryos and ENP-like nuclei of cloned embryos presented a compact core with H3K9me3, surrounded by H3K4me3 labeled, peripheral chromatin, others were highly enriched in H3K4me3 distributed throughout the entire territory and still others revealed little H3K4me3 and H3K9me3 immunopositive labeling.
Incorporation of BrUTP or BrU demonstrated de novo RNA synthesis both in ENPs of in vitro fertilized embryos and ENP-like nuclei of cloned embryos. Notably, previous studies have demonstrated de novo RNA synthesis already during minor genome activation, which occurs in bovine embryos already at the 2-cell stage. The total amounts of such RNA may be even larger than de novo RNA synthesis at the 8-cell stage.65 Major embryonic genome activation at the 8-cell stage is characterized by a steep increase in the number of transcribed genes.27 From 6848 genes, which were found to be switched on from the 4-cell to the blastocyst stage, 3965 (58%) were activated at the 8-cell stage.
Functional nucleoli, characterized by a surrounding rim of compact chromatin and intense RNA synthesis, were common in nuclei of both in vitro fertilized and cloned embryos, which had passed the 8-cell stage, i.e. studied during post-major EGA development. They were rarely noted in ENPs of in vitro fertilized embryos, though more frequently in ENP-like nuclei of cloned embryos. Data available from our recently published transcriptome analysis27 were further analyzed in the present study with a focus on genes involved in the formation of ribosomal proteins. This analysis confirmed a major rise of intronic sequences from such genes from the 8-cell stage to the blastocyst stage.
We found impressive differences in the clustering of H3K4me3 and H3K9me3 in both in vitro fertilized and cloned preimplantation embryos, but are not able to decide to which extent these differences may reflect true changes in the topography of the respective epitopes or effects of differential epitope masking. In any case, the extent of such changes and internuclear variability, observed even between nuclei of the same embryo, emphasize the importance to study the dynamics of nuclear architecture in space and time at the single cell level.
For a quantitative comparison of the nuclear topography of transcriptionally competent chromatin (H3K4me3), transcriptionally silent chromatin (H3K9me3) and RNA polymerase II with regard to the topography of DAPI-stained chromatin, we defined 7 DAPI intensity classes. This classification provided a clear visualization of nuclear landscapes shaped by color-coded DAPI intensity classes and allowed for a statistical comparison both between different areas of individual nuclei and different samples of nuclei. These analyses demonstrate major similarities and differences between nuclear landscapes of in vitro fertilized and cloned preimplantation embryos, as well as fetal fibroblasts used for somatic cell nuclear transfer. Notably, the overall patterns of relative enrichments and depletions of H3K4me3, H3K9me3 and RNA polymerase II positive pixels over the 7 DAPI intensity classes were similar for ENPs, ENP-like nuclei, ENCs studied in in vitro fertilized and cloned embryos as well as for nuclei of fetal fibroblasts. In all samples, DAPI intensity classes 6 and 7, representing the core of chromatin domain clusters (CDCs), showed an enrichment of H3K9me3. In contrast, H3K4me3 and RNA polymerase II were consistently enriched in class 4, representing the less intensely DAPI-stained periphery of these CDCs, whereas all 3 markers were consistently depleted in class 1, representing the rather DNA-free parts of the interchromatin compartment.
Our study provides robust evidence for highly significant enrichments of H3K4me3 and RNA polymerase II clusters at the periphery of CDCs, whereas H3K9me3 was enriched in their interior. Multiple RNA polymerases II have been described as integrative parts of transcription factories.66 For immunodetection of RNA polymerase II we used antibodies detecting either a phosphorylated serine 2 (S2p) or serine 5 (S5p) in its C-terminal domain. The S2p modification is considered as a marker for RNA polymerase II involved in elongation, whereas RNA polymerase II-S5p occurs early in the transcription cycle.67,68 Independent of whether RNA polymerase II carried the S2p or S5p modification, we consistently found an enrichment at the periphery of CDCs. This observation, however, does not exclude the presence of some RNA polymerase II at numerous other locations, including heterochromatic regions.
Major chromatin clusters showed a pronounced variability of their labeling patterns. We observed major chromatin clusters in ENPs from in vitro fertilized embryos that were predominantly labeled either with H3K4me3 or H3K9me3, whereas others showed only sparse evidence for the presence of either marker. It is not clear whether clustering of these epigenetic marks occurs as a transient phenomenon in all CTs or only in specific CTs or whether clusters may also represent chromatin from several neighboring CTs. The reconfiguration of nuclear landscapes during post-major EGA development of in vitro fertilized embryos into ENCs was characterized by a dispersed distribution of H3K4me3 throughout the nuclear space, while large H3K9me3 positive chromatin clusters were maintained. ENP-like nuclei in cloned embryos also showed major clusters labeled with either H3K9me3 or H3K4me3, though the latter were less pronounced compared with ENPs. Large clusters with both H3K4me3 and H3K9me3 label were also observed in ENCs of cloned embryos, in contrast to fetal fibroblast nuclei which consistently showed H3K9me3 labeled major chromatin clusters and a dispersed pattern for H3K4me3. The highly variable patterns of these histone modifications in particular in ENPs may reflect their impact on fine tuning of rapidly changing expression levels in multiple genes at this developmental stage. An attempt of a functional interpretation of such differences has also to take into account the high frequency of chromosome missegregations, which occurs during preimplantation development (see accompanying article by Popken et al.35). Even for mammalian embryos, which develop normally beyond the preimplantation period, this period is marked by the frequent failure of individual cells to grow and divide properly.69 The elimination of such cells by apoptosis or mitotic cell death is a typical part of normal embryonic development, but occurs at much higher frequencies in cloned embryos (see accompanying article by Popken et al.35).70-72 It will be interesting to investigate, whether some of the structural features described in this study have predictive value for the normal or abnormal development of a given embryonic cell, but it is not possible at this point to describe the sequence of structural events, which are connected with a normal development at the single cell level.
The global structural transformation of the large ENPs into smaller ENCs may be correlated or even causally connected with the long-term replicative potential of embryonic cells. Notably, ENPs were rarely seen at the blastocyst stage and it was observed that cells carrying a persistent ENP phenotype during post-major EGA development became TUNEL positive, a hallmark for apoptosis.73 The massive reorganization of nuclei during preimplantation development of in vitro fertilized and cloned embryos with large scale movements of CTs extends current evidence for major differentiation-dependent changes of nuclear landscapes. Mammalian rod cell nuclei provide a case for a massive reorganization during postmitotic-terminal cell differentiation during the course of several weeks.74 Other studies report large scale movements of specific chromatin segments in interphase nuclei within time scales of several minutes.75-78 The mechanisms necessary for these movements have not yet been clarified and may act both from inside and outside the nucleus.79,80
A model for a functional nuclear architecture based on co-aligned, 3-dimensional networks of inactive and active nuclear compartments
In Figure 20A–C we make an attempt to integrate both our current observations and findings reported in the literature into a refined version of the chromosome territory-interchromatin compartment (CT-IC) model (see Introduction).42,43 While chromosome territories are now generally accepted as a basic feature of nuclear landscapes in animals and plants, this is not the case for the interchromatin compartment. Since an interchromatin space exists between any local chromatin configuration, be it a cluster of chromatin fibers or neighboring domains, it is a question of definition what fraction of the entire interchromatin space in a given cell nucleus is attributed to the interchromatin compartment. In the model shown in Figure 20 we consider only the channels expanding between CDCs as part of the interchromatin compartment. Such a distinction depends on functional considerations and is open to modifications, when further methodological advancements will help to study the structure-function conundrums of chromatin domains with increased resolution. We propose a structurally highly ordered active nuclear compartment (aNC) with closely integrated functional interactions between the interchromatin compartment and the perichromatin region of chromatin domain clusters, whereas the interior of these clusters represents the transcriptionally inactive nuclear compartment (iNC). The active NC and iNC are structurally and functionally interconnected. The co-aligned 3D networks of the iNC and aNC may be compared with a natural landscape, where brushwood growing at the shore zone invades the interior of an interconnected system of little streams and ponds (Fig. 20D). This comparison seems more appropriate than a system of tubes with sharply defined borders. Small chromatin loops may expand from the perichromatin region into the interior of these channels or even penetrate throughout entire channels. Although we lack evidence, how big such loops may be and how they may be ordered within the aNC, a topography, which minimizes problems of chromatin entanglements was likely favored by natural selection during the evolution of larger genomes. Similarly, like the shore zone interacts with the land outside, dynamic interactions occur between the aNC and iNC, including local repositioning of chromatin between the aNC and iNC during transcription, replication and repair. Continuous, constrained movements of clustered chromatin at all levels from nucleosomes, individual ∼1 Mbp CDs to entire CTs enforce continuous changes of intermediary spaces, including the width of IC-channels and lacunas, and provide possibilities for dynamic changes of chromatin interactions.81-83 The concept of an interchromatin compartment as a major player by itself in the functional organization, which interacts structurally and functionally with the perichromatin region should not be confused with the trivial notion of an interchromatin space between all sorts of chromatin fibers.
Figure 20.
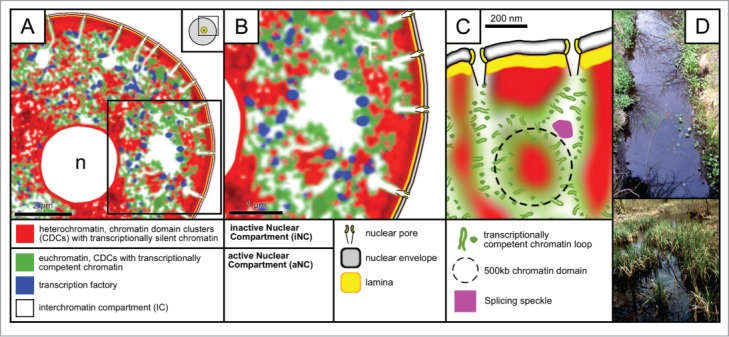
A high-resolution model view of the functional nuclear landscape. Evidence stems in part from the present study and in part from the literature (see Discussion). (A and B) Representative landscape of an ENC. B shows an enlargement of the boxed area in A. CTs are built up from interconnected basic chromatin domains with a DNA content in the order of a few hundred kbp, which form higher order chromatin structures, such as chromatin domain clusters (CDCs), chromosome arm and band domains (for further details see Discussion). Identification of individual structures in microscopic images requires their individual visualization. CDCs carry transcriptionally silent chromatin (red) in their interior. The less dense, transcriptionally competent chromatin (green) at the periphery of CDCs presents the perichromatin region (PR). It is enriched with transcription factories (blue) and represents the nuclear sub-compartment, where genes are transcribed. The PR lines the interchromatin compartment (IC), which starts with channels at nuclear pores and forms a 3-dimensional network throughout the nuclear interior. It extends between neighboring CTs but also throughout CTs. At numerous sites the IC forms larger lacunas, which contain nuclear bodies, such as splicing speckles. Considering the potential role of the IC in import-export functions, as well as functional interactions between nuclear bodies and machineries for transcription, co-transcriptional splicing, chromatin replication and repair acting within the PR, we propose that the PR and the IC provide the active nuclear compartment (aNC), whereas the compact interior of CDCs forms the inactive nuclear compartment (iNC). The nucleolus in A is marked with ‘n’. (C). This model presents a hypothetical topography at still higher resolution envisaged for a landscape at the nuclear periphery with nuclear pores connected to IC channels. Little chromatin loops invade these channels, their size and hypothetical arrangements minimize problems of chromatin entanglements in the perichromatin region and interchromatin compartment. A dotted circle comprises a chromatin domain with a DNA content of about 500 kbp. Chromatin domains attached to the nuclear lamina (yellow) are connected with domains extended into the nuclear interior (D). Comparison of the nuclear landscape shown in C with little streams and ponds pervading a natural landscape. Note some vegetation expanding from embankments into the inner part of streams and ponds (images recorded in the Spreewald southeast of Berlin and provided by courtesy of Marion Cremer). Bars: 2 μm for A; 1 μm for B; 200 nm for C.
In line with microscopic studies, recent high-resolution chromosome conformation capture (Hi-C) studies demonstrate the clustering of chromatin from the level of entire CTs down to megabase-sized chromatin domains.9,84 These studies identified megabase-sized, topological domains (TDs) as an evolutionary conserved property of mammalian higher order chromatin architecture.84 Individual topological domains are characterized by extensive interactions, whereas fewer interactions were found between neighboring domains.9,84 We take also into account the evidence for megabase-sized, gene-rich and gene-poor isochores found across a wide range of eukaryote species.85 Linked TDs may generate larger gene-rich, transcriptionally active and DNase hypersensitive compartments, as well as gene-poor, transcriptionally silent, and DNase I insensitive compartments.86 It is tempting to speculate that TDs, isochores and microscopically observed megabase-sized chromatin domains (∼1 Mbp-CDs) represent at least to some extent the same basic units of CT architecture. For TDs a median size of several hundred kb was calculated, while a small remaining fraction with a size of <50 kb was termed ‘boundary regions’.84 In case of an allocation of a diploid mammalian genome into ∼1 Mbp-CDs we would expect a total number of roughly 6000 domains. Remarkably, a study with improved optical 3D resolution identified 3- to 5-fold more distinct replication foci than previously reported suggesting an average DNA content of a few hundred kbp rather than the ∼1 Mbp chromatin domains suggested from previous studies.87 Foci varied in size from 210 nm down to 40 nm with an average size of 125 nm that was conserved throughout S-phase.87 We conclude that current estimates for the size of TDs and replication foci are in close agreement and predict that these domains form larger chromatin domain clusters (CDCs), which are integrated into chromosome band domains, chromosome arm domains and finally into entire CTs.6 We postulate a non-random, radial positioning of regulatory and transcribed sequences toward the periphery of chromatin domain clusters (CDCs) to ensure direct access to the finest branches of the interchromatin compartment. The fractions of the nuclear volume, occupied by CDCs and the interchromatin compartment vary widely in different cell types.
Differences between nuclei with regard to the space occupied by the interchromatin compartment reflect to some extent differences of chromatin compaction.38,88 This was experimentally verified by showing that a brief incubation of living, cultured cells in hyperosmolar medium triggered the formation of hypercondensed chromatin with a corresponding increase of the interchromatin compartment, although nuclear volumes even decreased in this case.88 This effect was fully reversible, when cells were again incubated in normotonic medium. The most extreme case of chromatin domain compaction has been predicted by the polymer melt model, which has put doubts on the role of 30 nm thick chromatin loops in the formation of chromatin domains.89,90 Whatever the true organization of CDCs and chromatin domains may be, we expect that a dynamic organization of these structures is required by functional necessity. Given the constrained movements of CTs, CDCs and chromatin domains, which occur continuously in the nucleus of a living cell, the width of IC-channels also changes continuously establishing numerous opportunities for transient spatial interactions between individual higher order structures. In line with dynamic changes we expect the formation of more or less space even between chromatin located in the interior of CDCs.
Differences in chromatin compaction, however, do not suffice to explain the huge variation in the size of the interchromatin compartment. We assume that the formation of a major lacuna as part of the interchromatin compartment of ENPs was prompted by a necessity of a large storage capacity for factors important for the survival of embryos at a time, when the further development of embryos depends on proteins and RNAs provided by the oocyte.27 Accordingly, differences of the extent and width of IC-channels and lacunas between ENPs and ENCs likely reflect different amounts of macromolecules stored in the interchromatin compartment. The formation of a major lacuna may generate a mechanic force yielding a shift of CTs toward the nuclear periphery and possibly also to a higher overall compaction of CTs. However, the occasional observation of nuclei in embryos approaching major EGA, which failed to generate a major lacuna, but showed compact and well separated CTs, rather suggests that chromatin compaction is regulated by mechanisms acting directly on chromatin. Increased chromatin compaction can enforce a relative expansion of the interchromatin compartment.
In view of the limitations of current evidence the model shown in Figure 20 should be regarded as an inevitable oversimplification. In addition to densely compacted silent chromatin the interior of chromatin domain clusters may still contain some transcriptionally competent chromatin. In order to become transcriptionally active, relocation of such chromatin into the PR may be required. Alternatively, finest IC-channels may expand and guide factors relevant for transcription and other functions into the interior of CDCs. The resolution of the current 3D-SIM study does not suffice to describe how chromatin domain clusters are organized in detail. We also wish to emphasize that this view is static and does not explain dynamic interactions between the aNC and the iNC. Despite these limitations, this view has the benefit to provide a coherent interpretation for a wide set of data presented both in this study and the literature, and may stimulate further experimental tests (see below, Perspectives).
Perspectives
Efforts to understand the structure and interactions of individual macromolecules (DNAs, RNAs and proteins) must be complemented by efforts to understand the large scale organization of the cell nucleus. The CT-IC model and other current models should be understood as attempts to provide a coherent view of structural and functional aspects of nuclear organization, including the structural organization and functional interactions of CTs.84, 91-99 We have attempted to provide a model view, drawn to scale, but given the methodological limitations of our study, this view may turn out to be misleading or even flatly wrong in some aspects – the usual fate of models in science. Understanding the functional nuclear organization in space and time requires advancements in understanding structure-function interactions at all levels of nuclear organization from molecules to the entire system. The long term goal of these efforts is the decipherment of universally valid, as well as species and cell-type-specific rules of nuclear architecture and their evolutionary origins. Evidence for conserved features throughout the whole range of eukaryotes, including comparisons with nucleoids in prokaryotes as outgroups, should pave the way for the discovery of major selective constraints during the evolution of large genomes.
A solid descriptive basis of nuclear landscapes during development and differentiation sets the stage for studies of molecular mechanisms involved in the space-time organization of nuclei adapted to their functioning in a large set of cell types. Profound changes of nuclear architecture during early mammalian embryonic development (our present study) and terminal cell differentiation demonstrate the complexity of nuclear dynamics and their adaptive benefits for different functional tasks.74 Clearly, changes of nuclear landscapes do not follow a simple deterministic pattern, but show an unexpected amount of variation even among cells of the same, distinct cell type. This variation may to some extent be of a stochastic nature but also reflect environmental influences starting with local influences from neighboring cells to general influences exerted within and outside a given organism. Single cell analyses are indispensable to explore this variability. Efforts to generate 1D maps of chemical modifications of nucleotides and histones along the genome and the direct or indirect binding of numerous proteins involved in transcription, splicing, replication and repair are indispensable. It is, however, equally important to understand the changing geometry of the nucleus and its structural compartmentalization starting from global parameters, such as size and shape, down to the space-time interactions at the low nanometer scale. Issues, such as the heterogeneity of local molecule concentrations, crowding effects, phase separation and entropic forces are coming to the forefront of research.100-102 A scientific enterprise toward a full understanding of nuclear functions, such as gene regulation, DNA replication and repair, requires understanding of the space-time dynamics of nuclear organization and necessitates a paradigmatic shift in research – from nuclear biochemistry to nuclear biophysics.
The resolution, currently achieved with 3D-SIM is still far away from the space-time resolution needed for an understanding of how macromolecules and macromolecular complexes interact and function within the aNC and how a reconfiguration of chromatin domain clusters may be triggered to expose DNA sequences embedded in compact core regions of CDCs within the perichromatin region and vice versa on functional demands. New possibilities to visualize specific proteins, RNAs and genes in the nucleus of living cells, together with advancements of light optical super resolution microscopy (for reviews see Cremer and Masters103 and Renz104) provide a glimpse on future possibilities to study nuclear organization.46,105,106 Whereas structured illumination microscopy currently allows a lateral resolution in the order of 100 nm and an axial resolution in the order of 300 nm, single molecule localization microscopy provides opportunities for a 3D resolution in the order of 30 nm and possibly even better in the future. A recent study demonstrated that DAPI (and other fluorescent dyes for DNA staining), can be effectively employed in single molecule localization microscopy.107 Sheet microscopy combined with the ultra high resolution of localization microscopy bears the promise to study large numbers of nuclei in structurally intact organisms such as embryos or in thick tissue sections.108 Such an approach avoids the disadvantages of microdissection of embryos in order to place each single cell directly on a cover glass. Methods of correlative microscopy are currently implemented for sequential imaging of one and the same nucleus first in the living cell and after fixation with increasing resolution, employing both super-resolution fluorescence microscopy and electron microscopy with its still unsurpassed resolution.39,109
Future attempts to solve the structure-function conundrums of nuclear organization in space and time require a combination of advanced microscopic and biochemical approaches. So far, Hi-C based genome-wide studies of 3D genome organization with one exception yielded data only for cell populations.110 Strong efforts, however, are made to increase their sensitivity to the point, where studies at the single cell level become feasible.110 The combination of these methods with advanced 4D imaging methods will help to overcome the limitations of each method performed in isolation.
Experimental Procedures
See Supplementary Information for detailed descriptions of materials and protocols.
Ethics statement
No animal experiments were conducted. Oocytes for SCNT were recovered from ovaries of heifers and cows slaughtered for meat production.
Cultivation of early bovine embryos
In vitro fertilized and cloned bovine preimplantation embryos were generated as described.19,35
DNA and RNA synthesis in embryonic cell nuclei
DNA synthesis was studied by pulse labeling experiments with EdU.37 BrUTP or BrU incorporation and immunodetection for the detection of RNA synthesis was performed using modifications of protocols described previously.111,112
Immunostainings
Immunodetection of histone modifications H3K4me3, H3K9me3 and H3S10p, RNA polymerase II-Ser2p, RNA polymerase II-Ser5p, SC-35 and B23, as a marker for nucleoli was performed as described.36,37 A complete list of primary and secondary antibodies used in this study is provided in Extended Experimental Procedures.
3D confocal laser scanning microscopy (3D-CLSM)
Light optical serial sections from embryonic nuclei were obtained with a Leica TCS SP5 confocal laser scanning microscope using 10×, 20× or 63× objectives. Fluorochromes were excited using blue diode, argon, and helium-neon lasers with 405 nm, 488 nm and 594 nm laser lines, respectively.19
3D structured illumination microscopy (3D-SIM) and quantitative image evaluation
3D-SIM of embryonic nuclei was performed on a DeltaVision OMX V3 system (Applied Precision Imaging/GE Healthcare) with a lateral (x/y) resolution of ∼120 nm and an axial (z) resolution of ∼300 nm.37 The system was equipped with a 100×/1.40 NA PlanApo oil immersion objective (Olympus), Cascade II:512 EMCCD cameras (Photometrics) and 405, 488 and 593 nm diode lasers. Image stacks were acquired with a z-distance of 125 nm and with 15 raw SIM images per plane (5 phases, 3 angles). The SI raw data were computationally reconstructed with channel specific measured OTFs using the softWoRX 4.0 software package (Applied Precision). Images from the different color channels were registered with alignment parameters obtained from calibration measurements with 0.2 μm diameter TetraSpeck beads (Invitrogen). The voxel size of the reconstructed images is 39.5 nm in x/y and 125 nm in z with 32-bit depth. For all subsequent image processing and data analysis, images were converted to 16-bit composite tif-stacks. Image stacks were processed using ImageJ 1.45b (http://rsb.info.nih.gov/ij/). DAPI intensity classes were established as described.37 The statistical comparison of the localization of positive pixels for histone modifications H3K4me3, H3K9me3, RNA polymerase II-Ser2p and RNA polymerase II-Ser5p signals within these DAPI intensity classes was achieved with dedicated software written by V.S. and A.S. on the basis of the software package for scientific computing R 2.15 (http://www.r-project.org/).
RNA-Seq data analysis
Raw data files generated by Graf et al.27 available at GEO (GSE52415). Data analysis performed as described in Graf et al.27
Assembly of images and graphs
Image stacks were processed using ImageJ 1.45b (http://rsb.info.nih.gov/ij/). Figures were prepared with Adobe Photoshop CS4 (http://www.adobe.com/). Combined box-/scatterplots were generated using the software package R 2.15 and bar charts with Microsoft Excel 2003/2007.
Statistical analyses
Chi-square goodness-of-fit tests were employed to assess the significancy levels of over- and underrepresentation of signals compared to the DAPI intensity levels. All other significancy levels were determined by Wilcoxon rank-sum test.
Author Contributions
T.C., J.P., V.Z., and E.W. designed research, J.P., V.Z., A.B., D.K., T.G., and A.W. performed experiments, J.P., A.B., V.S., and A.S. analyzed data, T.C., J.P., E.W., and V.Z. wrote the paper.
Disclosure of Potential Conflicts of Interest
No potential conflicts of interest were disclosed.
Acknowledgments
We are grateful for expert assistance of Myriam Reichenbach, Andrea Beck and Nicolas Saucedo in the generation of IVF embryos used in the present study. We also gratefully acknowledge numerous discussions with Marion Cremer and her critical reading of preliminary versions of the manuscript.
Funding
This study was supported by grants from the Deutsche Forschungsgemeinschaft to T.C, E.W. and V.Z. (CR 59/26, FOR 1041, ZA 425/1–3). In addition, research of E.W. and V.Z. was supported by the EU grant Plurisys, HEALTH-F4-2009-223485 FP7 Health 534 project.
Supplemental Material
Supplemental data for this article can be accessed on the publisher's website: http://www.tandfonline.com/kncl
References
- 1. Blobel G. Gene gating: a hypothesis. Proc Nat Acad Sci U S A 1985; 82:8527-9; PMID:3866238; http://dx.doi.org/ 10.1073/pnas.82.24.8527 [DOI] [PMC free article] [PubMed] [Google Scholar]
- 2. Bickmore WA, van Steensel B. Genome architecture: domain organization of interphase chromosomes. Cell 2013; 152:1270-84; PMID:23498936; http://dx.doi.org/ 10.1016/j.cell.2013.02.001 [DOI] [PubMed] [Google Scholar]
- 3. Cardoso MC, Schneider K, Martin RM, Leonhardt H. Structure, function and dynamics of nuclear subcompartments. Curr Opin Cell Biol 2012; 24:79-85; PMID:22227228; http://dx.doi.org/ 10.1016/j.ceb.2011.12.009 [DOI] [PubMed] [Google Scholar]
- 4. Cavalli G, Misteli T. Functional implications of genome topology. Nat Struct Mol Biol 2013; 20:290-9; PMID:23463314; http://dx.doi.org/ 10.1038/nsmb.2474 [DOI] [PMC free article] [PubMed] [Google Scholar]
- 5. de Graaf CA, van Steensel B. Chromatin organization: form to function. Curr Opin Genet Dev 2013; 23:185-90; PMID:23274160; http://dx.doi.org/ 10.1016/j.gde.2012.11.011 [DOI] [PubMed] [Google Scholar]
- 6. Cremer T, Cremer M. Chromosome territories. Cold Spring Harb Perspect Biol 2010; 2:a003889; PMID:20300217; http://dx.doi.org/ 10.1101/cshperspect.a003889 [DOI] [PMC free article] [PubMed] [Google Scholar]
- 7. Cremer T, Zakhartchenko V. Nuclear architecture in developmental biology and cell specialisation. Reprod, Fert Dev 2011; 23:94-106; PMID:21366985; http://dx.doi.org/ 10.1071/RD10249 [DOI] [PubMed] [Google Scholar]
- 8. Ghirlando R, Felsenfeld G. Chromatin structure outside and inside the nucleus. Biopolymers 2013; 99:225-32; PMID:23348669; http://dx.doi.org/ 10.1002/bip.22157 [DOI] [PMC free article] [PubMed] [Google Scholar]
- 9. Gibcus JH, Dekker J. The hierarchy of the 3D genome. Mol Cell 2013; 49:773-82; PMID:23473598; http://dx.doi.org/ 10.1016/j.molcel.2013.02.011 [DOI] [PMC free article] [PubMed] [Google Scholar]
- 10. Hubner MR, Spector DL. Chromatin dynamics. Annu Rev Biophys 2010; 39:471-89; PMID:20462379; http://dx.doi.org/ 10.1146/annurev.biophys.093008.131348 [DOI] [PMC free article] [PubMed] [Google Scholar]
- 11. Lanctot C, Cheutin T, Cremer M, Cavalli G, Cremer T. Dynamic genome architecture in the nuclear space: regulation of gene expression in three dimensions. Nat Rev Genet 2007; 8:104-15; PMID:17230197; http://dx.doi.org/ 10.1038/nrg2041 [DOI] [PubMed] [Google Scholar]
- 12. Meister P, Mango SE, Gasser SM. Locking the genome: nuclear organization and cell fate. Curr Opin Genet Dev 2011; 21:167-74; PMID:21345665; http://dx.doi.org/ 10.1016/j.gde.2011.01.023 [DOI] [PMC free article] [PubMed] [Google Scholar]
- 13. Pederson T. The spatial organization of the genome in mammalian cells. Curr Opin Genet Dev 2004; 14:203-9; PMID:15196468; http://dx.doi.org/ 10.1016/j.gde.2004.02.008 [DOI] [PubMed] [Google Scholar]
- 14. Rapkin LM, Anchel DR, Li R, Bazett-Jones DP. A view of the chromatin landscape. Micron 2012; 43:150-8; PMID:22172345; http://dx.doi.org/ 10.1016/j.micron.2011.11.007 [DOI] [PubMed] [Google Scholar]
- 15. Zhang J, Poh HM, Peh SQ, Sia YY, Li G, Mulawadi FH, Goh Y, Fullwood MJ, Sung WK, Ruan X, et al. ChIA-PET analysis of transcriptional chromatin interactions. Methods 2012; 58:289-99; PMID:22926262; http://dx.doi.org/ 10.1016/j.ymeth.2012.08.009 [DOI] [PubMed] [Google Scholar]
- 16. Ahmed K, Dehghani H, Rugg-Gunn P, Fussner E, Rossant J, Bazett-Jones DP. Global chromatin architecture reflects pluripotency and lineage commitment in the early mouse embryo. PloS One 2010; 5:e10531; PMID:20479880; http://dx.doi.org/ 10.1371/journal.pone.0010531 [DOI] [PMC free article] [PubMed] [Google Scholar]
- 17. Aguirre-Lavin T, Adenot P, Bonnet-Garnier A, Lehmann G, Fleurot R, Boulesteix C, Debey P, Beaujean N. 3D-FISH analysis of embryonic nuclei in mouse highlights several abrupt changes of nuclear organization during preimplantation development. BMC Dev Biol 2012; 12:30; PMID:23095683; http://dx.doi.org/ 10.1186/1471-213X-12-30 [DOI] [PMC free article] [PubMed] [Google Scholar]
- 18. Brero A, Hao R, Schieker M, Wierer M, Wolf E, Cremer T, Zakhartchenko V. Reprogramming of active and repressive histone modifications following nuclear transfer with rabbit mesenchymal stem cells and adult fibroblasts. Cloning Stem Cells 2009; 11:319-29; PMID:19508112; http://dx.doi.org/ 10.1089/clo.2008.0083 [DOI] [PubMed] [Google Scholar]
- 19. Koehler D, Zakhartchenko V, Froenicke L, Stone G, Stanyon R, Wolf E, Cremer T, Brero A. Changes of higher order chromatin arrangements during major genome activation in bovine preimplantation embryos. Exp Cell Res 2009; 315:2053-63; PMID:19254712; http://dx.doi.org/ 10.1016/j.yexcr.2009.02.016 [DOI] [PubMed] [Google Scholar]
- 20. Merico V, Barbieri J, Zuccotti M, Joffe B, Cremer T, Redi CA, Solovei I, Garagna S. Epigenomic differentiation in mouse preimplantation nuclei of biparental, parthenote and cloned embryos. Chromosome Res: Int J Mol Supramol Evolut Aspects Chromosome Biol 2007; 15:341-60; PMID:17447149 [DOI] [PubMed] [Google Scholar]
- 21. Salvaing J, Aguirre-Lavin T, Boulesteix C, Lehmann G, Debey P, Beaujean N. 5-Methylcytosine and 5-hydroxymethylcytosine spatiotemporal profiles in the mouse zygote. PloS One 2012; 7:e38156; PMID:22693592; http://dx.doi.org/ 10.1371/journal.pone.0038156 [DOI] [PMC free article] [PubMed] [Google Scholar]
- 22. Yang CX, Liu Z, Fleurot R, Adenot P, Duranthon V, Vignon X, Zhou Q, Renard JP, Beaujean N. Heterochromatin reprogramming in rabbit embryos after fertilization, intra-, and inter-species SCNT correlates with preimplantation development. Reproduction 2013; 145:149-59; PMID:23221012; http://dx.doi.org/ 10.1530/REP-11-0421 [DOI] [PubMed] [Google Scholar]
- 23. Harmon B, Sedat J. Cell-by-cell dissection of gene expression and chromosomal interactions reveals consequences of nuclear reorganization. PLoS Biol 2005; 3:e67; PMID:15737020; http://dx.doi.org/ 10.1371/journal.pbio.0030067 [DOI] [PMC free article] [PubMed] [Google Scholar]
- 24. Kosak ST, Groudine M. Form follows function: The genomic organization of cellular differentiation. Genes Development 2004; 18:1371-84; PMID:15198979; http://dx.doi.org/ 10.1101/gad.1209304 [DOI] [PubMed] [Google Scholar]
- 25. Wuensch A, Habermann FA, Kurosaka S, Klose R, Zakhartchenko V, Reichenbach HD, Sinowatz F, McLaughlin KJ, Wolf E. Quantitative monitoring of pluripotency gene activation after somatic cloning in cattle. Biol Reprod 2007; 76:983-91; PMID:17314316; http://dx.doi.org/ 10.1095/biolreprod.106.058776 [DOI] [PubMed] [Google Scholar]
- 26. Kanka J, Kepkova K, Nemcova L. Gene expression during minor genome activation in preimplantation bovine development. Theriogenology 2009; 72:572-83; PMID:19501393; http://dx.doi.org/ 10.1016/j.theriogenology.2009.04.014 [DOI] [PubMed] [Google Scholar]
- 27. Graf A, Krebs S, Zakhartchenko V, Schwalb B, Blum H, Wolf E. Fine mapping of genome activation in bovine embryos by RNA sequencing. Proc Nat Acad Sci U S A 2014; 111:4139-44; PMID:24591639 [DOI] [PMC free article] [PubMed] [Google Scholar]
- 28. Tadros W, Lipshitz HD. The maternal-to-zygotic transition: a play in two acts. Development 2009; 136:3033-42; PMID:19700615; http://dx.doi.org/ 10.1242/dev.033183 [DOI] [PubMed] [Google Scholar]
- 29. Li L, Lu X, Dean J. The maternal to zygotic transition in mammals. Mol Aspects Med 2013; 34:919-38; PMID:23352575; http://dx.doi.org/ 10.1016/j.mam.2013.01.003 [DOI] [PMC free article] [PubMed] [Google Scholar]
- 30. Badr H, Bongioni G, Abdoon AS, Kandil O, Puglisi R. Gene expression in the in vitro-produced preimplantation bovine embryos. Zygote 2007; 15:355-67; PMID:17967215; http://dx.doi.org/ 10.1017/S0967199407004315 [DOI] [PubMed] [Google Scholar]
- 31. Camous S, Kopecny V, Flechon JE. Autoradiographic detection of the earliest stage of [3H]-uridine incorporation into the cow embryo. Biol Cell 1986; 58:195-200; PMID:2436695; http://dx.doi.org/ 10.1111/j.1768-322X.1986.tb00506.x [DOI] [PubMed] [Google Scholar]
- 32. Memili E, First NL. Zygotic and embryonic gene expression in cow: a review of timing and mechanisms of early gene expression as compared with other species. Zygote 2000; 8:87-96; PMID:10840878; http://dx.doi.org/ 10.1017/S0967199400000861 [DOI] [PubMed] [Google Scholar]
- 33. Misirlioglu M, Page GP, Sagirkaya H, Kaya A, Parrish JJ, First NL, Memili E. Dynamics of global transcriptome in bovine matured oocytes and preimplantation embryos. Proc Nat Acad Sci U S A 2006; 103:18905-10; PMID:17142320; http://dx.doi.org/ 10.1073/pnas.0608247103 [DOI] [PMC free article] [PubMed] [Google Scholar]
- 34. Vigneault C, Gravel C, Vallee M, McGraw S, Sirard MA. Unveiling the bovine embryo transcriptome during the maternal-to-embryonic transition. Reproduction 2009; 137:245-57; PMID:18987256; http://dx.doi.org/ 10.1530/REP-08-0079 [DOI] [PubMed] [Google Scholar]
- 35. Popken J, Koehler D, Brero A, Wuensch A, Guengoer T, Thormeyer T, Wolf E, Cremer T, Zakhartchenko V. Positional changes of a pluripotency marker gene during structural reorganization of fibroblast nuclei in cloned early bovine embryos. Nucleus 5:6; http://dx.doi.org/ 10.4161/19491034.2014.979712 (Under Review) 2014. [DOI] [PMC free article] [PubMed] [Google Scholar]
- 36. Markaki Y, Gunkel M, Schermelleh L, Beichmanis S, Neumann J, Heidemann M, Leonhardt H, Eick D, Cremer C, Cremer T. Functional nuclear organization of transcription and DNA replication: a topographical marriage between chromatin domains and the interchromatin compartment. Cold Spring Harbor Symposia Quant Biol 2010; 75:475-92; PMID:21467142; http://dx.doi.org/ 10.1101/sqb.2010.75.042 [DOI] [PubMed] [Google Scholar]
- 37. Markaki Y, Smeets D, Fiedler S, Schmid VJ, Schermelleh L, Cremer T, Cremer M. The potential of 3D-FISH and super-resolution structured illumination microscopy for studies of 3D nuclear architecture: 3D structured illumination microscopy of defined chromosomal structures visualized by 3D (immuno)-FISH opens new perspectives for studies of nuclear architecture. BioEssays: News Reviews Mol Cell Dev Biology 2012; 34:412-26; PMID:22508100; http://dx.doi.org/ 10.1002/bies.201100176 [DOI] [PubMed] [Google Scholar]
- 38. Rouquette J, Genoud C, Vazquez-Nin GH, Kraus B, Cremer T, Fakan S. Revealing the high-resolution three-dimensional network of chromatin and interchromatin space: a novel electron-microscopic approach to reconstructing nuclear architecture. Chromosome Res: Int J Mol Supramol Evol Aspects Chromosome Biol 2009; 17:801-10; PMID:19731052; http://dx.doi.org/ 10.1007/s10577-009-9070-x [DOI] [PubMed] [Google Scholar]
- 39. Huebner B, Cremer T, Neumann J. Correlative microscopy of individual cells: sequential application of microscopic systems with increasing resolution to study the nuclear landscape. Methods Mol Biol 2013; 1042:299-336; PMID:23980016; http://dx.doi.org/ 10.1007/978-1-62703-526-2_21 [DOI] [PubMed] [Google Scholar]
- 40. Smeets D, Markaki Y, Schmid VJ, Kraus F, Tattermusch A, Cerase A, Sterr M, Fiedler S, Demmerle J, Popken J, et al. Three-dimensional super-resolution microscopy of the inactive X chromosome territory reveals a collapse of its active nuclear compartment harboring distinct Xist RNA foci. Epigenetics Chromatin 2014; 7:8; PMID:25057298; http://dx.doi.org/ 10.1186/1756-8935-7-8 [DOI] [PMC free article] [PubMed] [Google Scholar]
- 41. Rouquette J, Cremer C, Cremer T, Fakan S. Functional nuclear architecture studied by microscopy: present and future. Int Rev Cell Mol Biol 2010; 282:1-90; PMID:20630466; http://dx.doi.org/ 10.1016/S1937-6448(10)82001-5 [DOI] [PubMed] [Google Scholar]
- 42. Cremer T, Kreth G, Koester H, Fink RH, Heintzmann R, Cremer M, Solovei I, Zink D, Cremer C. Chromosome territories, interchromatin domain compartment, and nuclear matrix: an integrated view of the functional nuclear architecture. Crit Rev Eukaryotic Gene Exp 2000; 10:179-212; PMID:11186332; http://dx.doi.org/ 10.1615/CritRevEukarGeneExpr.v10.i2.60 [DOI] [PubMed] [Google Scholar]
- 43. Cremer T, Cremer C. Chromosome territories, nuclear architecture and gene regulation in mammalian cells. Nat Rev Genet 2001; 2:292-301; PMID:11283701; http://dx.doi.org/ 10.1038/35066075 [DOI] [PubMed] [Google Scholar]
- 44. Mor A, Suliman S, Ben-Yishay R, Yunger S, Brody Y, Shav-Tal Y. Dynamics of single mRNP nucleocytoplasmic transport and export through the nuclear pore in living cells. Nat Cell Biol 2010; 12:543-52; PMID:20453848; http://dx.doi.org/ 10.1038/ncb2056 [DOI] [PubMed] [Google Scholar]
- 45. Cmarko D, Verschure PJ, Martin TE, Dahmus ME, Krause S, Fu XD, van Driel R, Fakan S. Ultrastructural analysis of transcription and splicing in the cell nucleus after bromo-UTP microinjection. Mol Biol Cell 1999; 10:211-23; PMID:9880337; http://dx.doi.org/ 10.1091/mbc.10.1.211 [DOI] [PMC free article] [PubMed] [Google Scholar]
- 46. Maharana S, Sharma D, Shi X, Shivashankar GV. Dynamic organization of transcription compartments is dependent on functional nuclear architecture. Biophys J 2012; 103:851-9; PMID:23009834; http://dx.doi.org/ 10.1016/j.bpj.2012.06.036 [DOI] [PMC free article] [PubMed] [Google Scholar]
- 47. Niedojadlo J, Perret-Vivancos C, Kalland KH, Cmarko D, Cremer T, van Driel R, Fakan S. Transcribed DNA is preferentially located in the perichromatin region of mammalian cell nuclei. Exp Cell Res 2011; 317:433-44; PMID:21056558; http://dx.doi.org/ 10.1016/j.yexcr.2010.10.026 [DOI] [PubMed] [Google Scholar]
- 48. Jaunin F, Visser AE, Cmarko D, Aten JA, Fakan S. Fine structural in situ analysis of nascent DNA movement following DNA replication. Exp Cell Res 2000; 260:313-23; PMID:11035926; http://dx.doi.org/ 10.1006/excr.2000.4999 [DOI] [PubMed] [Google Scholar]
- 49. Zhou VW, Goren A, Bernstein BE. Charting histone modifications and the functional organization of mammalian genomes. Nat Rev Genet 2011; 12:7-18; PMID:21116306; http://dx.doi.org/ 10.1038/nrg2905 [DOI] [PubMed] [Google Scholar]
- 50. Schnedl W, Breitenbach M, Stranzinger G. Mithramycin and DIPI: a pair of fluorochromes specific for GC-and AT-rich DNA respectively. Hum Genet 1977; 36:299-305; PMID:67077; http://dx.doi.org/ 10.1007/BF00446280 [DOI] [PubMed] [Google Scholar]
- 51. Kapuscinski J. DAPI: a DNA-specific fluorescent probe. Biotechnic Histochem: Off Pub Biol Stain Comm 1995; 70:220-33; http://dx.doi.org/ 10.3109/10520299509108199 [DOI] [PubMed] [Google Scholar]
- 52. Bink K, Walch A, Feuchtinger A, Eisenmann H, Hutzler P, Hofler H, Werner M. TO-PRO-3 is an optimal fluorescent dye for nuclear counterstaining in dual-colour FISH on paraffin sections. Histochem Cell Biol 2001; 115:293-9; PMID:11405057 [DOI] [PubMed] [Google Scholar]
- 53. Prigent C, Dimitrov S. Phosphorylation of serine 10 in histone H3, what for? J Cell Sci 2003; 116:3677-85; PMID:12917355; http://dx.doi.org/ 10.1242/jcs.00735 [DOI] [PubMed] [Google Scholar]
- 54. Chan PK, Liu QR, Durban E. The major phosphorylation site of nucleophosmin (B23) is phosphorylated by a nuclear kinase II. Biochem J 1990; 270:549-52; PMID:2400401 [DOI] [PMC free article] [PubMed] [Google Scholar]
- 55. Cremer C. Optics far beyond the diffraction limit. In: Traeger F, ed. Springer Handbook of Lasers and Optics, Berlin,: Springer, 2012:1359-97. [Google Scholar]
- 56. Schermelleh L, Heintzmann R, Leonhardt H. A guide to super-resolution fluorescence microscopy. J Cell Biol 2010; 190:165-75; PMID:20643879; http://dx.doi.org/ 10.1083/jcb.201002018 [DOI] [PMC free article] [PubMed] [Google Scholar]
- 57. Guetg C, Santoro R. Formation of nuclear heterochromatin: the nucleolar point of view. Epigenetics: Off J DNA Methylation Soc 2012; 7:811-4; PMID:22735386; http://dx.doi.org/ 10.4161/epi.21072 [DOI] [PMC free article] [PubMed] [Google Scholar]
- 58. Nemeth A, Conesa A, Santoyo-Lopez J, Medina I, Montaner D, Peterfia B, Solovei I, Cremer T, Dopazo J, Langst G. Initial genomics of the human nucleolus. PLoS Genet 2010; 6:e1000889; PMID:20361057; http://dx.doi.org/ 10.1371/journal.pgen.1000889 [DOI] [PMC free article] [PubMed] [Google Scholar]
- 59. Zinner R, Albiez H, Walter J, Peters AH, Cremer T, Cremer M. Histone lysine methylation patterns in human cell types are arranged in distinct three-dimensional nuclear zones. Histochem Cell Biol 2006; 125:3-19; PMID:16215742; http://dx.doi.org/ 10.1007/s00418-005-0049-1 [DOI] [PubMed] [Google Scholar]
- 60. Mitchell JA, Fraser P. Transcription factories are nuclear subcompartments that remain in the absence of transcription. Genes Dev 2008; 22:20-5; PMID:18172162; http://dx.doi.org/ 10.1101/gad.454008 [DOI] [PMC free article] [PubMed] [Google Scholar]
- 61. Probst AV, Almouzni G. Heterochromatin establishment in the context of genome-wide epigenetic reprogramming. Trends Genet: TIG 2011; 27:177-85; PMID:21497937; http://dx.doi.org/ 10.1016/j.tig.2011.02.002 [DOI] [PubMed] [Google Scholar]
- 62. Kopecny V, Fakan S, Pavlok A, Pivko J, Grafenau P, Biggiogera M, Leser G, Martin TE. Immunoelectron microscopic localization of small nuclear ribonucleoproteins during bovine early embryogenesis. Mol Reprod Dev 1991; 29:209-19; PMID:1834097; http://dx.doi.org/ 10.1002/mrd.1080290302 [DOI] [PubMed] [Google Scholar]
- 63. Chandra T, Kirschner K, Thuret JY, Pope BD, Ryba T, Newman S, Ahmed K, Samarajiwa SA, Salama R, Carroll T, et al. Independence of repressive histone marks and chromatin compaction during senescent heterochromatic layer formation. Mol Cell 2012; 47:203-14; PMID:22795131; http://dx.doi.org/ 10.1016/j.molcel.2012.06.010 [DOI] [PMC free article] [PubMed] [Google Scholar]
- 64. Illner D, Zinner R, Handtke V, Rouquette J, Strickfaden H, Lanctot C, Conrad M, Seiler A, Imhof A, Cremer T, et al. Remodeling of nuclear architecture by the thiodioxoxpiperazine metabolite chaetocin. Exp Cell Res 2010; 316:1662-80; PMID:20302859; http://dx.doi.org/ 10.1016/j.yexcr.2010.03.008 [DOI] [PubMed] [Google Scholar]
- 65. Memili E, Dominko T, First NL. Onset of transcription in bovine oocytes and preimplantation embryos. Mol Reprod Dev 1998; 51:36-41; PMID:9712315; http://dx.doi.org/ 10.1002/(SICI)1098-2795(199809)51:1%3c36::AID-MRD4%3e3.0.CO;2-X [DOI] [PubMed] [Google Scholar]
- 66. Papantonis A, Cook PR. Transcription factories: genome organization and gene regulation. Chem Rev 2013; 113:8683-705; PMID:23597155; http://dx.doi.org/ 10.1021/cr300513p [DOI] [PubMed] [Google Scholar]
- 67. Eick D, Geyer M. The RNA polymerase II carboxy-terminal domain (CTD) code. Chem Rev 2013; 113:8456-90; PMID:23952966; http://dx.doi.org/ 10.1021/cr400071f [DOI] [PubMed] [Google Scholar]
- 68. Heidemann M, Hintermair C, Voss K, Eick D. Dynamic phosphorylation patterns of RNA polymerase II CTD during transcription. Biochimica et Biophysica Acta 2013; 1829:55-62; PMID:22982363; http://dx.doi.org/ 10.1016/j.bbagrm.2012.08.013 [DOI] [PubMed] [Google Scholar]
- 69. Fragouli E, Alfarawati S, Spath K, Jaroudi S, Sarasa J, Enciso M, Wells D. The origin and impact of embryonic aneuploidy. Hum Genet 2013; 132:1001-13; PMID:23620267; http://dx.doi.org/ 10.1007/s00439-013-1309-0 [DOI] [PubMed] [Google Scholar]
- 70. Demyda-Peyras S, Dorado J, Hidalgo M, Anter J, De Luca L, Genero E, Moreno-Millan M. Effects of oocyte quality, incubation time and maturation environment on the number of chromosomal abnormalities in IVF-derived early bovine embryos. Reprod Fertility Dev 2013; 25:1077-84; PMID:23182337; http://dx.doi.org/ 10.1071/RD12140 [DOI] [PubMed] [Google Scholar]
- 71. Viuff D, Rickords L, Offenberg H, Hyttel P, Avery B, Greve T, Olsaker I, Williams JL, Callesen H, Thomsen PD. A high proportion of bovine blastocysts produced in vitro are mixoploid. Biol Reprod 1999; 60:1273-8; PMID:10330080; http://dx.doi.org/ 10.1095/biolreprod60.6.1273 [DOI] [PubMed] [Google Scholar]
- 72. Leidenfrost S, Boelhauve M, Reichenbach M, Gungor T, Reichenbach HD, Sinowatz F, Wolf E, Habermann FA. Cell arrest and cell death in mammalian preimplantation development: lessons from the bovine model. PloS One 2011; 6:e22121; PMID:21811561; http://dx.doi.org/ 10.1371/journal.pone.0022121 [DOI] [PMC free article] [PubMed] [Google Scholar]
- 73. Leidenfrost S. Zellentwicklung, Zelltod und die Expression Apoptose-assoziierter Gene in der frühen Embryogenese beim Rind. Lehrstuhl für Allgemeine Anatomie, Histologie und Embryologie. Munich: Ludwig-Maximilians-University, http://edoc.ub.uni-muenchen.de/11663/, 2009. [Google Scholar]
- 74. Solovei I, Kreysing M, Lanctot C, Kosem S, Peichl L, Cremer T, Guck J, Joffe B. Nuclear architecture of rod photoreceptor cells adapts to vision in mammalian evolution. Cell 2009; 137:356-68; PMID:19379699; http://dx.doi.org/ 10.1016/j.cell.2009.01.052 [DOI] [PubMed] [Google Scholar]
- 75. Chuang CH, Carpenter AE, Fuchsova B, Johnson T, de Lanerolle P, Belmont AS. Long-range directional movement of an interphase chromosome site. Curr Biol 2006; 16:825-31; PMID:16631592; http://dx.doi.org/ 10.1016/j.cub.2006.03.059 [DOI] [PubMed] [Google Scholar]
- 76. Osborne CS, Chakalova L, Mitchell JA, Horton A, Wood AL, Bolland DJ, Corcoran AE, Fraser P. Myc dynamically and preferentially relocates to a transcription factory occupied by Igh. PLoS Biol 2007; 5:e192; PMID:17622196; http://dx.doi.org/ 10.1371/journal.pbio.0050192 [DOI] [PMC free article] [PubMed] [Google Scholar]
- 77. Roukos V, Voss TC, Schmidt CK, Lee S, Wangsa D, Misteli T. Spatial dynamics of chromosome translocations in living cells. Science 2013; 341:660-4; PMID:23929981; http://dx.doi.org/ 10.1126/science.1237150 [DOI] [PMC free article] [PubMed] [Google Scholar]
- 78. Bridger JM, Arican-Gotkas H, Foster H, Godwin L, Harvey A, Kill IR, Knight M, Mehta IS, Ahmed M. The non-random repositioning of whole chromosomes and individual gene loci in interphase nuclei and its relevance in disease, infection, aging, and aancer. In: Schirmer EC, de las Heras JI, eds. Cancer Biology and the Nuclear Envelope, New York: Springer, 2014, 263-79. [DOI] [PubMed] [Google Scholar]
- 79. Mehta IS, Eskiw CH, Arican HD, Kill IR, Bridger JM. Farnesyltransferase inhibitor treatment restores chromosome territory positions and active chromosome dynamics in Hutchinson-Gilford progeria syndrome cells. Genome Biol 2011; 12:R74; PMID:21838864; http://dx.doi.org/ 10.1186/gb-2011-12-8-r74 [DOI] [PMC free article] [PubMed] [Google Scholar]
- 80. Strickfaden H, Zunhammer A, van Koningsbruggen S, Kohler D, Cremer T. 4D chromatin dynamics in cycling cells: theodor boveri's hypotheses revisited. Nucleus 2010; 1:284-97; PMID:21327076; http://dx.doi.org/ 10.4161/nucl.1.3.11969 [DOI] [PMC free article] [PubMed] [Google Scholar]
- 81. Walter J, Schermelleh L, Cremer M, Tashiro S, Cremer T. Chromosome order in HeLa cells changes during mitosis and early G1, but is stably maintained during subsequent interphase stages. J Cell Biol 2003; 160:685-97; PMID:12604593; http://dx.doi.org/ 10.1083/jcb.200211103 [DOI] [PMC free article] [PubMed] [Google Scholar]
- 82. Hihara S, Pack CG, Kaizu K, Tani T, Hanafusa T, Nozaki T, Takemoto S, Yoshimi T, Yokota H, Imamoto N, et al. Local nucleosome dynamics facilitate chromatin accessibility in living mammalian cells. Cell Rep 2012; 2:1645-56; PMID:23246002; http://dx.doi.org/ 10.1016/j.celrep.2012.11.008 [DOI] [PubMed] [Google Scholar]
- 83. Bornfleth H, Edelmann P, Zink D, Cremer T, Cremer C. Quantitative motion analysis of subchromosomal foci in living cells using four-dimensional microscopy. Biophys J 1999; 77:2871-86; PMID:10545385; http://dx.doi.org/ 10.1016/S0006-3495(99)77119-5 [DOI] [PMC free article] [PubMed] [Google Scholar]
- 84. Dixon JR, Selvaraj S, Yue F, Kim A, Li Y, Shen Y, Hu M, Liu JS, Ren B. Topological domains in mammalian genomes identified by analysis of chromatin interactions. Nature 2012; 485:376-80; PMID:22495300; http://dx.doi.org/ 10.1038/nature11082 [DOI] [PMC free article] [PubMed] [Google Scholar]
- 85. Bernardi G. The genome: an isochore ensemble and its evolution. Ann N Y Acad Sci 2012; 1267:31-4; PMID:22954213; http://dx.doi.org/ 10.1111/j.1749-6632.2012.06591.x [DOI] [PubMed] [Google Scholar]
- 86. Lieberman-Aiden E, van Berkum NL, Williams L, Imakaev M, Ragoczy T, Telling A, Amit I, Lajoie BR, Sabo PJ, Dorschner MO, et al. Comprehensive mapping of long-range interactions reveals folding principles of the human genome. Science 2009; 326:289-93; PMID:19815776; http://dx.doi.org/ 10.1126/science.1181369 [DOI] [PMC free article] [PubMed] [Google Scholar]
- 87. Baddeley D, Chagin VO, Schermelleh L, Martin S, Pombo A, Carlton PM, Gahl A, Domaing P, Birk U, Leonhardt H, et al. Measurement of replication structures at the nanometer scale using super-resolution light microscopy. Nucleic Acids Res 2010; 38:e8; PMID:19864256; http://dx.doi.org/ 10.1093/nar/gkp901 [DOI] [PMC free article] [PubMed] [Google Scholar]
- 88. Albiez H, Cremer M, Tiberi C, Vecchio L, Schermelleh L, Dittrich S, Kupper K, Joffe B, Thormeyer T, von Hase J, et al. Chromatin domains and the interchromatin compartment form structurally defined and functionally interacting nuclear networks. Chromosome Res: Int J Mol Supramol Evol Aspects Chromosome Biol 2006; 14:707-33; PMID:17115328; http://dx.doi.org/ 10.1007/s10577-006-1086-x [DOI] [PubMed] [Google Scholar]
- 89. Joti Y, Hikima T, Nishino Y, Kamada F, Hihara S, Takata H, Ishikawa T, Maeshima K. Chromosomes without a 30-nm chromatin fiber. Nucleus 2012; 3:404-10; PMID:22825571; http://dx.doi.org/ 10.4161/nucl.21222 [DOI] [PMC free article] [PubMed] [Google Scholar]
- 90. Eltsov M, Maclellan KM, Maeshima K, Frangakis AS, Dubochet J. Analysis of cryo-electron microscopy images does not support the existence of 30-nm chromatin fibers in mitotic chromosomes in situ. Proc Nat Acad Sci U S A 2008; 105:19732-7; PMID:19064912; http://dx.doi.org/ 10.1073/pnas.0810057105 [DOI] [PMC free article] [PubMed] [Google Scholar]
- 91. Munkel C, Eils R, Dietzel S, Zink D, Mehring C, Wedemann G, Cremer T, Langowski J. Compartmentalization of interphase chromosomes observed in simulation and experiment. J Mol Biol 1999; 285:1053-65; PMID:9887267; http://dx.doi.org/ 10.1006/jmbi.1998.2361 [DOI] [PubMed] [Google Scholar]
- 92. Kreth G, Finsterle J, von Hase J, Cremer M, Cremer C. Radial arrangement of chromosome territories in human cell nuclei: a computer model approach based on gene density indicates a probabilistic global positioning code. Biophys J 2004; 86:2803-12; PMID:15111398; http://dx.doi.org/ 10.1016/S0006-3495(04)74333-7 [DOI] [PMC free article] [PubMed] [Google Scholar]
- 93. Dehghani H, Dellaire G, Bazett-Jones DP. Organization of chromatin in the interphase mammalian cell. Micron 2005; 36:95-108; PMID:15629642; http://dx.doi.org/ 10.1016/j.micron.2004.10.003 [DOI] [PubMed] [Google Scholar]
- 94. Branco MR, Pombo A. Intermingling of chromosome territories in interphase suggests role in translocations and transcription-dependent associations. PLoS Biol 2006; 4:e138; PMID:16623600; http://dx.doi.org/ 10.1371/journal.pbio.0040138 [DOI] [PMC free article] [PubMed] [Google Scholar]
- 95. Mirny LA. The fractal globule as a model of chromatin architecture in the cell. Chromosome Res: Int J Mol Supramol Evol Aspects Chromosome Biol 2011; 19:37-51; PMID:21274616; http://dx.doi.org/ 10.1007/s10577-010-9177-0 [DOI] [PMC free article] [PubMed] [Google Scholar]
- 96. Halverson JD, Smrek J, Kremer K, Grosberg AY. From a melt of rings to chromosome territories: the role of topological constraints in genome folding. Rep Prog Phys Phys Soc 2014; 77:022601; PMID:24472896; http://dx.doi.org/ 10.1088/0034-4885/77/2/022601 [DOI] [PubMed] [Google Scholar]
- 97. Jerabek H, Heermann D. How chromatin looping and nuclear envelope attachment affect genome organization in eukaryotic cell nuclei. Int Rev Cell Mol Biol 2014; 307:351-81; PMID:24380599; http://dx.doi.org/ 10.1016/B978-0-12-800046-5.00010-2 [DOI] [PubMed] [Google Scholar]
- 98. Maeshima K, Imai R, Tamura S, Nozaki T. Chromatin as dynamic 10-nm fibers. Chromosoma 2014; 123:225-37; PMID:24737122; http://dx.doi.org/ 10.1007/s00412-014-0460-2 [DOI] [PMC free article] [PubMed] [Google Scholar]
- 99. Barbieri M, Fraser J, Lavitas LM, Chotalia M, Dostie J, Pombo A, Nicodemi M. A polymer model explains the complexity of large-scale chromatin folding. Nucleus 2013; 4:267-73; PMID:23823730; http://dx.doi.org/ 10.4161/nucl.25432 [DOI] [PMC free article] [PubMed] [Google Scholar]
- 100. Pederson T. Chapter one-the nuclear physique. Int Rev Cell Mol Biol. 2014; 307:1-13. doi: 10.1016/B978-0-12-800046-5.00001-1 [DOI] [PubMed] [Google Scholar]
- 101. Hancock R, Jeon KW. Preface. New models of the cell nucleus: crowding, entropic forces, phase separation, and fractals. Int Rev Cell Mol Biol 2014; 307:xiii; PMID:24380603 [DOI] [PubMed] [Google Scholar]
- 102. Woringer M, Darzacq X, Izeddin I. Geometry of the nucleus: a perspective on gene expression regulation. Curr Opin Chem Biol 2014; 20C:112-9; PMID:24981829; http://dx.doi.org/ 10.1016/j.cbpa.2014.05.009 [DOI] [PubMed] [Google Scholar]
- 103. Cremer C, Masters BR. Resolution enhancement techniques in microscopy. EPJ H 2013; 38:281-344; http://dx.doi.org/ 10.1140/epjh/e2012-20060-1 [DOI] [Google Scholar]
- 104. Renz M. Fluorescence microscopy-a historical and technical perspective. Cytometry A 2013; 83:767-79; PMID:23585290; http://dx.doi.org/ 10.1002/cyto.a.22295 [DOI] [PubMed] [Google Scholar]
- 105. Chen B, Gilbert LA, Cimini BA, Schnitzbauer J, Zhang W, Li GW, Park J, Blackburn EH, Weissman JS, Qi LS, et al. Dynamic imaging of genomic loci in living human cells by an optimized CRISPR/Cas system. Cell 2013; 155:1479-91; PMID:24360272; http://dx.doi.org/ 10.1016/j.cell.2013.12.001 [DOI] [PMC free article] [PubMed] [Google Scholar]
- 106. Ma H, Reyes-Gutierrez P, Pederson T. Visualization of repetitive DNA sequences in human chromosomes with transcription activator-like effectors. Proc Nat Acad Sci U S A 2013; 110:21048-53; PMID:24324157; http://dx.doi.org/ 10.1073/pnas.1319097110 [DOI] [PMC free article] [PubMed] [Google Scholar]
- 107. Szczurek AT, Prakash K, Lee HK, Zurek-Biesiada DJ, Best G, Hagmann M, Dobrucki JW, Cremer C, Birk U. Single molecule localization microscopy of the distribution of chromatin using Hoechst and DAPI fluorescent probes. Nucleus 2014; 5:331-340; PMID:24945151; http://dx.doi.org/ 10.4161/nucl.29564 [DOI] [PMC free article] [PubMed] [Google Scholar]
- 108. Hu YS, Zimmerley M, Li Y, Watters R, Cang H. Single-molecule super-resolution light-sheet microscopy. Chemphyschem: Eur J Chem Phys Phys Chem 2014; 15:577-86; PMID:24615819; http://dx.doi.org/ 10.1002/cphc.201300732 [DOI] [PubMed] [Google Scholar]
- 109. Kruhlak MJ. Correlative fluorescence and EFTEM imaging of the organized components of the mammalian nucleus. Methods Mol Biol 2013; 950:397-416; PMID:23086887 [DOI] [PMC free article] [PubMed] [Google Scholar]
- 110. Nagano T, Lubling Y, Stevens TJ, Schoenfelder S, Yaffe E, Dean W, Laue ED, Tanay A, Fraser P. Single-cell Hi-C reveals cell-to-cell variability in chromosome structure. Nature 2013; 502:59-64; PMID:24067610; http://dx.doi.org/ 10.1038/nature12593 [DOI] [PMC free article] [PubMed] [Google Scholar]
- 111. Kageyama S, Nagata M, Aoki F. Isolation of nascent messenger RNA from mouse preimplantation embryos. Biol Reprod 2004; 71:1948-55; PMID:15286032; http://dx.doi.org/ 10.1095/biolreprod.104.031906 [DOI] [PubMed] [Google Scholar]
- 112. Waksmundzka M, Debey P. Electric field-mediated BrUTP uptake by mouse oocytes, eggs, and embryos. Mol Reprod Dev 2001; 58:173-9; PMID:11139229; http://dx.doi.org/ 10.1002/1098-2795(200102)58:2%3c173::AID-MRD6%3e3.0.CO;2-2 [DOI] [PubMed] [Google Scholar]
Associated Data
This section collects any data citations, data availability statements, or supplementary materials included in this article.