

SUMMARY
BACKGROUND
The accuracy of tuberculosis (TB) surveillance systems is paramount in TB control. In South Africa, information from the laboratory is not directly linked to the Electronic TB Register (ETR).
OBJECTIVE
To validate smear results recorded in the ETR with those recorded in the laboratory.
METHODS
A retrospective evaluation was conducted among all sputum smear-positive TB patients recorded in the ETR during the fourth quarter of 2009 in KwaZulu-Natal Province.
RESULTS
Of 1036 smear-positive patients recorded in the ETR, 683 (65.9%) had positive results recorded in the laboratory register. Only 364 (53.2%) had their smear results recorded in the ETR at the end of the intensive phase of treatment; of 326 (89.6%) recorded as converted to smear-negative, 224 (61.5%) were confirmed as smear-negative in the laboratory. Of 331 patients with end-of-treatment results in the ETR, 302 (91.2%) were recorded as cured, but only 105 (34.8%) were confirmed in the laboratory.
CONCLUSIONS
Over a third of TB patients registered as smear-positive in the ETR could not be confirmed based on laboratory results. Many patients did not have a laboratory record, lending to uncertainty as to the validity of the smear results and treatment outcomes recorded in the ETR.
Keywords: tuberculosis, validation, sputum smear, surveillance
SOUTH AFRICA has an estimated 490 000 persons diagnosed with tuberculosis (TB) annually, an incidence rate of 981 per 100 000 population, and is ranked third highest of the world’s 22 high TB burden countries by the World Health Organization (WHO).1 KwaZulu-Natal Province has the highest burden of TB in South Africa. In 2009, the number of new smear-positive cases in KwaZulu-Natal was 42 659, with a cure rate of 58% and a treatment completion rate of 70.3%.2
The performance of a TB control programme may be measured on the basis of laboratory testing to calculate key indicators such as case finding, sputum conversion and cure rates. In South Africa, a diagnosis of TB is confirmed by microscopic evidence of acid-fast bacilli (AFB) from sputum smears tested by the National Health Laboratory Service in the public sector.3 Sputum results are also used for monitoring treatment response. However, information from the laboratory and the clinic are not directly linked. Laboratory results are captured in the laboratory information system (LIS) and then communicated to the clinics via paper copy, where they are recorded onto paper TB registers. The TB registers are sent to the subdistrict TB office, where the information is captured into the Department of Health (DOH) TB Surveillance System, the Electronic TB Register (ETR; Idema C, Improving TB management in South Africa through the electronic TB register, unpublished presentation at South Africa TB Conference, Durban, South Africa, 1–4 July 2008).4,5 The ETR is used to generate reports used by programme managers to determine disease burden, monitor TB management and allocate resources; the accuracy of the sputum results in the ETR is therefore paramount to the programme’s ability to effectively control and manage TB.
A joint WHO DOH review of South Africa’s National Tuberculosis Programme (NTP) in 2009 found discrepancies in consistency and quality between the data management systems (paper-based vs. ETR).6 Inconsistencies in specimen collection, completion of laboratory requisition forms, patient follow-up and reconciliation of specimens submitted and laboratory results received were also noted. More recently, a national evaluation of the ETR found that ETR data are often incomplete and inconsistent with other patient data sources.7 The study noted that only 52.3% of patients in the provincial ETR had pre-treatment (diagnostic) smear results recorded, raising concerns about the integrity of the smear examination information contained in the ETR. Several studies in other settings have also demonstrated discordances between clinic- and laboratory-based data on laboratory specimens used for diagnosis, follow-up and determination of treatment outcome.4,8,9 An evaluation in Botswana reported that of 374 patients with pre-treatment sputum smears results missing in the ETR, 60% actually had a sputum smear result in the laboratory.9 Others have also reported finding more individuals with smear-positive results in laboratory records than in clinic records.8,9
The aim of the current study was to validate the information on sputum results recorded and reported in the ETR from health facilities in KwaZulu-Natal Province based on data in the laboratory registers.
METHODS
A retrospective evaluation was conducted among all AFB smear-positive TB patients recorded in the ETR during the fourth quarter of 2009 (October–December) in KwaZulu-Natal. Patient data from the ETR were collected and compared with those in the laboratory TB sputum smear registers or the LIS.
Sampling/study population
All 11 districts in the province were included in the study. In Ethekwini District, which has the highest population and greatest TB burden in the province, six facilities with the greatest TB burden based on the ETR were randomly selected. For all other districts, four high-burden facilities were selected. High-burden facilities were identified as those with a TB caseload of >250 per annum or those with the highest burden per district. For each facility, up to 30 patients (up to 45 in Ethekwini District) from the ETR were randomly selected. If the facility reported fewer than 30 patients for the quarter, all patients were included.
Data collection
For each patient, the patient’s date of birth, sex, patient category, disease classification, specimen collection date, smear result and smear grading on each specimen, treatment start date, treatment outcome and treatment outcome date was abstracted from the ETR. Using this information, patients were manually linked to their test results in the laboratory registers. Information for each specimen was collected from the laboratory register and recorded.
Definitions
Smear conversion was defined as having an AFB-positive result at diagnosis and a negative result at the end of the intensive phase of TB treatment (2 months for new cases and 3 months for retreatment cases).
The only treatment outcomes that could be verified in the laboratory register were those dependent on sputum smear results: cure and failure. ‘Cure’ was defined as those patients with a negative end-of-treatment smear result, with a previous negative smear result at least 30 days before the end of treatment. ‘Treatment failure’ was recorded for patients with a positive end-of-treatment smear result. ‘Treatment completed’ was defined as a negative end-of-treatment smear, with no previous negative smear recorded.
Data analysis
The proportion of diagnostic smear-positive results recorded in the ETR that were able to be validated in the laboratory register was calculated. Among those patients confirmed as smear-positive at TB diagnosis for whom a smear result was available at the end of the intensive phase of treatment, the proportion with smear conversion derived from the ETR was compared with that derived from the laboratory.
Among confirmed smear-positive TB patients with an end-of-treatment smear result, the proportion of each outcome (cure, failure and treatment completed), as derived from the ETR, was compared with that in the laboratory records.
All analyses were conducted using Stata version 11 (Stata Corp, College Station, TX, USA) using survey methods. Confidence intervals (95%CIs) take into account the complex design and individual sample weights. Sample weights were based on the proportion of records selected at each site coupled with measure-of-size indicator for the probability of site selection. Weighted percentages and unweighted counts are reported. McNemar’s χ2 test was used to compare agreement between the ETR and the laboratory results; P < 0.05 was considered statistically significant.
Ethical review
The study was reviewed and approved by the Ethics Committee of the South African Medical Research Council. The study was also reviewed by the US Centers for Disease Control and Prevention and determined to be non-research, thereby not requiring approval by the institutional review board for research in human subjects. Permission for the study was granted by the KwaZulu-Natal Provincial Department of Health.
RESULTS
Diagnosis
Of the 46 facilities, 38 reported less than the target sample size of smear-positive patients on the ETR; thus only 1036 smear-positive patients were found in the ETR. Of these, 683 (65.9%, weighted 66.2%) had positive smear results in the laboratory register (Figure 1).
Figure 1.
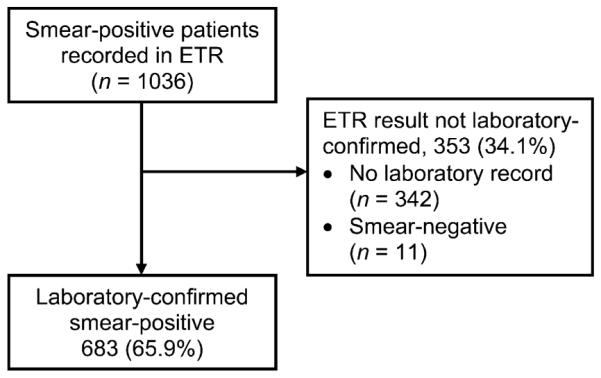
Diagnosis: flow chart of patients identified as having smear-positive tuberculosis in the ETR and availability and concordance of smear results in the ETR and laboratory register at diagnosis. ETR = Electronic TB Register.
Negative conversion at end of the intensive phase
Among the 683 patients confirmed as smear-positive at TB diagnosis, 364 (53.2%, weighted 54.9%) had their smear results recorded in the ETR at the end of the intensive phase of treatment (Figure 2). Of these, 326 (89.6%, weighted 90.6%, 95%CI 86.2–93.7) were recorded as having converted to smear-negative in the ETR and 224 (61.5%, weighted 65.9%, 95%CI 59.8–71.5) were recorded as smear-negative in the laboratory at the end of the intensive phase. However, 108 (29.7%, weighted 26.9%) patients in the ETR did not have a laboratory record. Of the 256 with results in both the ETR and the laboratory register, 224 (87.5%, weighted 90.3%, 95%CI 84.6–93.7) were recorded as smear-negative in the laboratory compared to 227 (88.7%, weighted 90.5%, 95%CI 85.0–94.1) in the ETR (P = 0.5).
Figure 2.

End of intensive phase: flow chart of patients identified as having smear-positive tuberculosis in the ETR and availability and concordance of smear results in the ETR and laboratory register at the end of the intensive phase. ETR = Electronic TB Register.
Of the 364 patients with ETR smear results available to determine smear conversion at the end of the intensive phase, 323 (88.7%, weighted 88.0%) were new patients and 41 (11.3%, weighted 11.5%) were retreatment cases. For new patients, 286 (88.5%, weighted 89.4%, 95%CI 84.4–93.0) were recorded as having converted to smear-negative in the ETR compared to 196 (60.7%, weighted 66.2%, 95%CI 59.9; 71.9) in the laboratory. For retreatment patients, 40 (97.6%, weighted 97.6%, 95%CI 79.9; 99.8) were recorded as converting to negative in the ETR compared to 28 (68.3%, weighted 64.1, 95%CI 43.5–80.5) in the laboratory.
End-of-treatment outcome
Of the initial 683 patients diagnosed as smear-positive, less than half (n = 331, 48.5%, weighted 49.4%) had end-of-treatment smear results recorded in the ETR (Figure 3). Three hundred and twenty-five (47.6%) patients were lost to follow-up and 27 (4.0%) had no smear result or outcome recorded at the end of treatment. Among the 331 patients with end-of-treatment smear results in the ETR, the proportion recorded as cured was significantly different between the ETR and the laboratory (n = 302, 91.2%, weighted 90.3%, 95%CI 85.3–93.8 vs. n = 108, 32.6%, weighted 28.4 %, 95%CI 23.9–33.3). Of the 302 patients with a cure result in the ETR, only 105 (34.8%, weighted 30.1%) were able to be confirmed as cured in the laboratory, and 17 (5.6%, weighted 4.0%) were recorded as treatment completed; the remaining 180 (59.6%, weighted 65.2%) had no laboratory record.
Figure 3.

End of treatment: flow chart of patients identified as having smear-positive tuberculosis in the ETR and availability and concordance of smear results in the ETR and laboratory register at the end of treatment. ETR = Electronic TB Register.
Of the five patients (1.5%, weighted 1.3%) recorded as treatment failures in the ETR, none were recorded as having failed treatment in the laboratory: 1 was established as bacteriologically cured, 1 had completed treatment and 3 did not have a laboratory record.
DISCUSSION
This study identified a major lack of supporting evidence at the laboratory for the validation of sputum smear results in the ETR. Over one third of TB patients registered as smear-positive at diagnosis in the ETR could not be confirmed by laboratory results. While the ETR reported high smear conversion rates among this cohort of smear-positive TB patients, just over half were able to be verified in the laboratory. Less than half of the high cure rates recorded for this cohort in the ETR could be verified in the laboratory database. Although only a few patients were deemed to be failures according to the ETR, the conflicting results recorded at the laboratory suggest that some patients may not be managed appropriately.
This study identified some (1.1%) patients who were misclassified as smear-positive in the ETR at diagnosis who were actually smear-negative according to their laboratory smear results. This is similar to another study in South Africa, where 3/204 (1.5%) were incorrectly recorded as smear-positive in the TB register, and 42 (20.6%) were incorrectly recorded as smear-negative.10 Inaccurate recording could affect individual patient care. If patients are managed according to their smear results and their diagnostic smear is inaccurately recorded, health care workers may be inappropriately treating some patients and may miss drug-resistant TB. For a TB programme to be effective, managers must have confidence in the accuracy of the ETR.
The study also identified that many patients did not have a laboratory record at the end of the intensive phase or at the end of treatment, leading to uncertainties about the validity of the smear results and final outcomes recorded in the ETR. This was the case for both new and retreatment patients.
It is unclear why a high proportion of smear results could not be located in the laboratory. This study was conducted during the transition from a paper-based to an electronic laboratory register, and it is possible that some cases were not recorded or were incompletely entered during the transition. In addition, there could have been inaccuracies in the ETR information used to locate records at the laboratory. A study evaluating TB information in two South African communities suggested that inaccuracies in laboratory data may be due to errors on the specimen request form and data recording in the laboratory.11
This study had several limitations. The sampling strategy selected patients recorded as smear-positive in the ETR at diagnosis and then verified their smear results against laboratory records. Using this approach, many of the results could not be found in the laboratory. However, the study aimed to be most useful for the NTP and was therefore purposefully conducted from the perspective of the NTP manager to evaluate the accuracy of the smear results in the ETR. We attempted to link cases in the ETR to the laboratory by using patient name, sex, date of birth and specimen collection date. However, the information on the laboratory request forms was not intended for research purposes and was not collected diligently; these fields were thus often missing, contained misspellings and/or were misclassified. As a result, we were unable to identify or find many patients in the laboratory register. Furthermore, patients are often diagnosed at one facility and are moved or transferred elsewhere for management. Due to the lack of a unique identifier within the surveillance/ETR system, we were unable to find records for patients who may have had results in the laboratory under a different facility or catchment area. Another limitation was that the sample size fell short of the projected size based on the previous annual caseload. The sample size was therefore selected and weighted according to the actual number of records of smear-positive cases reported by the clinic.
Several recommendations can be made to address the issues emerging from our study findings. Placing more emphasis on the importance of sputum collection and bacteriological testing at diagnosis and followup could improve patient management and improve the quality of statistics based on bacteriological testing. Incorporation of a unique patient identifier for TB patients would greatly assist in following up patients who have moved or transferred and provide better understanding of TB patient management. An investment in quality assurance to ensure that data are recorded completely and accurately in the laboratory register, health facility paper registers and, ultimately, in the ETR would enhance the capacity of the NTP to understand the TB burden and assess programme performance. Finally, linkage between clinical and laboratory data systems would help to address the problem of missing cases and incomplete data. These types of systems have been implemented in other settings, with demonstrated improvements in the quality and timeliness of laboratory data, showing fewer errors and fewer missing laboratory results at health centres.12,13 A sputum result management system aiming to improve TB patient management is currently being piloted in a number of clinics in Cape Town, South Africa.11
CONCLUSION
The large proportion of persons with missing laboratory data and of TB patients registered in the ETR as smear-positive whose diagnosis could not be confirmed in laboratory records is of great concern. This gives rise to uncertainty as to the validity of the follow-up smear results and final outcomes recorded in the ETR. As key indicators for evaluating NTPs rely heavily on sputum smear results, greater emphasis needs to be placed on ensuring that laboratory data are complete and accurate. With electronic registers now operational at laboratories, further research is needed to confirm complete logging of all sputum samples received, and accurate recording of results. Direct linkage between the laboratory and ETR would minimise missing data and discrepancies and more accurately inform the TB programme.
Acknowledgements
The authors express their appreciation to the National Health Laboratory Service, the National Department of Health and the Department of Health staff in KwaZulu-Natal who made this study possible. The authors also acknowledge the contributions of the study staff who committed their time to the aims of this study.
This project was made possible through the support and collaboration with the Centers for Disease Control and Prevention (CDC) and the South African Medical Research Council (Cooperative Agreement 5 387 U51 PS000729-05, PA PS07-006). The findings and conclusions in this report are those of the authors and do not necessarily represent the official position of the CDC.
Footnotes
Conflict of interest: none declared.
References
- 1.World Health Organization . Global tuberculosis control. WHO; Geneva, Switzerland: 2011. WHO report 2011. WHO/HTM/TB/2011.16. http://www.who.int/tb/publications/global_report/2011/gtbr11_full.pdf Accessed July 2013. [Google Scholar]
- 2.KwaZulu-Natal Department of Health . Electronic Tuberculosis Register. KZN DoH; Pietermaritzburg, South Africa: 2009. [Google Scholar]
- 3.South Africa National Department of Health, The National Tuberculosis Control Programme . National tuberculosis management guidelines. DoH; Pretoria, South Africa: 2009. [Google Scholar]
- 4.Vranken P, Coulombier D, Kenyon T, et al. Use of a computerized tuberculosis register for automated generation of case finding, sputum conversion, and treatment outcome reports. Int J Tuberc Lung Dis. 2002;6:111–120. [PubMed] [Google Scholar]
- 5.South Africa National Department of Health ETR.Net: country implementations. Pretoria, South Africa: DoH, 2007. www.etrnet.info/CountryImplementations.aspx Accessed August 2013.
- 6.World Health Organization. Republic of South Africa National Department of Health . Joint review of the National TB Control Programme: South Africa, 6–17 July 2009. WHO; Geneva, Switzerland: 2009. [Google Scholar]
- 7.Podewils LJ, Bronner LE. National Department of Health Report. Department of Health; Pretoria, South Africa: 2012. Assessment of the Republic of South Africa National Tuberculosis Control Program Surveillance System and Electronic Tuberculosis Register. [Google Scholar]
- 8.Creek TL, Lockman S, Kenyon TA, et al. Completeness and timeliness of treatment initiation after laboratory diagnosis of tuberculosis in Gaborone, Botswana. Int J Tuberc Lung Dis. 2000;4:956–961. [PubMed] [Google Scholar]
- 9.Fatima R, Ejaz Q, Enarson DA, Bissell K. Comprehensiveness of primary services in the care of infectious tuberculosis patients in Rawalpindi, Pakistan. Public Health Action. 2011;1:13–15. doi: 10.5588/pha.11.0005. [DOI] [PMC free article] [PubMed] [Google Scholar]
- 10.Alpers L, Chrouser K, Halabi S, et al. Validation of the surveillance system for tuberculosis in Botswana. Int J Tuberc Lung Dis. 2000;4:737–743. [PubMed] [Google Scholar]
- 11.Dunbar R, Lawrence K, Verver S, et al. Accuracy and completeness of recording of confirmed tuberculosis in two South African communities. Int J Tuberc Lung Dis. 2011;15:337–343. [PubMed] [Google Scholar]
- 12.Blaya JA, Shin SS, Yagui MJ, et al. A web-based laboratory information system to improve quality of care of tuberculosis patients in Peru: functional requirements, implementation and usage statistics. BMC Med Inform Decis Mak. 2007;7:33. doi: 10.1186/1472-6947-7-33. [DOI] [PMC free article] [PubMed] [Google Scholar]
- 13.Blaya JA, Shin SS, Yale G, et al. Electronic laboratory system reduces errors in National Tuberculosis Program: a cluster randomized controlled trial. Int J Tuberc Lung Dis. 2010;14:1009–1015. [PMC free article] [PubMed] [Google Scholar]