

SUMMARY
Infection of the snail, Biomphalaria glabrata, by the free-swimming miracidial stage of the human blood fluke, Schistosoma mansoni, and its subsequent development to the parasitic sporocyst stage is critical to establishment of viable infections and continued human transmission. We performed a genome-wide expression analysis of the S. mansoni miracidia and developing sporocyst using Long Serial Analysis of Gene Expression (LongSAGE). Five cDNA libraries were constructed from miracidia and in vitro cultured 6- and 20-day-old sporocysts maintained in sporocyst medium (SM) or in SM conditioned by previous cultivation with cells of the B. glabrata embryonic (Bge) cell line. We generated 21 440 SAGE tags and mapped 13 381 to the S. mansoni gene predictions (v4.0e) either by estimating theoretical 3′ UTR lengths or using existing 3′ EST sequence data. Overall, 432 transcripts were found to be differentially expressed amongst all 5 libraries. In total, 172 tags were differentially expressed between miracidia and 6-day conditioned sporocysts and 152 were differentially expressed between miracidia and 6-day unconditioned sporocysts. In addition, 53 and 45 tags, respectively, were differentially expressed in 6-day and 20-day cultured sporocysts, due to the effects of exposure to Bge cell-conditioned medium.
Keywords: Schistosoma mansoni, Biomphalaria glabrata, SAGE, miracidia, sporocyst, development
INTRODUCTION
Schistosomiasis is a major public health problem, mainly in the tropics, with an estimated 200 million individuals infected and 650 million living in endemic areas (http://www.who.int/schistosomiasis/en/). The causative agents are digenetic parasitic flatworms of the genus Schistosoma, which have a complex life cycle involving 2 obligate hosts ; a mammalian definitive host (human) and snail intermediate host. Adult male and female worms, depending on the species, inhabit the vasculature of the urinary plexus or mesenteric venules surrounding the large intestine, where they produce eggs that escape to the environment in urine or feces. In freshwater, free-swimming miracidia contained within eggs hatch and, upon finding a suitable snail intermediate host, directly penetrate the snail mantle to initiate an infection (Basch, 1991). Post-penetration, the miracidium sheds its ciliary epidermal plates, during which time a tegumental syncytium covers the entire larval surface as it transforms to the parasitic primary or mother sporocyst stage (Basch and DiConza, 1974). This developmental transition from free-living to parasitic state within the snail host is crucial to successful establishment of infections, and is presumed to involve dramatic physiological changes both at the biochemical and molecular levels. However, to date few studies have focused on the molecular basis of larval transformation or the identification of genes regulating subsequent asexual development of and embryogenesis within subsequent sporocyst generations.
Previously, high-throughput cDNA or oligonucleotide DNA microarrays have been used to compare the expression of thousands of genes in a variety of S. mansoni stages, including adult male and female worms (Hoffman et al. 2002; Fitzpatrick et al. 2005; Verjovski-Almeida et al. 2007; Waisberg et al. 2007) as well as larval stages, including daughter sporocysts and cercariae (Jolly et al. 2007). In a recent study Vermeire et al. (2006) identified a large number of gene expression changes in S. mansoni miracidia compared to 6-day in vitro cultured sporocysts using a DNA microarray (MA) spotted with oligonucleotide probes corresponding to ESTs or full-length mRNAs derived mainly from adult worms, eggs, and cercariae, with <5% originating from miracidia or sporocyst sequences. Despite this over-representation by cercarial and adult genes, approximately 60% of the array probes, representing individual mRNA transcripts, were expressed in miracidia and/or sporocysts, with a significant number being differentially expressed between these stages (Vermeire et al. 2006). Considerable overlap in transcribed genes thus exists between stages. However, microarrays are limited to analysing only previously identified transcripts. In this way they constitute a ‘closed’ gene expression profiling platform, limited to predetermined or known sets of genes.
Serial Analysis of Gene Expression (SAGE) is a sequence based gene-expression profiling tool that can be utilized to generate quantitative transcriptional profiles of genes in an organism. In SAGE, a short sequence tag from a unique position of each mRNA molecule is used to uniquely identify the source gene from within the genome (Velculescu et al. 1995). Sequence tags are isolated from an mRNA sample and are linked together to form long con-catenated molecules that are cloned and sequenced. The population of tags defines patterns of expression of individual genes. Quantification of all tags provides a relative measure of gene expression (i.e., mRNA abundance). SAGE thus provides both the identity of expressed genes and levels of their expression. SAGE constitutes an ‘open’ platform, providing a rapid and comprehensive approach for elucidation of quantitative gene expression patterns not dependent upon prior availability of transcript information. In addition, the sequences generated can be used to identify previously unknown genes through the application of tag-based reverse transcription- polymerase chain reaction (RT-PCR), i.e., use of tag sequences to design primers for amplifying unknown cDNA sequences, leading to gene identification and elucidation of function.
In preliminary experiments involving gene expression patterns across the entire S. mansoni life cycle, SAGE has demonstrated excellent potential for stage-associated gene profiling (Williams et al. 2007). Recently, SAGE has been used to identify transcriptional changes in adult worms in response to nitric oxide exposure (Messerli et al. 2006). Ojopi et al. (2007) used SAGE to identify expressed transcripts in pooled adult male and female worms, but did not identify any stage-related changes in transcript levels. The SAGE tags used by Ojopi et al. (2007) were only 14 bp long, potentially leading to errors in data analysis ; specifically the problem of a single tag matching multiple transcripts.
In the present study, LongSAGE was used to compare gene expression profiles for S. mansoni miracidia, 6-day in vitro cultured primary sporocysts and 20-day in vitro cultured sporocysts to quantitatively assess commonly- and differentially-expressed genes during early larval development of this parasite. LongSAGE is a highly specific quantitative method of gene expression profiling that generates 21 bp tags, of which theoretical modelling predicts that>99.8%are expected to match only once to a human-sized genome (Saha et al. 2002). We combined SAGE data with the gene predictions/ annotations of the S. mansoni genome (v4.0e) and modelled theoretical 3′ UTR lengths for genes without 3′ EST sequence data to generate the most up-to-date analysis of the S. mansoni larval transcriptome during establishment of intramolluscan infections. The 6- and 20-day time-points were chosen to determine transcriptional changes associated with 2 very important developmental time-points in early larval development. After 6-days of in vitro culture the miracidia have all transformed and are transitioning from a free-living to parasitic stage and at 20-days the in vitro-cultured sporocysts are beginning to form brood chambers to produce the second generation of daughter/secondary sporocysts. In addition, we also investigated the effects of sporocyst exposure to snail Bge cell products, predicted to enhance larval growth/embryogenesis on gene expression (Yoshino and Laursen, 1995).
MATERIALS AND METHODS
Parasite culture
Schistosoma mansoni (NMRI strain) eggs were recovered from the livers of mice at 7–8 weeks post-infection as described by Yoshino and Laursen (1995). Miracidia were hatched from the eggs in sterile artificial pond water and concentrated on ice in conical polypropylene centrifuge tubes. Miracidia were isolated at 15-min intervals over a 2 h period. Cold-immobilized miracidia were either centrifuged for 1 min at 500 g and immediately harvested for total RNA or were pooled and transferred to a 24- well culture plate to permit transformation into primary sporocysts followed by culturing for 6 or 20 days under normoxic conditions at 26 °C in either S. mansoni sporocyst medium (SM; Ivanchenko et al. 1999) or SM previously conditioned with Biomphalaria glabrata embryonic (Bge) cells. Conditioned SM was used in these larval SAGE studies to determine the effect of snail-derived components on sporocyst gene expression. Control (unconditioned) and conditioned media inwells containing sporocysts were changed at 2-day intervals. At 6-day (6d) and 20-day (20d) developmental time-points total RNA from all cultured sporocysts (6d control, 6d conditioned, 20d control and 20d conditioned) was isolated using TRIzol® reagent (Invitrogen, Carlsbad, CA) according to the manufacturer’s instructions.
Bge cell culture and production of conditioned media
The Biomphalaria glabrata embryonic (Bge) cell line (ATCC CRL 1494) was used to produce snail cell-conditioned sporocyst medium (SM) for use in sporocyst in vitro culture experiments. Bge cells were maintained in 250-ml tissue culture flasks (Falcon™, BD Biosciences, San Jose, CA) containing Bge medium (Hansen, 1976) supplemented with heat-inactivated 10% fetal bovine serum (cBge), penicillin G (0 · 06 mg/ml) and streptomycin sulfate (0·05 mg/ ml) at 26 °C under normal atmospheric conditions. Bge cells were grown to confluence, washed once with snail phosphate-buffered saline (sPBS; Yoshino, 1981) pH 7·2, suspended in sPBS by gentle spraying of buffer to detach them from the flask wall, removed from the flasks, and washed an additional 2 times with sPBS. The cells were then resuspended in SM supplemented with 5% heat-inactivated fetal bovine serum and cultured in 250-ml flasks for 48 h prior to use in sporocyst culture experiments. After the 48 h incubation period these media were considered conditioned (designated ‘conditionedSM’) and were removed from the flasks containing Bge cells, centrifuged for 10 min at 500 g at 4 °C to remove cellular debris, and immediately introduced into parasite culture experiments as described above.
Long Serial Analysis of Gene Expression (LongSAGE)
SAGE libraries were constructed using 30 μg of total RNA isolated from miracidia and 6d- and 20d-old in vitro-cultured primary sporocysts following the I-SAGE Long Kit protocol (Invitrogen, Carlsbad, CA) following the manufacturer’s instructions, with the exception of the use of pGEM3Z as the cloning vector. One Shot TOP10 Electrocomp E. coli cells (Invitrogen) were transformed with recombinant pGEM3Z clones containing SAGE concatemers by electroporation using an Eppendorf (Westbury, NY) E. coli electroporation apparatus. Plasmid sequencing templates were prepared from 1·2 ml cultures using alkaline lysis as performed by a RevPrep Orbit robotic workstation (GeneMachines, San Carlos, CA). Sequencing reactions were run on an ABI 3730xl capillary DNA sequencer. Recombinant pGEM3Z clones containing SAGE concatemers were sequenced using only the M13F primer to avoid duplicate sampling of SAGE tags due to overlapping bidirectional sequences from individual clones.
Sequences collected were analysed with software created specifically for Schistosoma SAGE analysis. The SAGE software extracts ditag sequences from the ABI 3730xl results according to the SAGE sequence grammar, passes out individual SAGE tags, and reduces all SAGE tags to a table of uniqueSAGE tag sequences and their observed frequencies among all of the Schistosoma SAGE libraries. In cases where a ditag sequence was sampled more than once, only 1 representative was used in generating tag frequencies (Emmersen, 2008a). Tags that contained base call ambiguities or bases with PHRED (Ewing et al. 1998; Ewing and Green, 1998) values of less than 10 (10% or greater chance of incorrect base call) were excluded from analyses (Emmersen, 2008b). Additional putative sequencing error was removed by identifying SAGE tag sequences that did not have a perfect sequence match in the set of genome project gene predictions and that did not appear more than once in any of the SAGE libraries. As such, tags appearing at least twice in at least one SAGE library but that did not have a sequence match within the predicted genes were assumed to be from legitimate rare transcripts, from allelic variants, or unsequenced regions of the genome and were retained for analysis of differential gene expression.
SAGE tag sequences were mapped to genes predicted by the ongoing genome project (version 4.0e) using custom software created specifically for Schistosoma SAGE. As SAGE tags are generated from the 3′-most NlaIII restriction site of the transcript, we included observed (EST) or theoretical 3′ UTR sequences when assigning tags to genes. Of all the genes predicted by the ongoing genome project (version 4.0e), 5334 had empirical EST data for 3′ UTR lengths. In these cases, the 3′ UTR sequence used for assignment of SAGE tags to genes was that predicted by the ESTs. The 99% confidence of the observed 3′ UTR lengths was determined (1388 bp) and for genes without EST data this length was used to predict 3′ UTR sequences from the genome.
In order to identify potential differentially-expressed gene between stages, tags were assigned an R-value, the log-likelihood ratio statistic of Stekel et al. (2000), which scores tags by their deviation from the null hypothesis of equal frequencies. Higher scores represent a greater deviation from the null hypothesis, while scores close to zero represent near constitutive expression. For this study, an R-value of ≥4 was used as a conservative measure to denote significant differences in gene expression between compared libraries (Stekel et al. 2000). In addition, Fisher’s exact test was used to compare the effects of Bge cell-conditioning on the 6-d and 20-d sporocysts.
Quantitative PCR
Total RNA was extracted using TRIzol as described above. Single-stranded cDNA was synthesized using the SuperScript III First-Strand Synthesis System for RT-PCR (Invitrogen, Carlsbad CA). Quantitative real-time PCR (qPCR) primers were designed using Primer Express software (Applied Biosystems, Foster City, CA). qPCR was performed in a GeneAmp 7300 PCR apparatus in a 96-well format using SYBR green chemistry. Theoretical tag numbers were approximated by setting the highest Ct value to 1 (Smp_134670.2) and each increasing cycle number corresponds to a 2-fold increase in transcript abundance. This calculation assumes that amplification efficiency is similar for each primer set.
RESULTS
SAGE libraries
Five SAGE libraries were constructed from miracidia, 6-day unconditioned sporocysts, 6-day Bge cell-conditioned sporocysts, 20-day unconditioned sporocysts, and 20-day Bge cell-conditioned sporocysts, resulting in 68 450, 68 044, 60 171, 30 684 and 52 666 sequenced tags, respectively, after removal of sequencing error (Williams et al. 2007). The total number of unique SAGE tag sequences obtained from all 5 libraries was 21 440, including 8180 detecting sense transcription of a single gene, 4544 detecting anti-sense transcription of a single gene, 625 unresolved among possible sense transcription of several genes, 32 unresolved among possible antisense transcription of several genes, and 8059 not assigned to a gene. Of the 8059 unassigned tags, 2836 matched the genome but were not associated with any predicted gene or known transcript, 1900 matched the genome in multiple locations, and 3233 did not match the genome at all. Of the 13 185 transcripts predicted by the ongoing genome project, 12 879 (96.7%) contained at least one NlaIII site and are detectable by SAGE. All SAGE data were deposited to GenBank’s GEO database under Accession number GSE9722.
Gene abundance
Of the 21 440 unique tag sequences observed in the 5 SAGE libraries, 30·4% had a frequency of 1, 37·1% a frequency of 2–5, 10·8% a frequency of 6–9, 19·8% a frequency of 10–99, and 1.9% a frequency of ≥100 at their highest observed abundance. Of the most abundant tags (frequency ≥100), 253 detected sense transcription of a single gene, 7 detected anti-sense transcription of a single gene, 39 were unresolved among multiple sense and/or anti-sense transcripts, and 113 were not assigned to a gene. For genes assigned both sense and anti-sense SAGE tags, a strong inverse correlation existed between the antisense : sense frequency ratio and the sense tag frequency (Fig. 1).
Fig. 1.
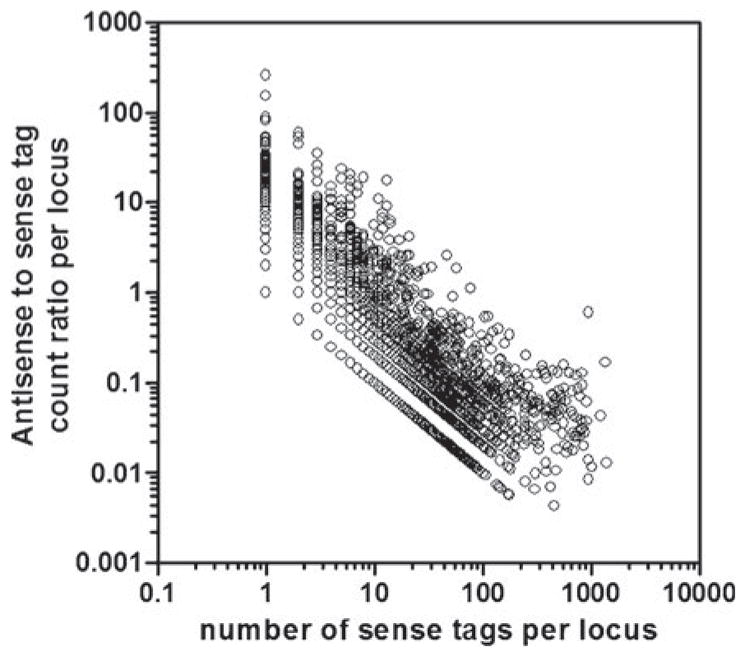
Correlation between anti-sense : sense frequency ratio and the sense tag frequency for genes assigned both sense and anti-sense SAGE tags.
Using Blast2GO (Conesa et al. 2005) we identified level 3 molecular function gene ontology (GO) categories for 99 of the most abundant 150 tags (Fig. 2). The most highly represented functional categories included genes involved in transcription, translation, ion binding and oxidoreductase activity. There were 2147 SAGE tags uniquely expressed inmiracidia and 9739 SAGE tags uniquely expressed in sporocysts. A comparison of the level 2 molecular function gene ontology categories between uniquely expressed miracidia and sporocyst transcripts revealed 2 categories, binding and catalytic activities, dominated gene expression in both miracidia and sporocysts, comprising >80% of the total transcriptome (Table 1). Although the overall pattern of unique miracidia and sporocyst transcript GO categories is similar, this may represent different transcripts performing similar molecular functions in the various stages. GO categories enriched in unique sporocyst transcripts include structural molecules, plus antioxidant and enzyme regulator activities, while chaperone activity was enriched in unique miracidial transcripts. In addition, we identified 911 SAGE tags uniquely expressed in miracidia and 3608 SAGE tags uniquely expressed in sporocysts corresponding to non-predicted and unknown transcripts or SAGE tag sequences not matching the genome.
Fig. 2.

Level 3 molecular function GO categories for the most highly expressed transcripts in the 5 Schistosoma mansoni SAGE libraries. Percentages represent the frequency of each term.
Table 1.
Transcripts uniquely expressed in Schistosoma mansoni miracidia (2,147 SAGE tags corresponding to 448 transcripts) or sporocysts (9739 SAGE tags corresponding to 2104 transcripts) within various GO categories, also included are unique unknown SAGE tags
| Gene ontology category | Transcripts uniquely present in miracidia (%) | Transcripts uniquely present in sporocysts (%) |
|---|---|---|
| binding | 222 (49·6) | 1030 (48·9) |
| catalytic activity | 144 (32·1) | 662 (31·5) |
| transporter activity | 22 (4·9) | 119 (5·7) |
| transcription regulator activity | 18 (4) | 93 (4·4) |
| molecular transducer activity | 14 (3·1) | 49 (2·3) |
| enzyme regulator activity | 13 (2·9) | 37 (1·8) |
| translation regulator activity | 5 (1·1) | 18 (0·9) |
| structural molecule activity | 4 (0·9) | 66 (3·1) |
| motor activity | 4 (0·9) | 21 (1) |
| auxiliary transport protein activity | 1 (0·2) | 3 (0·1) |
| chaperone activity | 1 (0·2) | 1 (0·05) |
| antioxidant activity | 0 (0) | 3 (0·1) |
| Unknown SAGE tags | 911 | 4519 |
Differential expression of genes during development in miracidia, 6-day sporocysts and 20-day sporocysts
We identified 432 differentially expressed tags during larval development by comparison of all 5 SAGE libraries (R≥4). Differentially expressed sense SAGE tags are listed in Table 2, while all tags are shown in supplemental data file 1. Due to the limits of space, only tags with R≥7 are shown. The major classes of genes upregulated in miracidia compared to sporocysts were calcium-binding proteins (SME16, Calcineurin, 22·6 kDa tegument-associated antigen and synaptogagmin), heat shock proteins (HSP70, HSP90 and HSP27) and genes involved in cellular energy production (mitochondrial carrier protein, lactate dehydrogenase and phosphoglycerate kinase). The major classes of proteins upregulated in sporocysts compared to miracidia were associated with transcription and translation (elongation factor 1-alpha, polyadenylate binding protein, and many ribosomal proteins). Some heterogeneity may exist in the transcript levels of individual miracidia or sporocysts; however, the use of large populations of parasites more accurately reflects the transcriptomic profiles of the developmental stages sampled.
Table 2.
Sense tags differentially expressed (R≥7) between the 5 libraries (Values represent the individual tag percentage abundance in a given library.)
| SAGE tag sequence | R-Value | Miracidia | 6-day unconditioned sporocysts |
6-day conditioned sporocysts |
20-day unconditioned sporocysts |
20-day conditioned sporocysts |
Description |
|---|---|---|---|---|---|---|---|
| (a) Highest expression in miracidia | |||||||
| CATGTTTGTGTTAATTTCCGA | 162·18 | 0·00764 | 0·00113 | 0·00138 | 0·00062 | 0·00053 | Smp_049240 Heat-shock protein beta-1 (HspB1) (HSP 27), putative |
| CATGTTTTTCAAATAATAATT | 123·62 | 0·00313 | 0·00003 | 0·00003 | 0 | 0 | Smp_096390.2 calcium-binding protein (SME16), putative |
| CATGACAAAGCACAACATTGT | 100·45 | 0·00257 | 0·00001 | 0·00003 | 0·00003 | 0 | Smp_126100 hypothetical protein |
| CATGTATTTTATCTCCTTTTT | 73·03 | 0·00222 | 0·00006 | 0·00007 | 0·00007 | 0·00009 | Smp_071390 adenylate kinase, putative |
| CATGAATTAAAACAATTTGTA | 55·67 | 0·00133 | 0 | 0 | 0 | 0 | Smp_154690 ribosomal protein related |
| CATGTGGACAGACAAAAAAAA | 51·01 | 0·00149 | 0·00003 | 0·00005 | 0·00003 | 0·00004 | Smp_176700 expressed protein |
| CATGATTAATTTGAATGTTAA | 36·19 | 0·00238 | 0·00029 | 0·00047 | 0·0014 | 0·00085 | Smp_067800 fibrillin 2, putative |
| CATGATCACTAAATAAATGTC | 33·09 | 0·00095 | 0·00006 | 0 | 0 | 0·00004 | Smp_097490 P25 alpha-related |
| CATGGGTCAAAATCTGGTTAA | 32·74 | 0·00108 | 0·00007 | 0·00012 | 0 | 0·00002 | Smp_078590 expressed protein |
| CATGTACATCCTGTATTTCCT | 31·98 | 0·00224 | 0·00038 | 0·0005 | 0·00081 | 0·00047 | Smp_003770 histone h1/h5, putative |
| CATGGAAGAAGTGGATTAGCT | 25·14 | 0·0047 | 0·00197 | 0·00273 | 0·00261 | 0·00177 | Smp_072330·2 heat shock protein, putative |
| CATGCGACAATCATTAAAAAA | 24·47 | 0·00058 | 0 | 0 | 0 | 0 | Smp_122820 expressed protein |
| CATGTTCAATATTAGTATTCA | 18·07 | 0·00133 | 0·00028 | 0·00048 | 0·00033 | 0·00021 | Smp_145300 peptidylglycine alpha hydroxylating mono-oxygenase, putative |
| CATGGCTATTGATATGAAATA | 15·32 | 0·00045 | 0 | 0·00005 | 0 | 0·00002 | Smp_096790 expressed protein |
| CATGCTTGCGGTTGCTTTCTC | 14·62 | 0·00041 | 0·00001 | 0·00002 | 0 | 0 | Smp_179260 alpha-galactosidase/alpha-n- acetylgalactosaminidase, putative |
| CATGTCAACTAGTTTTTCAAA | 14·01 | 0·00076 | 0·00013 | 0·00012 | 0·00007 | 0·00013 | Smp_074930 zinc finger protein, putative |
| CATGAAGGAAAGATAAGAAAT | 13·9 | 0·00047 | 0·00003 | 0·00002 | 0·00003 | 0·00002 | Smp_005710·1 egg protein CP391S, putative |
| CATGTATACGTGCACATTGTT | 12·68 | 0·00066 | 0·00012 | 0·00008 | 0·0001 | 0·00008 | Smp_079010 camp-dependent protein kinase type II-alpha regulatory subunit, putative |
| CATGCAAGTTAATTAATGAAA | 12·63 | 0·00105 | 0·00019 | 0·0003 | 0·00033 | 0·00036 | Smp_020920 DNAj homolog subfamily B member 4, putative |
| CATGGAATTAATAAGAATGAG | 12·22 | 0·00194 | 0·00091 | 0·00086 | 0·00078 | 0·00065 | Smp_163710 expressed protein |
| CATGAATAACTAAGGGTTACT | 11·84 | 0·00034 | 0 | 0·00002 | 0 | 0·00002 | Smp_173150 cd63 antigen-like |
| CATGGACTTAGATTAATGGGA | 11·52 | 0·00184 | 0·00066 | 0·00078 | 0·0013 | 0·00084 | Smp_069130.2 heat shock protein 70 (hsp70)-4, putative |
| CATGTGTTATTGTGAGTAAAA | 10·48 | 0·00127 | 0·00034 | 0·0008 | 0·00055 | 0·00046 | Smp_051210·1 importin alpha 3,4, putative |
| CATGGAGGAATAGTTAAGGTA | 10·38 | 0·00114 | 0·00037 | 0·00033 | 0·00036 | 0·00042 | Smp_193420 hypothetical protein |
| CATGTCATATGTTTATACCTT | 9·78 | 0·00044 | 0·0001 | 0·00007 | 0 | 0·00004 | Smp_047900 erk1/2, putative |
| CATGTTTAAATCCAATGGATG | 9·75 | 0·00039 | 0·00003 | 0·00002 | 0·00007 | 0·00006 | Smp_140000 tetraspanin-CD63 receptor, putative |
| CATGTGTTCTTGTTGTATCCA | 9·55 | 0·00039 | 0·00004 | 0·00007 | 0 | 0·00004 | Smp_076010 expressed protein |
| CATGTTGACACCAAACCTGGT | 9·23 | 0·00082 | 0·00024 | 0·00023 | 0·00029 | 0·00017 | Smp_043120 universal stress protein, putative |
| CATGATTTTATCAAATTAGTT | 8·82 | 0·00042 | 0·00004 | 0·00005 | 0·00003 | 0·00009 | Smp_138760 expressed protein |
| CATGCAAACACCAAGTGATGT | 8·52 | 0·00102 | 0·00047 | 0·00025 | 0·00088 | 0·00049 | Smp_146510 expressed protein |
| CATGTACTTTGATCAACACGA | 8·3 | 0·00051 | 0·00013 | 0·00007 | 0·00007 | 0·00011 | Smp_188780 hypothetical protein |
| CATGTGACTGATCTGGATAAA | 8·27 | 0·00072 | 0·00121 | 0·00103 | 0·00205 | 0·00158 | Smp_054160 Glutathione S-transferase 28 kDa (GST 28), putative |
| CATGGTTATGTAATTGCTTTT | 8·24 | 0·00108 | 0·00031 | 0·00058 | 0·00062 | 0·00038 | Smp_079270 crp-related |
| CATGATGTTTTTGCTTTGTTT | 8·23 | 0·00085 | 0·00019 | 0·00032 | 0·00026 | 0·00036 | Smp_151250 er lumen protein retaining receptor, putative |
| CATGGTTGCGACAAGCTGAAG | 8·08 | 0·00129 | 0·0006 | 0·0004 | 0·00059 | 0·00066 | Smp_122840 Hypothetical protein, putative |
| CATGAATTAAAACAAAAAAAA | 7·93 | 0·0002 | 0 | 0 | 0·00003 | 0 | Smp_154690 ribosomal protein related |
| CATGCCCACCACTTGTTAACT | 7·77 | 0·00105 | 0·00046 | 0·0003 | 0·00081 | 0·00049 | Smp_006390 cystatin B, putative |
| CATGCTGATTGTTGTTGCCAT | 7·67 | 0·00039 | 0·00007 | 0·00003 | 0·00003 | 0·00009 | Smp_136930 hypothetical protein |
| CATGGCTTACGATTTAAAGCG | 7·66 | 0·00023 | 0 | 0·00003 | 0·00003 | 0 | Smp_171960 short-chain dehydrogenase, putative |
| CATGGAAGTCATTATCTCATT | 7·64 | 0·00031 | 0·00001 | 0·00012 | 0 | 0·00004 | Smp_068500 hypothetical protein |
| CATGTACATTGTTTTCCTCCC | 7·64 | 0·00117 | 0·00041 | 0·00048 | 0·00055 | 0·00049 | Smp_089000·1 translocon-associated protein, delta subunit, putative |
| CATGACGTTTATATTGATCAA | 7·57 | 0·00037 | 0·00006 | 0·00003 | 0·00003 | 0·00006 | Smp_063330 hypothetical protein |
| CATGCATTTCCATTGTGTTTT | 7·55 | 0·00066 | 0·00013 | 0·00018 | 0·00026 | 0·00021 | Smp_061250 mitochondrial carrier protein, putative |
| CATGGGGTGGTCAAGAGCACT | 7·45 | 0·00085 | 0·00028 | 0·00022 | 0·00059 | 0·00053 | Smp_167270 expressed protein |
| CATGTTTTGGAGCACCACGTT | 7·11 | 0·00019 | 0 | 0 | 0 | 0·00002 | Smp_168390 tnf receptor-associated factor, putative |
| CATGAAGTTGAATCTTTTGTT | 7·01 | 0·00034 | 0·00003 | 0·0001 | 0·00029 | 0·00004 | Smp_030250 NF-YA subunit |
| (b) highest expression in 6-day sporocysts | |||||||
| CATGAACTAATCCCAATATAT | 34·51 | 0·00012 | 0·00147 | 0·00163 | 0·00023 | 0·00046 | Smp_153370 expressed protein |
| CATGCTGTATATGTATGCGTT | 22·26 | 0·00006 | 0·00068 | 0·0007 | 0·0001 | 0 | Smp_017430 Sh23, putative |
| CATGATTGCATAAATAAACTA | 12·87 | 0·00107 | 0·00226 | 0·00286 | 0·00212 | 0·00178 | Smp_031310 40S ribosomal protein S26, putative |
| CATGTGAATAAGTAGAAATAA | 12·77 | 0·00161 | 0·00339 | 0·00347 | 0·00303 | 0·00289 | Smp_017280 ubiquitin, putative |
| CATGCTAAATACAACTGCAAT | 12·54 | 0·0015 | 0·00351 | 0·00269 | 0·00235 | 0·00241 | Smp_105320 ribosomal protein smL37a, putative |
| CATGTATCATTATGATATGTT | 11·55 | 0·00001 | 0·00062 | 0·00045 | 0·00029 | 0·00028 | Smp_169090 conserved hypothetical protein |
| CATGCTGCAGTAATCGCACAT | 11·11 | 0·00146 | 0·00312 | 0·00263 | 0·00212 | 0·00178 | Smp_142180 poly(ADP-ribose) glycohydrolase, putative |
| CATGATTGTGATTTCCTACAA | 10·83 | 0·00131 | 0·00285 | 0·00269 | 0·00235 | 0·00186 | Smp_047200·3 60S ribosomal protein L3, putative |
| CATGTAAAGTGACTGGAAAAT | 7·92 | 0·00123 | 0·00256 | 0·00224 | 0·00186 | 0·00177 | Smp_013470 ribosomal protein S2, putative |
| CATGTATAAACCAGATGGAAC | 7·57 | 0·00047 | 0·0011 | 0·00101 | 0·00059 | 0·0004 | Smp_002180 transcription factor btf3, putative |
| CATGGACAAGTACCATCCAGG | 7·48 | 0·00095 | 0·00198 | 0·00199 | 0·00179 | 0·00141 | Smp_132300 kif-3, putative |
| CATGTAATGAGAAAAGTGATT | 7·35 | 0 | 0·00028 | 0·00033 | 0·00016 | 0·00019 | Smp_124750 expressed protein |
| (c) highest expression in 20-day sporocysts | |||||||
| CATGAAAATGTTAGATGTTGC | 21·93 | 0·00025 | 0·00125 | 0·00138 | 0·00189 | 0·00177 | Smp_113760 anti-inflammatory protein 16, putative |
| CATGATGCATCAAATTAGAGA | 19·45 | 0·00298 | 0·00228 | 0·00269 | 0·00355 | 0·00534 | Smp_032560.2 expressed protein |
| CATGGACCCAAAGTGTTTGGA | 18·44 | 0·00117 | 0·00241 | 0·00268 | 0·00326 | 0·00346 | Smp_102070 Glutathione S-transferase 26 kDa (GST 26), putative |
| CATGTTACCACCAAACTTTTG | 10·61 | 0·00202 | 0·00306 | 0·00264 | 0·00433 | 0·00357 | Smp_146190 40S ribosomal protein S21e, putative |
| CATGCCATCCGTCAGCATAGA | 10·41 | 0·00299 | 0·00219 | 0·00176 | 0·00391 | 0·00304 | Smp_022640 60S ribosomal protein L13 (BBC1 protein homolog), putative |
| CATGCCATCAGCCTGTGCTGT | 9·78 | 0·00361 | 0·00391 | 0·00407 | 0·00603 | 0·00547 | Smp_029820 60S acidic ribosomal protein P2, putative |
| CATGTATCGTTCTATATTAAT | 9·53 | 0·00015 | 0·00069 | 0·00068 | 0·00088 | 0·00085 | Smp_095360 fatty acid binding protein, putative |
| CATGCTTATATGCCTATAGTG | 9·09 | 0·00101 | 0·00188 | 0·00151 | 0·00257 | 0·00211 | Smp_095540 cytochrome C oxidase, subunit II, putative |
| CATGAAGCCTGTCGCACAATC | 8·32 | 0·00111 | 0·00169 | 0·00188 | 0·00257 | 0·00234 | Smp_084460 60S ribosomal protein L28, putative |
| CATGTTATTTTAGGTAGGTTT | 7·55 | 0·00086 | 0·00054 | 0·00066 | 0·00121 | 0·00148 | Smp_181810 cytochrome c oxidase subunit 3, putative |
| CATGAGTAATATGATACGCTA | 7·35 | 0·00101 | 0·00118 | 0·00133 | 0·00212 | 0·00203 | Smp_032950 Calmodulin (CaM), putative |
| CATGCACAGACAGCTGTAGTT | 7·29 | 0·00262 | 0·00253 | 0·00271 | 0·00443 | 0·00353 | Smp_041650 40S ribosomal protein S27, putative |
| (d) lowest expression in miracidia | |||||||
| CATGGGATTCGGTTTATTTGA | 12·15 | 0·00349 | 0·00526 | 0·00548 | 0·00678 | 0·00497 | Smp_009690·1 60S acidic ribosomal protein P0, putative |
| CATGAACCATCCAGGTGAGAT | 9·97 | 0·00226 | 0·00403 | 0·00283 | 0·00394 | 0·00264 | Smp_099870·1 elongation factor 1-alpha (ef-1-alpha), putative |
| CATGCTTATTCTGTTGTCTTC | 8·89 | 0·00164 | 0·00306 | 0·00278 | 0·00244 | 0·00319 | Smp_179420 expressed protein |
| CATGTTTTTGTTGTGAAAAAA | 8·66 | 0·0001 | 0·00028 | 0·0006 | 0·00062 | 0·00013 | Smp_102020 expressed protein |
| CATGATCCCGAATTGTATGTC | 8·02 | 0·00015 | 0·00076 | 0·00058 | 0·00068 | 0·0007 | Smp_030370 calreticulin autoantigen homolog precursor, putative |
| CATGAACAACCTGATTCAATT | 7·96 | 0·00003 | 0·00035 | 0·00032 | 0·00016 | 0·00051 | Smp_064300 expressed protein |
| CATGTTCGGAAGATTCGTTCT | 7·56 | 0·0012 | 0·00253 | 0·00204 | 0·00218 | 0·00199 | Smp_038510 60S ribosomal protein L6, putative |
Differential expression of genes between conditioned and unconditioned sporocysts
Using Fisher’s Exact test (Fisher, 1922) with a cutoff of P<0·01, we identified 53 tags that were differentially expressed between 6-day unconditioned and 6-day conditioned sporocysts, 22 of which were sense tags (Table 3). Forty-five tags were differentially expressed (P<0·01) between 20-day unconditioned and 20-day conditioned sporocysts, 19 of which were sense tags (Table 3). Fifteen of these differentially expressed genes were in higher abundance in unconditioned media than in conditioned media. Transcripts differentially expressed due to the effects of conditioning include HSP90, thioredoxin reductase, elongation factor 1-alpha, multiple ribosomal proteins, and proteins of unknown function. Seven tags were found to be differentially expressed in both 6-day and 20-day datasets.
Table 3.
Differential expression of transcripts due to the effects of conditioning with Bge excretory-secretory products, examined using Fisher’s Exact test (P<0·01)
| SAGE Tag sequence | 6-day unconditioned sporocysts |
6-day conditioned sporocysts |
20-day unconditioned sporocysts |
20-day conditioned sporocysts |
Description |
|---|---|---|---|---|---|
| (a) higher abundance in 6-day unconditioned compared to 6-day conditioned sporocysts | |||||
| CATGAACCATCCAGGTGAGAT | 0·403 | 0·283 | 0·394 | 0·264 | Smp_099870.1 elongation factor 1-alpha (ef-1-alpha), putative |
| CATGTTGAACGTGAAAATACT | 0·035 | 0·012 | 0·023 | 0·034 | Smp_154530 mitochondrial ATP synthase B chain, putative |
| CATGTCATCGTTCCCTTGCAC | 0·201 | 0·116 | 0·15 | 0·156 | Smp_174950 40S ribosomal protein S19, putative |
| CATGCTTAATAACAGCAGCAA | 0·051 | 0·02 | 0·036 | 0·03 | Smp_064830 survival motor neuron protein, putative |
| CATGAACCATCCCGGTGAGAT | 0·209 | 0·136 | 0·156 | 0·116 | Smp_189530 elongation factor 1-alpha (ef-1-alpha), putative |
| CATGTCAATTGTGCGAAAATG | 0·015 | 0 | 0·007 | 0·002 | Smp_154230.2 expressed protein |
| CATGAGTTTTATCGAAATGAT | 0·012 | 0 | 0 | 0·002 | Smp_084540.1 expressed protein |
| (b) higher abundance in 6-day conditioned compared to 6-day unconditioned sporocysts | |||||
| CATGGAAGAAGTGGATTAGCT | 0·197 | 0·273 | 0·261 | 0·177 | Smp_072330·2 heat shock protein, putative (HSP90) |
| CATGTATAAAAGCATCCTTTT | 0·037 | 0·071 | 0·059 | 0·072 | Smp_007260 ATPase, putative |
| CATGGTGATTATTTTTTTGTT | 0·076 | 0·13 | 0·055 | 0·082 | Smp_048660 nucleolar protein nop56, putative |
| CATGTGTTATTGTGAGTAAAA | 0·034 | 0·08 | 0·055 | 0·046 | Smp_051210.1 importin alpha 3,4, putative |
| CATGTAATTTATTTTATATTA | 0·01 | 0·038 | 0·026 | 0·017 | Smp_073590 GTP-binding protein-like protein |
| CATGGAAAATATATGTATTTG | 0·097 | 0·15 | 0·108 | 0·101 | Smp_164650 lupus la ribonucleoprotein, putative |
| CATGAATATACATATATATAT | 0·001 | 0·018 | 0·013 | 0·011 | Smp_002080 s-adenosylmethionine synthetase, putative |
| CATGTAATAAAGAGTAATTTT | 0·003 | 0·03 | 0·013 | 0·011 | Smp_052710 expressed protein |
| CATGTGAGAAAGATACACTTT | 0·022 | 0·053 | 0·026 | 0·053 | Smp_027080 golgi membrane protein sb140 (yip1b), putative |
| CATGAATAAAATATTTGTCTT | 0·044 | 0·083 | 0·072 | 0·089 | Smp_086480 Antigen Sm21.7, putative |
| CATGTTATGTATTGTTATTTT | 0 | 0·013 | 0·01 | 0·006 | Smp_153500 tyrosine protein kinase, putative |
| CATGCTCACAATTTTTTTTGT | 0 | 0·013 | 0·003 | 0·006 | Smp_016600 solute carrier family 1 (glial high affinity glutamate transporter, putative |
| CATGAACCCCTTATGTATTTT | 0·009 | 0·03 | 0·007 | 0·011 | Smp_022090 ribose-phosphate pyrophosphokinase 1, putative |
| CATGGCTGGGGAATATAAATA | 0·019 | 0·071 | 0·049 | 0·023 | Smp_135690 hypothetical protein |
| CATGTTTTTGTTGTGAAAAAA | 0·028 | 0·06 | 0·062 | 0·013 | Smp_102020 expressed protein |
| (c) higher abundance in 20-day unconditioned compared to 20-day conditioned sporocysts | |||||
| CATGGGATTCGGTTTATTTGA | 0·526 | 0·548 | 0·678 | 0·497 | Smp_009690.1 60S acidic ribosomal protein P0, putative |
| CATGAACCATCCAGGTGAGAT | 0·403 | 0·283 | 0·394 | 0·264 | Smp_099870.1 elongation factor 1-alpha (ef-1-alpha), putative |
| CATGTAATAAACACTTCAGCG | 0·09 | 0·081 | 0·104 | 0·049 | Smp_044280 fibrillarin, putative |
| CATGAAGTTGAATCTTTTGTT | 0·003 | 0·01 | 0·029 | 0·004 | Smp_030250 NF-YA subunit |
| CATGTGGTTGAATAAATTTGC | 0·22 | 0·203 | 0·257 | 0·163 | Smp_096750 expressed protein |
| CATGGCTCTCCTTTACTCGAT | 0·053 | 0·057 | 0·059 | 0·015 | Smp_017280 ubiquitin, putative |
| CATGAAGTTACTTCACAAAAT | 0·032 | 0·02 | 0·075 | 0·028 | Smp_048430.1 thioredoxin reductase, putative |
| CATGACATCCAAGCGGTGTTT | 0·003 | 0·01 | 0·023 | 0·002 | Smp_105210 zinc finger protein, putative |
| CATGAGCGAGAGGAACGCGAA | 0·059 | 0·042 | 0·062 | 0·021 | Smp_103320 nuclear movement protein nudc, putative |
| CATGGGGAAAAGTATAAATAA | 0·007 | 0·007 | 0·016 | 0 | Smp_130540 alanine aminotransferase, putative |
| CATGAAGAGAGCATTAATATT | 0·004 | 0·007 | 0·016 | 0 | Smp_074370 expressed protein |
| CATGTAACATAATATACTTTG | 0·003 | 0·01 | 0·026 | 0·004 | Smp_040450 expressed protein |
| CATGCAGCTTGTGTGAATATG | 0·016 | 0·012 | 0·026 | 0·002 | Smp_132640 phosphatidylinositol synthase, putative |
| CATGAACAAGTATGATCCCAT | 0·012 | 0·012 | 0·023 | 0·002 | Smp_024390 microsomal signal peptidase 25 kD subunit, putative |
| CATGTTTTTGTTGTGAAAAAA | 0·028 | 0·06 | 0·062 | 0·013 | Smp_102020 expressed protein |
| CATGTTGATACTAGAGTTTCT | 0·003 | 0 | 0·02 | 0 | Smp_140760 expressed protein |
| (d) higher abundance in 20-day conditioned compared to 20-day unconditioned sporocysts | |||||
| CATGCCAAGTTTACAGTTAAA | 0·069 | 0·078 | 0·075 | 0·156 | Smp_105970 expressed protein |
| CATGACTATTCGGGTGGGTAC | 0·001 | 0·002 | 0 | 0·025 | Smp_131110 expressed protein |
| CATGATGCATCAAATTAGAGA | 0·228 | 0·269 | 0·355 | 0·534 | Smp_032560.2 expressed protein |
Quantitative PCR
Since SAGE is quantitative in nature, we selected 3 genes exhibiting of high, medium and low expression levels in the miracidial stage and used real-time qPCR to independently examine their transcript levels within a miracidial cDNA pool. Those genes with the highest tag number (Smp_071390, Smp_ 009760 and Smp_067800) correlated significantly in abundance within the larval cDNA pool by qPCR (Fig. 3). Similar correlations of tag number and transcript abundance by qPCR can be observed for genes with medium and low tag numbers (Fig. 3). These results indicate that tag numbers are predictive of relative levels of the transcript abundance.
Fig. 3.

(A) Quantitative PCR examination of high, medium and low expressed transcripts. (A) Theoretical transcript numbers are compared to actual transcript numbers for nine transcripts: Smp_134670.2 (expressed protein of unknown function), Smp_161730 (RNA binding protein), Smp_043220 (expressed protein of unknown function), Smp_002880.1 (ATP synthase alpha), Smp_064950 (calcineurin B), Smp_137710 (putative drug transporter), Smp_071380 (adenylate kinase) and Smp_067800 (fibrillin 2). (B) The correlation between actual transcript levels and theoretical transcript levels.
DISCUSSION
SAGE allows for the dissection of complex processes involving the interaction of multiple genes or gene families, such as stage-specific differentiation or response to external stimuli, on a transcriptome-wide level. The quantitative nature of SAGE also enables one to analyse thousands of transcripts from a given sample simultaneously, allowing for greater coverage of expressed mRNAs and the detection of low abundance transcripts that may be missed using methodologies like DNA microarrays (Velculescu et al. 1995). SAGE has been employed in numerous areas of biological, medical, and pharmaceutical research and has proved to be an excellent tool for comparing gene expression profiles between normal and abnormal cells occurring in a diseased state (e.g., tumors; St-Croix et al. 2000), differentially-treated, experimental cell populations (de Waard et al. 1999) or whole organisms sampled over a period of development (e.g., Drosophila : Lee et al. 2005 or parasites: Palm et al. 2005; Skuce et al. 2005; Kronstad, 2006).
Previously, only 2 studies have undertaken large-scale gene expression studies focusing on intramolluscan larval schistosomes. Vermeire et al. (2006) investigated miracidia and 4-day in vitro cultured sporocysts using a 7335 feature oligonucleotide microarray and Jolly et al. (2007) identified gene transcript changes between cercariae, daughter sporocysts recovered from infected snails, and adult worms utilizing an 11 998 feature array. We identified a large number of stage-associated transcripts that correlated with the Vermeire et al. study (2006), despite differences in culture conditions and sporocyst age. For example, both studies found SME16, p40 egg antigen, myosin light chain, phosphoenol-pyruvate carboxykinase (PEPCK), and secretory glycoprotein kappa-5 to be stage-associated with miracidia. Similarly, calreticulin, polo-like kinase (smPLK), 14-kDa fatty acid binding protein (Sm14; M60895) and a protein similar to insulin induced gene-1 were significantly associated with the sporocyst stage in both studies, demonstrating that similar results may be obtained using both SAGE and microarray methodologies in these stages. Differential gene expression for these transcripts was confirmed by real-time quantitative PCR (Vermeire et al. 2006) and further serves to validate SAGE as a quantitative transcriptomic method when applied to schistosomes. Williams et al. (2007) also demonstrated, using semi-quantitative reverse transcription PCR (RT-PCR) that overall expression levels and changes in expression levels correlate well between SAGE and RT-PCR in stage-specific comparisons.
Based on GO assignments, various functional groups were identified by SAGE as being over-represented in differentially expressed genes, uniquely expressed genes and/or genes having very high expression levels (SAGE tag frequencies). These functional groups are discussed below.
Heat-shock proteins (HSP)/chaperonins
HSPs play important roles in folding, secretion, regulation, assembly, translocation and degradation of other proteins and as such are critical to numerous biochemical and molecular cell processes (Brown et al. 2007). The expression levels of HSP86/90, HSP40/DnaJ, HSP70/BiP, USP (universal stress protein-like) and p40 egg antigen (HSP27) were significantly higher in miracidia than 6- or 20-day sporocysts. HSP90 is an ATP-dependent chaperone involved in the activation and trafficking of proteins (Young et al. 2004). The p40 egg antigen contains 2 alpha-crystallin domains and exhibits high homology to small heat shock proteins from Drosophila (HSP27; Nene et al. 1986). The biological significance of S. mansoni miracidia secreting such high levels of a small heat shock protein homologue remains unclear. However, the secretion of HSPs by parasitic helminths is emerging as a common theme (Nene et al. 1986; Cai et al. 1996; Knudsen et al. 2005; Craig et al. 2006; Cass et al. 2007). Knudsen et al. (2005) identified HSP86/90, HSP70 and HSP60 in cercarial secretions, while p40 and other HSP/chaperone family members are secreted by schistosome eggs (Cai et al. 1996; Cass et al. 2007) or found in the empty eggshells of newly hatched S. japonicum miracidia (Liu et al. 2006). In a recently completed proteomic study, excretory-secretory proteins (ESP) released by in vitro-cultured S. mansoni miracidia, HSP/chaperonins were identified as a major constituent (Guillou et al. 2007; Wu et al. 2008). In the mammalian host, schistosome-secreted HSPs, like p40, serve as powerful immunogens eliciting production of pro-inflammatory cytokines resulting in extensive tissue fibrosis (Cai et al. 1996). Recently, it has been proposed that HSPs represent important ‘danger signals ’ that, upon binding to macrophages/monocytes receptors (e.g., toll-like or scavenger receptors), stimulate release of pro-inflammatory cytokines or chemokines (Binder et al. 2004). Because induction of inflammatory fibrosis and granuloma formation around eggs is required for their efficient excretion from the host, the schistosome parasite appears to manipulate the host immune response to their advantage, by increased expression ofHSPs and other immunogens (Binder et al. 2004).
The transition from free-living miracidium to parasitic sporocyst is accompanied bymorphogenetic and physiological changes (Voge and Seidel, 1972). Upregulation of HSPs may very well represent a stress response to these changes. During larval transformation the shedding, and subsequent degeneration, of ciliary epidermal plates during formation of the sporocyst tegument appears to represent a major source of excreted larval proteins and thus likely represents the source of the abundant HSPs found in larval ESP (Guillou et al. 2007; Wu et al. 2008). Yet to be answered, however, is the question of whether or not HSPs released by the parasite serve to alert or suppress the snail host’s immune system.
Calcium-interactive proteins
The divalent cation Ca++ is used as a cellular signal or ionic cofactor involved in diverse metabolic processes, including secretion, metabolism, muscle movement and neuronal function (Bhattacharya et al. 2006). Likewise, molecular interactions with calcium appear to play important roles in several physiological processes that govern miracidial infection of the snail host, especially its initial development to the parasitic sporocyst stage. Host entry, miracidium-sporocyst transformation, muscle movement and larval motility, and enzyme regulation all appear to be calcium-dependent processes (Sponholtz and Short, 1976; Knabe et al. 1982; Noel et al. 2001). For example, calcium chelators and pharmacological calmodulin antagonists have been shown to inhibit schistosome egg hatching and/or miracidial transformation (Katsumata et al. 1988, 1989; Kawamoto et al. 1989). Other studies have shown that calcium mobilization plays a role in cercarial penetration processes, possibly by Ca-regulation of protease activities during infection (Lewert et al. 1966; Fusco et al. 1991) or within penetration glands (Dresden and Edlin, 1975). The finding that excystment of Paragonimus ohirai metacercariae is a Ca++-dependent process (Ikeda, 2004) indicates that the role of calcium as a regulator of larval development may be functionally conserved across trematode species. In the present study, 5 calcium-signalling or binding molecules were found to have stage-associated expression. Calcineurin B andSME16 were found to be highly expressed in miracidia, while calreticulin and calmodulin weremainly associated with 6-day and/or 20-day-old sporocysts. These results are consistent with the findings of recent gene expression analyses of calponin, SME16, calreticulin and calpain inmiracidia of S. japonicum (Liu et al. 2006) and SME16 and calreticulin in S. mansoni miracidia (Vermeire et al. 2006; Guillou et al. 2007). Calreticulin, a versatile protein typically associated with chaperone activity, also functions as a storage form for calcium and a signalling molecule involved in regulating calcium homeostasis (Gelebart et al. 2005). Recently, it was shown that a calreticulin-like protein from endoparasitoid wasp venom fluid inhibits haemocyte spreading behaviour and thus prevents encapsulation within its lepidopteran host (Zhang et al. 2006). In this light, the finding of a calreticulin in ESP of S. mansoni primary sporocysts (Guillou et al. 2007) suggests that it may have a role as a parasite defensive mechanism against haemocyte encapsulation.
Calmodulin is a multifunctional protein involved in the regulation of a variety of cellular processes. In mammalian cells, calmodulin functions in the activation of protein kinases, smooth muscle contraction and calcium channel regulation (Bers and Guo, 2005). Most pertinent to our studies was an earlier finding that the hatching of S. mansoni eggs appears to be a Ca++/calmodulin-dependent process (Katsumata et al. 1989). The fact that some HSPs (e.g., HSP90 and HSP70) contain calmodulin-binding domains (Song et al. 2007) implies potential molecular and functional interactions between these distinct molecular groups.
Since larval hatching from eggs is greatly facilitated by active larval motility, the finding of calponin, an actin- and tropomyosin-binding protein that acts as a regulator of smooth muscle contraction and motility (Winder et al. 1998), is consistent with its predicted involvement in hatching or other functions requiring miracidial motility. Synaptotagmin, Ca++ sensors in a family of membrane-trafficking proteins involved in exocytosis and neurotransmitter release (Yoshihara and Montana, 2004), also is upregulated in miracidia compared to sporocysts. This protein may function as a signalling protein during the miracidial stage.
Two other Ca++-binding protein transcripts, SME16 and a small 8 kDa protein containing predicted EF-hand domains, also show differential expression in miracidia. Both SME16 and a protein with significant homology to the Ca-binding 8 kDa dynein light chain have been identified in ESP from S. mansoni miracidia (Wu et al. 2008). It now appears that SME16, previously shown to be a highly-expressed egg protein, originates within the fullyformed miracidium, although its function in larval development or metabolism is still unknown (Moser et al. 1992).
Egg antigens
Transcripts of several abundant proteins found in soluble egg antigen (SEA) (Cass et al. 2007) were found to be highly expressed in miracidia (Vermeire et al. 2006). These transcripts included p40 egg antigen, PEPCK, secretory glycoprotein kappa-5, SME16 and several forms of glutathione-S-transferases (GSTs). This finding suggests that these antigens arise from the miracidia within the egg, or possibly other egg tissues (e.g., von Lichtenberg’s membrane) (Neill et al. 1988), capable of synthesizing and secreting proteins from the egg. Neill et al. (1988) showed by electron microscopy that the von Lichtenburg’s membrane, a structure that forms a thin cellular envelope surrounding the developing miracidium, contains ribosomes, and it was suggested that this tissue may be the source of SEA detected by immune sera and be responsible for promoting granuloma formation around the egg. Recent proteomic analysis of S. mansoni egg excretions and their immunolocalization supports this notion (Cass et al. 2007). However, the observation that most ‘egg antigen’ mRNAs are being transcribed in high abundance within miracidia suggests that these proteins are synthesized within the miracidium itself, are then released, and finally exported by some yet unknown mechanism through the tissues surrounding the larvae and out through the cribriform pores of the parasite’s egg shell (Neill et al. 1988). El Ridi et al. (1996) demonstrated the in situ binding of mouse L-selectin to the surface of egg-encased miracidia, implying external intact protein transport across the von Lichtenberg membrane, thus providing a basis for hypothesizing that reverse transport (miracidium-to-egg-shell surface) is highly possible. Further characterization of larval S. mansoni excretory-secretory proteins will help to further our understanding of the molecules released from the ciliated larvae during egg development, hatching and penetration of the molluscan intermediate host.
Antioxidants
RNA transcripts for S. mansoni glutathione peroxidase (GPx) were found to be present at high levels in both miracidia and sporocysts, although a greater abundance was observed in miracidia mRNA populations. This observation is consistent with earlier microarray analyses in which GPx mRNA was found to be preferentially expressed in miracidia when compared to sporocysts (Vermeire et al. 2006) and in preliminary analyses of larval transcripts by SAGE (Williams et al. 2007). However, even though lower than in miracidia, GPx transcript abundance in sporocysts was still much higher (by 10-fold) than those of peroxiredoxins (Prxs), another prominent class of reactive oxygen-scavenging enzymes expressed mainly in sporocysts (Vermeire and Yoshino, 2007). S. mansoni GPx has been biochemically characterized as a primary lipid hydroperoxide reductant, but the molecule also possesses a hydrogen peroxide metabolizing activity (Mei et al. 1996). Another protein potentially involved in the S. mansoni redox pathway is translationally-controlled tumor protein (TCTP), which was the sixteenth highest expressed gene transcript from the 5 larval libraries. Studies of recombinant Brugia malayi TCTP showed that this protein possesses antioxidant activity, can be reduced by thioredoxin, and is upregulated upon host infection (Gnanasekar and Ramaswamy, 2007). In yeast, it is upregulated by treatment with H2O2 (Bonnet et al. 2000). The presence of GPx and TCTP in such high abundance in miracidia and sporocysts suggests that it may provide protection for both the developing miracidia within eggs in the definitive host as well as some measure of protection against oxidative damage in the sporocyst stage. It seems plausible that GPx and TCTP may also aid sporocysts in their defence against reactive oxygen species (ROS) naturally occurring in the haemoglobin-rich plasma environment of the snail host (Hahn et al. 2001a) or produced by snail haemocytes during an encapsulation reaction (Hahn et al. 2001b; Bender et al. 2005). Recent studies have shown that Prx expression can be induced in S. mansoni mother sporocysts upon exposure to B. glabrata embryonic cells or exogenous hydrogen peroxide in vitro (Coppin et al. 2003; Vermeire and Yoshino, 2007). Thioredoxin, another redox pathway enzyme found to be moderately expressed in all 5 of our S. mansoni libraries, had highest expression levels in 6- and 20-day sporocysts cultured in snail cell-conditioned medium. GST-26 and GST-28, also possessing anti-oxidant activities, were more highly expressed in sporocysts than in miracidia.
Effects of cultivation in Biomphalaria glabrata embryonic (Bge) cell-conditioned medium
Co-cultivation of S. mansoni primary sporocysts with the Bge cell line results in the production of embryos of secondary (=daughter) sporocysts by 15 days in culture and fully formed daughter sporocysts from 20 days and after (Yoshino and Laursen, 1995). However, due to the complexity of performing SAGE analysis on a multi-organism dataset, we utilized Bge cell-conditioned medium to investigate the influence of host molecules on sporocyst gene expression and larval development. Earlier experiments (Coppin et al. 2003; Vermeire et al. 2004) have demonstrated that factors secreted from Bge cells influence gene expression during in vitro development of S. mansoni sporocysts. For example, in sporocysts, glutaminyl t-RNA synthetase (GlnRS) transcripts were shown to be 3-fold higher and T-complex protein 1 subunit gamma (SmTCP-1) transcripts 1·3-fold higher in response to Bge cell-conditioned medium (Coppin et al. 2003). Our data indicate GlnRS transcripts are 2-fold higher in 6-day sporocysts cultured in conditioned medium and 1·3-fold higher in 20-day larvae. Vermeire et al. (2004) demonstrated that G-alpha subunit 1 (G-alpha1) and SmPLK gene expression was higher in 4-day sporocysts cultured in Bge cell-conditioned Bge medium than in unconditioned medium. In contrast, our data showed that SmTCP-1 and SmPLK were lower in conditioned 6-day sporocysts than in 6-day unconditioned sporocysts. The discrepancies between our data and those of Coppin et al. (2003) and Vermeire et al. (2004) are likely due to the differences in culture media used and/or the length of time cultured.
Overall, 22 sense tags were found to be differentially expressed between 6-day conditioned and unconditioned sporocysts, of which 14 were upregulated in 6-day conditioned sporocysts compared to 8 transcripts upregulated in unconditioned sporocysts. This compares to 19 sense tags being differentially expressed between 20-day conditioned and unconditioned sporocysts, of which 16 were more highly expressed in unconditioned versus conditioned media. The majority of upregulated genes in both 6- and 20-day sporocysts involved transcriptional and translational processes, possibly reflecting a high degree of mitotic and protein synthetic activity associated with somatic and germinal tissue growth at this stage of larval development. Thirty-two % of the sense tags differentially expressed between 6-day conditioned and unconditioned sporocysts were higher in unconditioned media whereas 84% of the sense tags differentially expressed between 20-day conditioned and unconditioned were higher in unconditioned media. Differences in the gene expression in early versus late developing larvae under different culture conditions suggest that snail cell components may be playing different roles in regulating gene expression throughout sporocyst development.
Anti-sense transcripts
Unlike traditional oligonucleotide microarrays, SAGE analysis can identify anti-sense transcripts. These transcripts have been previously identified in S. mansoni (Waisberg et al. 2007) and other parasitic organisms, including Leishmania (Dumas et al. 2006), Onchocerca volvulus (Erttmann et al. 1995), Plasmodium falciparum (Gunasekera et al. 2004) and Trypanosoma brucei (Liniger, 2001). Anti-sense SAGE tags are highly represented in these parasites, constituting 17% and 21·5% of all tags and in Plasmodium and Toxoplasma gondii, respectively (Patankar et al. 2001; Radke et al. 2005). Moreover, in P. falciparum (Gunasekera et al. 2004) and other organisms (Farrell and Lukens, 1995; Luther et al. 1998; Hastings et al. 2000) there exists a significant inverse relationship between anti-sense and sense tag frequencies that have been speculated as being a novel form of post-transcriptional gene regulation. In our study, 35% of the total mapped tags appear to be anti-sense tags and a strong inverse correlation between sense to anti-sense transcription exists. Gene loci containing higher levels of antisense tags contain lower levels of sense transcripts and vice-versa, supporting the notion that antisense transcription may be a novel form of post-transcriptional regulation. Three mechanisms of anti-sense-mediated post-transcriptional regulation have been proposed, (a) anti-sense transcripts bind to the complementary sense transcripts, targeting it for RNAi mediated decay; (b) interfering with mRNA elongation or; (c) binding to the sense transcript and interfering with translation (Gunasekera et al. 2004).
Conclusions
We have utilized LongSAGE to profile gene expression changes during early larval schistosome development, targeting the transition from free-living miracidium to the snail-parasitic mother sporocyst stage. This study represents the largest and most comprehensive transcriptomic analysis of gene expression changes during the earliest stages of intramolluscan larval S. mansoni development. We identified genes potentially involved in parasite growth and development, including many genes that are expressed in a stage-associated manner, thereby increasing our knowledge of putative regulatory networks in establishment of molluscan schistosome infections. Although the in vitro culture system employed in this study may not exactly mimic in vivo development, parasites in this in vitro system appear to develop normally (Basch and DiConza, 1974) and daughter sporocyst production is attainable (Yoshino and Laursen, 1995). Moreover, susceptible strains of B. glabrata, when injected with in vitro-cultured sporocysts, develop fully patent infections (Granath and Yoshino, 1984). Also, the miracidia recovered using our isolation procedure likely represent a heterogeneous population with regards to age or maturation synchrony, and may account for variation in individual gene expression between stages, especially those with low transcript numbers. However, because our analyses encompass large population sizes, data on differential gene expression captures a transcriptomic profile of the majority of parasites represented in those populations. In addition, we have identified 4519 SAGE tags uniquely expressed in either the miracidial or sporocyst stage corresponding to non-predicted transcripts, unknown transcripts or unsequenced regions of the genome. These transcripts may represent important developmental processes crucial to the survival of these individual stages. As the S. mansoni genome is further annotated, these results can be updated with additional SAGE tag mappings thereby identifying and further elucidating the function of these stage-specific transcripts.
Supplementary Material
Acknowledgments
This work was supported by NIH R01AI061436-03 (T.P.Y.). Schistosome-infected mice were provided from Fred Lewis (Biomedical Research Institute), through NIH supply contract AI30026. A.G.M., S.R.B., J.B., A.R.P. and M.J.C. were additionally supported by the Marine Biological Laboratory’s Program in Global Infectious Diseases, funded by the Ellison Medical Foundation. Computational resources were provided by the Josephine Bay Paul Center for Comparative Molecular Biology and Evolution (Marine Biological Laboratory) through funds provided by the W.M. Keck Foundation and the G. Unger Vetlesen Foundation.
APPENDIX A. SUPPLEMENTARY DATA
The following additional data files are available with the online version of the paper. Supplemental data file 1 contains all tags differentially-expressed (R≥4) during larval development. Supplemental data file 2 contains all tags differentially expressed (P<0·01) between 6-day conditioned and unconditioned sporocysts and supplemental data file 3 contains all tags differentially expressed (P<0·01) between 20- day conditioned and unconditioned sporocysts.
References
- Basch PF. Schistosomes-Development, Reproduction and Host Relations. Oxford University Press; New York and Oxford: 1991. [Google Scholar]
- Basch PF, DiConza JJ. The miracidium-sporocyst transition in Schistosoma mansoni, surface changes in vitro with ultrastructural correlation. Journal of Parasitology. 1974;60:935–941. [PubMed] [Google Scholar]
- Bender RC, Broderick EJ, Goodall CP, Bayne CJ. Respiratory burst of Biomphalaria glabrata hemocytes, Schistosoma mansoni-resistant snails produce more extracellular H2O2 than susceptible snails. Journal of Parasitology. 2005;91:275–279. doi: 10.1645/GE-415R. [DOI] [PubMed] [Google Scholar]
- Bers DM, Guo T. Calcium signaling in cardiac ventricular myocytes. Annals of the New York Academy of Sciences. 2005;1047:86–98. doi: 10.1196/annals.1341.008. [DOI] [PubMed] [Google Scholar]
- Bhattacharya A, Padhan N, Jain R, Bhattacharya S. Calcium-binding proteins of Entamoeba histolytica. Archives of Medical Research. 2006;37:221–225. doi: 10.1016/j.arcmed.2005.10.002. [DOI] [PubMed] [Google Scholar]
- Binder RJ, Vatner R, Srivastava P. The heat-shock protein receptors, some answers and more questions. Tissue Antigens. 2004;64:442–451. doi: 10.1111/j.1399-0039.2004.00299.x. [DOI] [PubMed] [Google Scholar]
- Bonnet C, Petter E, Dumont X, Picard A, Caput D, Lenaers G. Identification and transcription control of fission yeast genes repressed by and ammonium starvation growth arrest. Yeast. 2000;16:23–33. doi: 10.1002/(SICI)1097-0061(20000115)16:1<23::AID-YEA503>3.0.CO;2-A. [DOI] [PubMed] [Google Scholar]
- Brown MA, Zhu L, Schmidt C, Tucker PW. Hsp90-from signal transduction to cell transformation. Biochemical and Biophysical Research Communications. 2007;363:241–246. doi: 10.1016/j.bbrc.2007.08.054. [DOI] [PMC free article] [PubMed] [Google Scholar]
- Cai Y, Langley JG, Smith DI, Boros DL. A cloned major Schistosoma mansoni egg antigen with homologies to small heat shock proteins elicits Th1 responsiveness. Infection and Immunity. 1996;64:1750–1755. doi: 10.1128/iai.64.5.1750-1755.1996. [DOI] [PMC free article] [PubMed] [Google Scholar]
- Cass CL, Johnson JR, Califf LL, Xu T, Hernandez HJ, Stadecker MJ, Yates JR, 3rd, Williams DL. Proteomic analysis of Schistosoma mansoni egg secretions. Molecular and Biochemical Parasitology. 2007;155:84–93. doi: 10.1016/j.molbiopara.2007.06.002. [DOI] [PMC free article] [PubMed] [Google Scholar]
- Conesa A, Gotz S, Garcia-Gomez JM, Terol J, Talon M, Robles M. Blast2GO, a universal tool for annotation, visualization and analysis in functional genomics research. Bioinformatics. 2005;21:3674–3676. doi: 10.1093/bioinformatics/bti610. [DOI] [PubMed] [Google Scholar]
- Coppin JF, Lefebvre C, Caby S, Cocquerelle C, Vicogne J, Coustau C, Dissous C. Gene expression changes in Schistosoma mansoni sporocysts induced by Biomphalaria glabrata embryonic cells. Parasitology Research. 2003;89:113–119. doi: 10.1007/s00436-002-0643-2. [DOI] [PubMed] [Google Scholar]
- Craig H, Wastling JM, Knox DP. A preliminary proteomic survey of the in vitro excretory-secretory products of fourth-stage larval and adult Teladorsagia circumcincta. Parasitology. 2006;132:535–543. doi: 10.1017/S0031182005009510. [DOI] [PubMed] [Google Scholar]
- de Waard V, van den Berg BM, Veken J, Schultz-Heienbrok R, Pannekoek H, van Zonneveld AJ. Serial analysis of gene expression to assess the endothelial cell response to an atherogenic stimulus. Gene. 1999;226:1–8. doi: 10.1016/s0378-1119(98)00577-0. [DOI] [PubMed] [Google Scholar]
- Dresden MH, Edlin EM. Schistosoma mansoni, calcium content of cercariae and its effects on protease activity in vitro. Journal of Parasitology. 1975;61:398–402. [Google Scholar]
- Dumas C, Chow C, Muller M, Papadopoulou B. A novel class of developmentally regulated noncoding RNAs in Leishmania. Eukaryotic Cell. 2006;5:2033–2046. doi: 10.1128/EC.00147-06. [DOI] [PMC free article] [PubMed] [Google Scholar]
- El Ridi R, Velupillai P, Harn DA. Regulation of schistosome egg granuloma formation, host-soluble L-selectin enters tissue-trapped eggs and binds to carbohydrate antigens on surface membranes of miracidia. Infection and Immunity. 1996;64:4700–4705. doi: 10.1128/iai.64.11.4700-4705.1996. [DOI] [PMC free article] [PubMed] [Google Scholar]
- Emmersen J. Duplicate ditag analysis in LongSAGE. Methods in Molecular Biology. 2008a;387:143–150. doi: 10.1007/978-1-59745-454-4_11. [DOI] [PubMed] [Google Scholar]
- Emmersen J. Extraction and annotation of SAGE tags using sequence quality values. Methods in Molecular Biology. 2008b;387:123–132. doi: 10.1007/978-1-59745-454-4_9. [DOI] [PubMed] [Google Scholar]
- Erttmann KD, Buttner DW, Gallin MY. A putative protein related to human chemokines encoded antisense to the cDNA of an Onchocerca volvulus antigen. Tropical Medicine and Parasitology. 1995;46:123–130. [PubMed] [Google Scholar]
- Ewing B, Green P. Base-calling of automated sequencer traces using phred. II. Error probabilities. Genome Research. 1998;8:186–194. [PubMed] [Google Scholar]
- Ewing B, Hillier L, Wendl MC, Green P. Base-calling of automated sequencer traces using phred. I. Accuracy assessment. Genome Research. 1998;8:175–185. doi: 10.1101/gr.8.3.175. [DOI] [PubMed] [Google Scholar]
- Farrell CM, Lukens LN. Naturally occurring antisense transcripts are present in chick embryo chondrocytes simultaneously with the down-regulation of the alpha 1 (I) collagen gene. Journal of Biological Chemistry. 1995;270:3400–3408. doi: 10.1074/jbc.270.7.3400. [DOI] [PubMed] [Google Scholar]
- Fisher RA. On the interpretation of x2 from contingency tables, and the calculation of P. Journal of the Royal Statistical Society. 1922;85:87–94. [Google Scholar]
- Fitzpatrick JM, Johnston DA, Williams GW, Williams DJ, Freeman TC, Dunne DW, Hoffmann KF. An oligonucleotide microarray for transcriptome analysis of Schistosoma mansoni and its application/use to investigate gender-associated gene expression. Molecular and Biochemical Parasitology. 2005;141:1–13. doi: 10.1016/j.molbiopara.2005.01.007. [DOI] [PubMed] [Google Scholar]
- Fusco AC, Salafsky B, Vanderkooi G, Shibuya T. Schistosoma mansoni, the role of calcium in the stimulation of cercarial proteinase release. Journal of Parasitology. 1991;77:649–657. [PubMed] [Google Scholar]
- Gelebart P, Opas M, Michalak M. Calreticulin, a Ca2+-binding chaperone of the endoplasmic reticulum. International Journal of Biochemistry and Cell Biology. 2005;37:260–266. doi: 10.1016/j.biocel.2004.02.030. Transcriptome analysis of larval development by SAGE 483. [DOI] [PubMed] [Google Scholar]
- Gnanasekar M, Ramaswamy K. Translationally controlled tumor protein of Brugia malayi functions as an antioxidant protein. Parasitology Research. 2007;101:1533–1540. doi: 10.1007/s00436-007-0671-z. [DOI] [PMC free article] [PubMed] [Google Scholar]
- Granath WO, Yoshino TP. Schistosoma mansoni: passive transfer of resistance by serum in the vector snail, Biomphalaria glabrata. Experimental Parasitology. 1984;58:188–193. doi: 10.1016/0014-4894(84)90034-1. [DOI] [PubMed] [Google Scholar]
- Guillou F, Roger E, Mone Y, Rognon A, Grunau C, Theron A, Mitta G, Coustau C, Gourbal BE. Excretory-secretory proteome of larval Schistosoma mansoni and Echinostoma caproni, two parasites of Biomphalaria glabrata. Molecular and Biochemical Parasitology. 2007;155:45–56. doi: 10.1016/j.molbiopara.2007.05.009. [DOI] [PubMed] [Google Scholar]
- Gunasekera AM, Patankar S, Schug J, Eisen G, Kissinger J, Roos D, Wirth DF. Widespread distribution of antisense transcripts in the Plasmodium falciparum genome. Molecular and Biochemical Parasitology. 2004;136:35–42. doi: 10.1016/j.molbiopara.2004.02.007. [DOI] [PubMed] [Google Scholar]
- Hahn UK, Bender RC, Bayne CJ. Involvement of nitric oxide in killing of Schistosoma mansoni sporocysts by hemocytes from resistant Biomphalaria glabrata. Journal of Parasitology. 2001a;87:778–785. doi: 10.1645/0022-3395(2001)087[0778:IONOIK]2.0.CO;2. [DOI] [PubMed] [Google Scholar]
- Hahn UK, Bender RC, Bayne CJ. Killing of Schistosoma mansoni sporocysts by hemocytes from resistant Biomphalaria glabrata, role of reactive oxygen species. Journal of Parasitology. 2001b;87:292–299. doi: 10.1645/0022-3395(2001)087[0292:KOSMSB]2.0.CO;2. [DOI] [PubMed] [Google Scholar]
- Hansen EL. A cell line from embryos of Biomphalaria glabrata (Pulmonata): establishment and characteristics. In: Kurstak E, Maramorosch K, editors. Invertebrate Tissue Culture, Research Applications. Academic Press; New York, USA: 1976. pp. 75–99. [Google Scholar]
- Hastings ML, Ingle HA, Lazar MA, Munroe SH. Post-transcriptional regulation of thyroid hormone receptor expression by cis-acting sequences and a naturally occurring antisense RNA. Journal of Biological Chemistry. 2000;275:11507–11513. doi: 10.1074/jbc.275.15.11507. [DOI] [PubMed] [Google Scholar]
- Hoffmann KF, Johnston DA, Dunne DW. Identification of Schistosoma mansoni gender-associated gene transcripts by cDNA microarray profiling. Genome Biology. 2002;3:1–12. doi: 10.1186/gb-2002-3-8-research0041. [DOI] [PMC free article] [PubMed] [Google Scholar]
- Ikeda T. Effects of blockers of Ca2+channels and other ion channels on in vitro excystment of Paragonimus ohirai metacercariae induced by sodium cholate. Parasitology Research. 2004;94:329–331. doi: 10.1007/s00436-004-1218-1. [DOI] [PubMed] [Google Scholar]
- Ivanchenko MG, Lerner JP, McCormick RS, Toumadje A, Allen B, Fischer K, Hedstrom O, Helmrich A, Barnes DW, Bayne CJ. Continuous in vitro propagation and differentiation of cultures of the intramolluscan stages of the human parasite Schistosoma mansoni. Proceedings of the National Academy of Science, USA. 1999;96:4965–4970. doi: 10.1073/pnas.96.9.4965. [DOI] [PMC free article] [PubMed] [Google Scholar]
- Jolly ER, Chin CS, Miller S, Bahgat MM, Lim KC, DeRisi J, McKerrow JH. Gene expression patterns during adaptation of a helminth parasite to different environmental niches. Genome Biology. 2007;8:R65. doi: 10.1186/gb-2007-8-4-r65. [DOI] [PMC free article] [PubMed] [Google Scholar]
- Katsumata T, Kohno S, Yamaguchi K, Hara K, Aoki Y. Hatching of Schistosoma mansoni eggs is a Ca2+/calmodulin-dependent process. Parasitology Research. 1989;76:90–91. doi: 10.1007/BF00931079. [DOI] [PubMed] [Google Scholar]
- Katsumata T, Shimada M, Sato K, Aoki Y. Possible involvement of calcium ions in the hatching of Schistosoma mansoni eggs in water. Journal of Parasitology. 1988;74:1040–1041. [PubMed] [Google Scholar]
- Kawamoto F, Shozawa A, Kumada N, Kojima K. Possible roles of cAMP and Ca2+in the regulation of miracidial transformation in Schistosoma mansoni. Parasitology Research. 1989;75:368–374. doi: 10.1007/BF00931132. [DOI] [PubMed] [Google Scholar]
- Knabe E, Gilbertson DE, Plorin GG. The effect of concentrations of external sodium and calcium on the swimming speed of Schistosoma mansoni miracidia. Journal of Parasitology. 1982;68:507–508. [PubMed] [Google Scholar]
- Knudsen GM, Medzihradszky KF, Lim KC, Hansell E, McKerrow JH. Proteomic analysis of Schistosoma mansoni cercarial secretions. Molecular and Cellular Proteomics. 2005;4:1862–1875. doi: 10.1074/mcp.M500097-MCP200. [DOI] [PubMed] [Google Scholar]
- Kronstad JW. Serial analysis of gene expression in eukaryotic pathogens. Infectious Disorders – Drug Targets. 2006;6:281–297. doi: 10.2174/187152606778249890. [DOI] [PubMed] [Google Scholar]
- Lee S, Bao J, Zhou G, Shapiro J, Xu J, Shi RZ, Lu X, Clark T, Johnson D, Kim YC, Wing C, Tseng C, Sun M, Lin W, Wang J, Yang H, Wang J, Du W, Wu CI, Zhang X, Wang SM. Detecting novel low-abundance transcripts in Drosophila. RNA. 2005;11:939–946. doi: 10.1261/rna.7239605. [DOI] [PMC free article] [PubMed] [Google Scholar]
- Lewert RM, Hopkins DR, Mandlowitz S. The role of calcium and magnesium ions in invasiveness of schistosome cercariae. American Journal of Tropical Medicine and Hygiene. 1966;15:314–323. doi: 10.4269/ajtmh.1966.15.314. [DOI] [PubMed] [Google Scholar]
- Liniger M, Bodenmüller K, Pays E, Gallati S, Roditi I. Overlapping sense and antisense transcription units in Trypanosoma brucei. Molecular Microbiology. 2001;40:869–878. doi: 10.1046/j.1365-2958.2001.02426.x. [DOI] [PubMed] [Google Scholar]
- Liu F, Lu J, Hu W, Wang SY, Cui SJ, Chi M, Yan Q, Wang XR, Song HD, Xu XN, Wang JJ, Zhang XL, Zhang X, Wang ZQ, Xue CL, Brindley PJ, McManus DP, Yang PY, Feng Z, Chen Z, Han ZG. New perspectives on host-parasite interplay by comparative transcriptomic and proteomic analyses of Schistosoma japonicum. PLoS Pathogens. 2006;2:e29. doi: 10.1371/journal.ppat.0020029. [DOI] [PMC free article] [PubMed] [Google Scholar]
- Luther HP, Haase H, Hohaus A, Beckmann G, Reich J, Morano I. Characterization of naturally occurring myosin heavy chain antisense mRNA in rat heart. Journal of Cell Biochemistry. 1998;70:110–120. [PubMed] [Google Scholar]
- Mei H, Thakur A, Schwartz J, Lo Verde PT. Expression and characterization of glutathione peroxidase activity in the human blood fluke Schistosoma mansoni. Infection and Immunity. 1996;64:4299–4306. doi: 10.1128/iai.64.10.4299-4306.1996. [DOI] [PMC free article] [PubMed] [Google Scholar]
- Messerli SM, Morgan W, Birkeland SR, Bernier J, Cipriano MJ, McArthur AG, Greenberg RM. Nitric oxide-dependent changes in Schistosoma mansoni gene expression. Molecular and Biochemical Parasitology. 2006;2:367–370. doi: 10.1016/j.molbiopara.2006.08.003. [DOI] [PMC free article] [PubMed] [Google Scholar]
- Moser D, Doenhoff MJ, Klinkert MQ. A stage-specific calcium-binding protein expressed in eggs of Schistosoma mansoni. Molecular and Biochemical Parasitology. 1992;51:229–238. doi: 10.1016/0166-6851(92)90073-s. [DOI] [PubMed] [Google Scholar]
- Neill PJ, Smith JH, Doughty BL, Kemp M. The ultrastructure of the Schistosoma mansoni egg. American Journal of Tropical Medicine and Hygiene. 1988;39:52–65. doi: 10.4269/ajtmh.1988.39.52. [DOI] [PubMed] [Google Scholar]
- Nene V, Dunne DW, Johnson KS, Taylor DW, Cordingley JS. Sequence and expression of a major egg antigen from Schistosoma mansoni. Homologies to heat shock proteins and alpha-crystallins. Molecular and Biochemical Parasitology. 1986;21:179–188. doi: 10.1016/0166-6851(86)90021-6. [DOI] [PubMed] [Google Scholar]
- Noel F, Cunha VM, Silva CL, Mendonca-Silva DL. Control of calcium homeostasis in Schistosoma mansoni. Memórias do Instituto Oswaldo Cruz. 2001;96:85–88. doi: 10.1590/s0074-02762001000900012. [DOI] [PubMed] [Google Scholar]
- Ojopi EP, Oliveira PS, Nunes DN, Paquola A, DeMarco R, Gregório SP, Aires KA, Menck CF, Leite LC, Verjovski-Almeida S, Dias-Neto E. A quantitative view of the transcriptome of Schistosoma mansoni adult-worms using SAGE. BMC Genomics. 2007;8:186–191. doi: 10.1186/1471-2164-8-186. [DOI] [PMC free article] [PubMed] [Google Scholar]
- Palm D, Weiland M, McArthur AG, Winiecka-Krusnell J, Cipriano MJ, Birkeland SR, Pacocha SE, Davids B, Gillin F, Linder E, Svard S. Developmental changes in the adhesive disk during Giardia differentiation. Molecular and Biochemical Parasitology. 2005;141:199–207. doi: 10.1016/j.molbiopara.2005.03.005. [DOI] [PubMed] [Google Scholar]
- Patankar S, Munasinghe A, Shoaibi A, Cummings LM, Wirth DF. Serial analysis of gene expression in Plasmodium falciparum reveals the global expression profile of erythrocytic stages and the presence of anti-sense transcripts in the malarial parasite. Molecular Biology of the Cell. 2001;12:3114–3125. doi: 10.1091/mbc.12.10.3114. [DOI] [PMC free article] [PubMed] [Google Scholar]
- Radke JR, Behnke MS, Mackey AJ, Radke JB, Roos DS, White MW. The transcriptome of Toxoplasma gondii. BMC Genomics. 2005;3:26–34. doi: 10.1186/1741-7007-3-26. [DOI] [PMC free article] [PubMed] [Google Scholar]
- Saha S, Sparks AB, Rago C, Akmaev V, Wang CJ, Vogelstein B, Kinzler KW, Velculescu VE. Using the transcriptome to annotate the genome. Nature Biotechnology. 2002;20:508–512. doi: 10.1038/nbt0502-508. [DOI] [PubMed] [Google Scholar]
- Skuce PJ, Yaga R, Lainson FA, Knox DP. An evaluation of serial analysis of gene expression (SAGE) in the parasitic nematode, Haemonchus contortus. Parasitology. 2005;130:553–559. doi: 10.1017/s0031182004006973. [DOI] [PubMed] [Google Scholar]
- Song KJ, Song KH, Na BK, Kim JH, Kwon D, Park S, Pak JH, Im KI, Shin HJ. Molecular cloning and characterization of a cytosolic heat shock protein 70 from Naegleria fowleri. Parasitology Research. 2007;100:1083–1089. doi: 10.1007/s00436-006-0404-8. [DOI] [PubMed] [Google Scholar]
- Sponholtz GM, Short RB. Schistosoma mansoni miracidia, stimulation by calcium and magnesium. Journal of Parasitology. 1976;62:155–157. [PubMed] [Google Scholar]
- St-Croix B, Rago C, Velculescu V, Traverso G, Romans KE, Montgomery E, Lal A, Riggins GJ, Lengauer C, Vogelstein B, Kinzler KW. Genes expressed in human tumor endothelium. Science. 2000;289:1197–1202. doi: 10.1126/science.289.5482.1197. [DOI] [PubMed] [Google Scholar]
- Stekel DJ, Git Y, Falciani F. The comparison of gene expression from multiple cDNA libraries. Genome Research. 2000;10:2055–2061. doi: 10.1101/gr.gr-1325rr. [DOI] [PMC free article] [PubMed] [Google Scholar]
- Velculescu VE, Zhang L, Vogelstein B, Kinzler KW. Serial analysis of gene expression. Science. 1995;270:484–487. doi: 10.1126/science.270.5235.484. [DOI] [PubMed] [Google Scholar]
- Verjovski-Almeida S, Venancio TM, Oliveira KC, Almeida GT, Demarco R. Use of a 44 k oligoarray to explore the transcriptome of Schistosoma mansoni adult worms. Experimental Parasitology. 2007;117:236–245. doi: 10.1016/j.exppara.2007.04.005. [DOI] [PubMed] [Google Scholar]
- Vermeire JJ, Boyle JP, Yoshino TP. Differential gene expression and the effects of Biomphalaria glabrata embryonic (Bge) cell factors during larval Schistosoma mansoni development. Molecular and Biochemical Parasitology. 2004;135:153–157. doi: 10.1016/j.molbiopara.2003.12.013. [DOI] [PubMed] [Google Scholar]
- Vermeire JJ, Taft AS, Hoffmann KF, Fitzpatrick JM, Yoshino TP. Schistosoma mansoni, DNA microarray gene expression profiling during the miracidium-to-mother sporocyst transformation. Molecular and Biochemical Parasitology. 2006;147:39–47. doi: 10.1016/j.molbiopara.2006.01.006. [DOI] [PubMed] [Google Scholar]
- Vermeire JJ, Yoshino TP. Antioxidant gene expression and function in in vitro-developing Schistosoma mansoni mother sporocysts, possible role in self-protection. Parasitology. 2007;134:1369–1378. doi: 10.1017/S0031182007002697. [DOI] [PubMed] [Google Scholar]
- Voge M, Seidel JS. Transformation in vitro of miracidia of Schistosoma mansoni and S. japonicum into young sporocysts. Journal of Parasitology. 1972;58:699–704. [PubMed] [Google Scholar]
- Wahl SM, Frazier-Jessen M, Jin WW, Kopp JB, Sher A, Cheever AW. Cytokine regulation of schistosome-induced granuloma and fibrosis. Kidney International. 1997;51:1370–1375. doi: 10.1038/ki.1997.187. [DOI] [PubMed] [Google Scholar]
- Waisberg M, Lobo FP, Cerqueira GC, Passo LK, Carvalho OS, Franco GR, El-Sayed NM. Microarray analysis of gene expression induced by sexual contact in Schistosoma mansoni. BMC Genomics. 2007;8:181–195. doi: 10.1186/1471-2164-8-181. [DOI] [PMC free article] [PubMed] [Google Scholar]
- Williams DL, Sayed AA, Bernier J, Birkeland SR, Cipriano MJ, Papa AR, McArthur AG, Taft A, Vermeire JJ, Yoshino TP. Profiling Schistosoma mansoni development using serial analysis of gene expression (SAGE) Experimental Parasitology. 2007;146:246–257. doi: 10.1016/j.exppara.2007.05.001. [DOI] [PMC free article] [PubMed] [Google Scholar]
- Winder SJ, Allen BG, Clément-Chomienne O, Walsh MP. Regulation of smooth muscle actin-myosin interaction and force by calponin. Acta Physiologica Scandinavia. 1998;164:415–426. doi: 10.1111/j.1365-201x.1998.tb10697.x. [DOI] [PubMed] [Google Scholar]
- Wu XJ, Sabat G, Brown JF, Zhang M, Taft AS, Peterson NA, Harms A, Yoshino TP. Proteomic analysis of Schistosoma mansoni proteins released during in vitro miracidium-to-sporocyst transformation. Molecular and Biochemical Parasitology. 2008 doi: 10.1016/j.molbiopara.2008.11.005. (Epub ahead of print) [DOI] [PMC free article] [PubMed] [Google Scholar]
- Yoshihara M, Montana ES. The synaptotagmins: calcium sensors for vesicular trafficking. Neuroscientist. 2004;10:566–574. doi: 10.1177/1073858404268770. [DOI] [PubMed] [Google Scholar]
- Yoshino TP. Concanavalin A-induced receptor redistribution on Biomphalaria glabrata hemocytes, characterization of capping and patching responses. Journal of Invertebrate Pathology. 1981;38:102–112. doi: 10.1016/0022-2011(81)90040-9. [DOI] [PubMed] [Google Scholar]
- Yoshino TP, Laursen JR. Production of Schistosoma mansoni daughter sporocysts from mother sporocysts maintained in synxenic culture with Biomphalaria glabrata embryonic (Bge) cells. Journal of Parasitology. 1995;81:714–722. [PubMed] [Google Scholar]
- Young JC, Agash VR, Siegers K, Hartl FU. Pathways of chaperone mediated protein folding in the cytosol. Nature Reviews Molecular Cell Biology. 2004;5:781–791. doi: 10.1038/nrm1492. [DOI] [PubMed] [Google Scholar]
- Zhang G, Schmidt O, Asgari S. A calreticulin-like protein from endoparasitoid venom fluid is involved in host hemocyte inactivation. Developmental and Comparative Immunology. 2006;30:756–764. doi: 10.1016/j.dci.2005.11.001. [DOI] [PubMed] [Google Scholar]
Associated Data
This section collects any data citations, data availability statements, or supplementary materials included in this article.