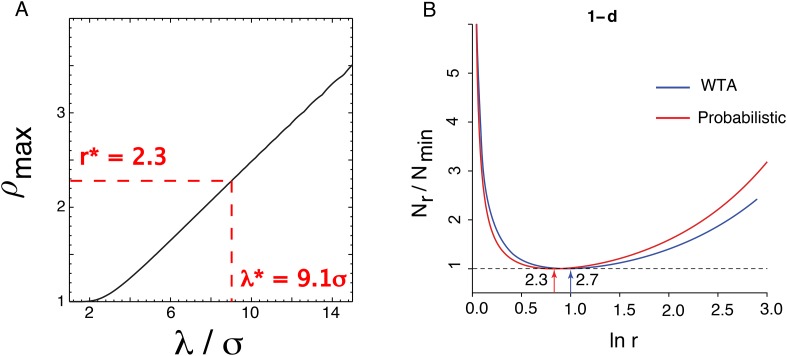
Figure 5. Optimizing the one-dimensional grid system.
(A) is the scale factor after optimizing N over σ/δ. The values r* and λ* are the values chosen by the complete optimization procedure. (B) The optimal ratio r between adjacent scales in a hierarchical grid system in one dimension for a simple winner-take-all decoding model (blue, WTA) and a probabilistic decoder (red). Here, Nr is the number of neurons required to represent space with resolution R given a scaling ratio r, and Nmin is the number of neurons required at the optimum. In both models, the ratio Nr/Nmin is independent of resolution, R. For the winner-take-all model, Nr ∝ r/lnr, while the curve for the probabilistic model is derived numerically (mathematical details in Optimizing the grid system: probabilistic decoder, ‘Materials and methods’). The winner-take-all model predicts r = e ≈ 2.7, while the probabilistic decoder predicts r ≈ 2.3. The minima of the two curves lie within each others' shallow basins.

