eLife logoLink to eLife
. 2015 Sep 29;4:e09423. doi: 10.7554/eLife.09423

Corticostriatal dynamics encode the refinement of specific behavioral variability during skill learning

Fernando J Santos 1, Rodrigo F Oliveira 1, Xin Jin 2, Rui M Costa 1,*
Editor: Ole Kiehn3
PMCID: PMC4616249  PMID: 26417950

Abstract

Learning to perform a complex motor task requires the optimization of specific behavioral features to cope with task constraints. We show that when mice learn a novel motor paradigm they differentially refine specific behavioral features. Animals trained to perform progressively faster sequences of lever presses to obtain reinforcement reduced variability in sequence frequency, but increased variability in an orthogonal feature (sequence duration). Trial-to-trial variability of the activity of motor cortex and striatal projection neurons was higher early in training and subsequently decreased with learning, without changes in average firing rate. As training progressed, variability in corticostriatal activity became progressively more correlated with behavioral variability, but specifically with variability in frequency. Corticostriatal plasticity was required for the reduction in frequency variability, but not for variability in sequence duration. These data suggest that during motor learning corticostriatal dynamics encode the refinement of specific behavioral features that change the probability of obtaining outcomes.

DOI: http://dx.doi.org/10.7554/eLife.09423.001

Research organism: mouse

eLife digest

Learning a new motor skill typically involves a degree of trial and error. Movements that achieve the desired outcome—from catching a ball to playing scales—are repeated and refined until they can be produced on demand. This process is made more difficult as the activity of individual neurons and muscle fibers can vary at random, and this reduces the ability to reproduce a given movement precisely and reliably.

It has been suggested that the motor system overcomes this problem by identifying those parts of a task that are essential for achieving the end goal, and then focusing resources on reducing the variability in the performance of those parts alone. Santos et al. now provide direct evidence in support of this proposal by recording the activity of neurons in motor regions of the mouse brain as the animals learn a lever pressing task.

By giving mice a food reward each time they pressed the lever four times in a row, Santos et al. trained the animals to press the lever in bouts. The experiment was then slightly modified, so that the mice had to perform the four lever presses more rapidly in order to earn their reward. Consistent with predictions, the average speed of lever pressing initially varied greatly, but this variability decreased as the animals learned the task. By contrast, the total duration of individual bouts of lever pressing—which depends largely on the number of times the mice press the lever—was just as variable after training as before.

A similar pattern emerged for the activity of individual motor neurons in the mouse brain. Whereas their activity initially varied greatly, this variability decreased over training. Moreover, it became increasingly linked to the variability in the speed of lever pressing, but not with the variability in the duration of individual bouts.

The work of Santos et al. has thus shown in real time how the motor system focuses its efforts on reducing variability in those specific parts of a task that are essential for achieving a goal. Without a process called corticostriatal plasticity, by which the motor system adapts, mice could not refine this variability.

DOI: http://dx.doi.org/10.7554/eLife.09423.002

Introduction

Animals have the ability to learn novel motor skills, allowing them to perform complex patterns of movement to improve the outcomes of their actions. Acquiring novel skills usually requires exploration of the behavioral space, which is critical for learning (Skinner, 1981; Sutton and Barto, 1998; Grunow and Neuringer, 2002; Kao et al., 2005; Olveczky et al., 2005; Tumer and Brainard, 2007; Miller et al., 2010; Wu et al., 2014). It also requires the selection of the appropriate behavioral features that lead to the desired outcomes (Skinner, 1981). It has been postulated that the motor system can learn complex movements by optimizing motor variability in task-relevant dimensions, correcting only deviations that interfere with the final output of the action (Todorov and Jordan, 2002; Scott, 2004; Valero-Cuevas et al., 2009; Diedrichsen et al., 2010). By optimizing the precision of an action endpoint, for example, humans can perform smooth movements even in the presence of noise (Harris and Wolpert, 1998). Selecting task-relevant features and decreasing task-relevant variability might therefore be a critical component of motor learning (Franklin and Wolpert, 2008; Cohen and Sternad, 2009; Valero-Cuevas et al., 2009; Costa, 2011; Shmuelof et al., 2012).

The reduction of motor variability specifically in relevant domains suggests that the neural activity giving rise to the task-relevant output is selected during learning. However, it is still unclear how the differential refinement of behavioral variability is encoded at the neural level. It has been suggested that cortical and basal ganglia circuits are important for the selection of task-relevant features (Costa et al., 2004; Barnes et al., 2005; Kao et al., 2005; Olveczky et al., 2005; Jin and Costa, 2010; Woolley et al., 2014). Consistently, it has been previously shown that the initial stages of learning have increased behavioral (Tumer and Brainard, 2007; Jin and Costa, 2010; Miller et al., 2010) and neuronal (Costa et al., 2004; Barnes et al., 2005) variability, but as specific movements are consolidated, neural variability is reduced in these circuits (Costa et al., 2004; Kao et al., 2005). This suggests that after initial motor and neural exploration, specific patterns are selected and consolidated (Costa, 2011). In this study, we investigated if the dynamics of neural activity in cortical and striatal circuits reflect the changes of variability in specific behavioral domains, and if corticostriatal plasticity is critical for the refinement of particular behavior features.

Results

Behavior variability is selectively reduced during motor learning

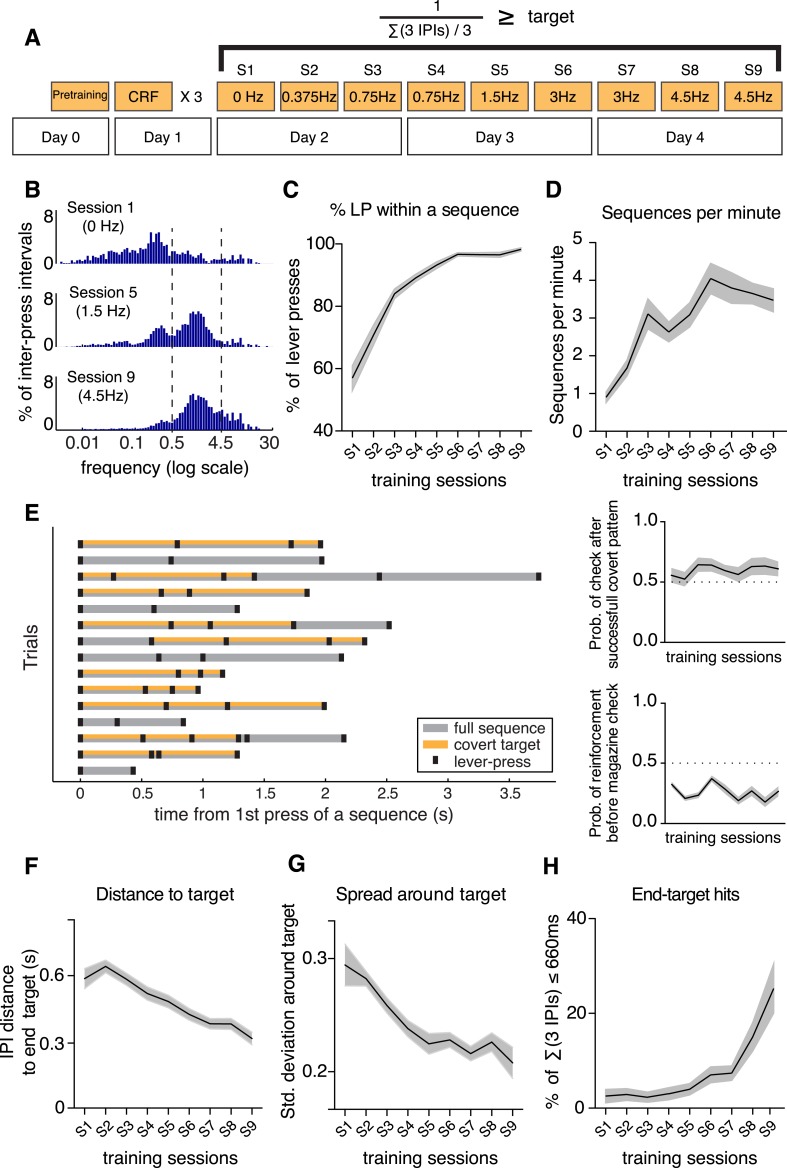
We trained mice to perform a fast lever-pressing task where they were required to press a lever at increasingly higher frequencies, in order to obtain a 20 mg food pellet. After introducing the animals (N = 20) to the behavioral apparatus and 1 day of continuous reinforcement, where each lever-press was reinforced, animals were trained intensively with three daily sessions for 3 days to perform fast lever presses. In the fast press schedules we introduced a covert minimum frequency target, defined by the inverse of three consecutive inter-press intervals (3 IPIs, 4 presses), which increased across sessions from 0 Hz to a maximum of 4.5 Hz (Figure 1A; see ‘Materials and methods’). The total number of lever presses per minute increased throughout training (F8,152 = 41.34, p < 0.0001; Figure 1—figure supplement 1A) and animals rapidly started to organize their behavior in self-paced bouts or sequences of lever presses, until there were almost no single presses (Figure 1C,E and Video 1).

Video 1. Animal performing sequences of lever-presses, doing magazine checks and obtaining reinforcement during the last training session.

Download video file (12.5MB, mp4)
DOI: 10.7554/eLife.09423.005

A 20 mg food pellet was delivered in the magazine when the animal performed three consecutive presses within 660 ms (covert target = 4.5 Hz).

DOI: http://dx.doi.org/10.7554/eLife.09423.005

Figure 1. Mice learn a fast lever-pressing task, shaping their behavior to gradually approach the minimum frequency target.

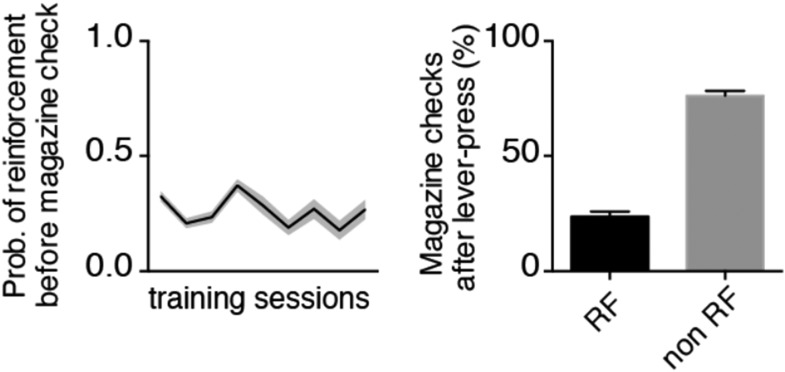
(A) Schematic of the training protocol, starting with magazine habituation and CRF training in the first 2 days, followed by 3 days of the fast press schedules (S1–S9) where we introduce an increasingly higher covert target, defined as the inverse of the sum of three consecutive inter-press intervals (IPIs). (B) Joint distribution of the frequency (log scale) for all individual IPIs, in the first, middle and last session of the fast press schedules, for all the 20 animals. Vertical dashed lines correspond to the IPI threshold used for sequence definition (IPI = 2 s, 0.5 Hz) and the final covert target (IPI = 3/660 ms, 4.5 Hz). (C) Percentage of lever presses comprised within sequences. (D) Number of sequences performed per minute. (E) Left: Example of sequences performed by a representative animal, aligned at the time of sequence initiation. Individual lever presses are marked as black ticks, the full sequence duration is shaded in grey and the IPIs that meet the session minimum target are shaded in orange; Top right: Probability of a magazine check immediately after a successful covert target; Bottom right: Probability of a magazine check having occurred after a reinforced lever-press vs a non-reinforced lever-press. (F) Distance of all three consecutive IPIs (summed) from the final covert target (∑(3 IPIs) <660 ms, ∼4.5 Hz). (G) Spread of the distance between all three consecutive IPIs (summed) around the final minimum frequency target. (H) Percentage of sequences containing the minimum frequency target of the last session (end-target: 3 IPIs <660 ms, ∼4.5 Hz). Shaded areas correspond to mean ± SEM.

DOI: http://dx.doi.org/10.7554/eLife.09423.003

Figure 1.

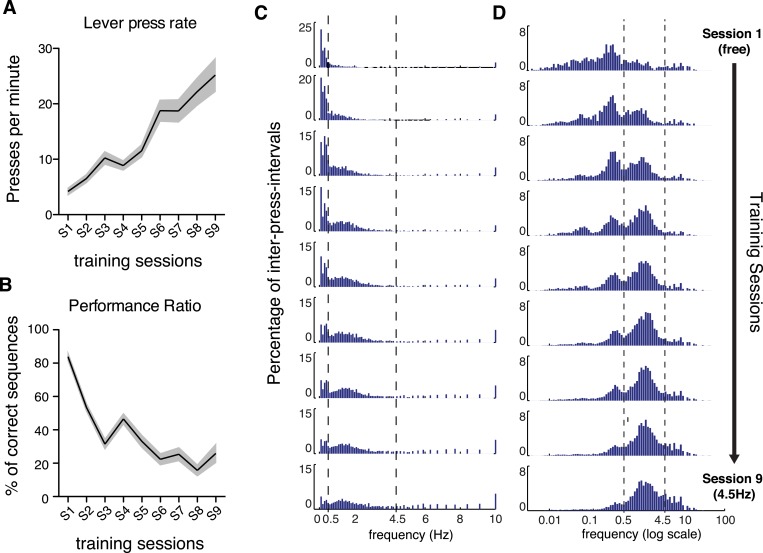
Figure 1—figure supplement 1. Lever-pressing rate increased and shifted towards higher speeds with training, and performance increased or plateaued when task difficulty did not change in consecutive sessions.

Figure 1—figure supplement 1.

(A) Lever presses per minute (F8,152 = 41.34, p < 0.0001). (B) Percentage of reinforced sequences (F8,152 = 57.31, p < 0.0001, Post hoc comparisons: Fisher's LSD test, (0.75 Hz) Session 3 vs Session 4 t152 = 3.847, p = 0.0002; (3 Hz) Session 6 vs Session 7 t152 = 0.7681, p = 0.4436; (4.5 Hz) Session 8 vs Session 9 t152 = 2.639, p = 0.0092). Shaded areas correspond to mean ± SEM. (C, D) Histograms with distribution of instantaneous lever-press frequencies, using linear (C) and log scales (D), defined as the inverse of all the individual IPIs from the 20 animals. Vertical dashed lines correspond to the IPI threshold used for sequence definition (IPI = 2 s, 0.5 Hz) and the final minimum frequency target (IPI = 220 ms, 4.5 Hz).

The distribution of the instantaneous lever press frequencies (calculated as the inverse of the each IPI) shows a clear shift from initial sessions, where animals did mostly slow frequency presses (0–0.5 Hz; but already some higher frequency presses of 0.5–4.5 Hz and >4.5 Hz), to latter sessions where the distribution was shifted towards faster pressing speeds (Figure 1—figure supplement 1C). A clear multimodal distribution became evident in log scale, with long IPIs (frequencies <0.5 Hz, Figure 1B and Figure 1—figure supplement 1D) representing pauses in pressing or magazine checks. This allowed us to identify the sequences or bouts of pressing a posteriori, based on behavioral performance (either by a pause in pressing higher than 2 s or by the occurrence of checking behavior, i.e., magazine checks between presses; see ‘Materials and methods’), independently of the requirements for a specific training session. Importantly, reinforcement delivery did not provide an external cue that could be used by the animals to anticipate a reward, as the probability of performing a magazine check immediately after a successful covert target (instead of performing another press) was not significantly different from 0.5 both on early (t19 = 0.9232, p = 0.3675) and late sessions (t19 = 1.763, p = 0.0940), and did not change throughout learning (F8,152 = 1.753, p = 0.0907, Figure 1E, top right). Because a large number of sequences did not contain covert patterns (were not reinforced) we have also calculated the probability of a magazine check having occurred after a reinforced lever-press vs a non-reinforced lever-press, and observed that this was rather low (∼0.25) and did not change from early to late sessions (Post hoc comparison: t144 = 1.184, p = 0.283, Figure 1E, bottom right).

The percentage of lever presses performed within a sequence increased significantly from 56.98 ± 3.98 in the first session of covert target introduction, to 98.26 ± 0.53 in the last training session (F8,152 = 60.22, p < 0.0001; Figure 1C), and the number of sequences performed per minute increased with training (F8,152 = 32.23, p < 0.0001; Figure 1D). The percentage of reinforced sequences tended to decrease, since the difficulty of the task increased across sessions, but tended to stabilize or increase when the same target difficulty was repeated in two consecutive sessions (F8,152 = 57.31, p < 0.0001; Figure 1—figure supplement 1B).

Importantly, with training, the distance of consecutive IPIs (summed in bins of 3 IPIs to mimic the online criteria) to the final target frequency (3 IPIs <660 ms, ∼4.5 Hz) decreased consistently (F8,152 = 25.76, p < 0.0001; Figure 1F), indicating that animals shaped their behavior gradually to approach the end target. Not only did the distance to the end target decrease, but the spread around the target also decreased (F8,152 = 9.616, p < 0.001; calculated as the standard deviation around the target frequency, Figure 1G). Consistently, animals gradually increased the percentage of press bouts that would achieve the minimum target frequency of the last session (end-target: 3 IPIs <660 ms, ∼4.5 Hz; F8,152 = 14.15, p < 0.0001; Figure 1H). These data indicate that animals learned to shape their behavior to get closer to the covert target.

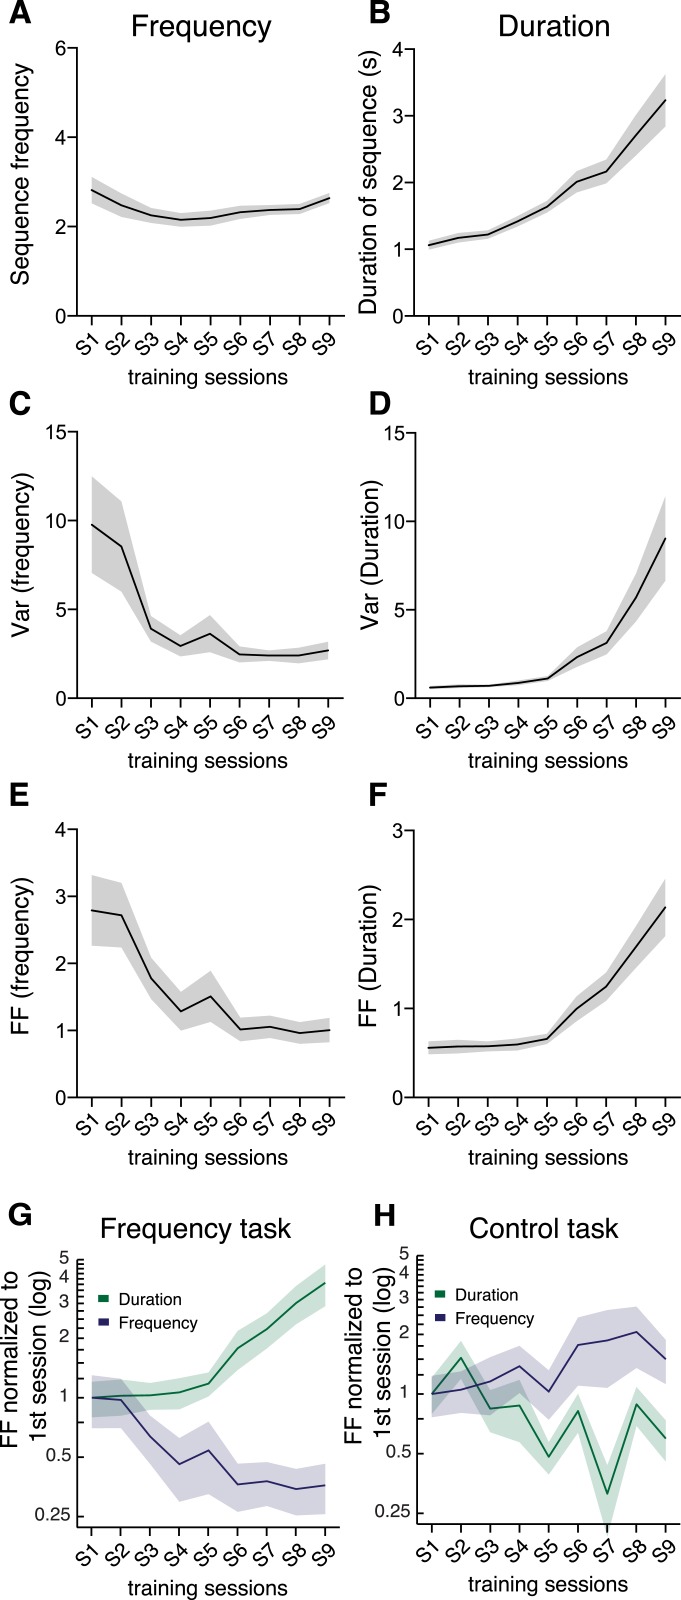
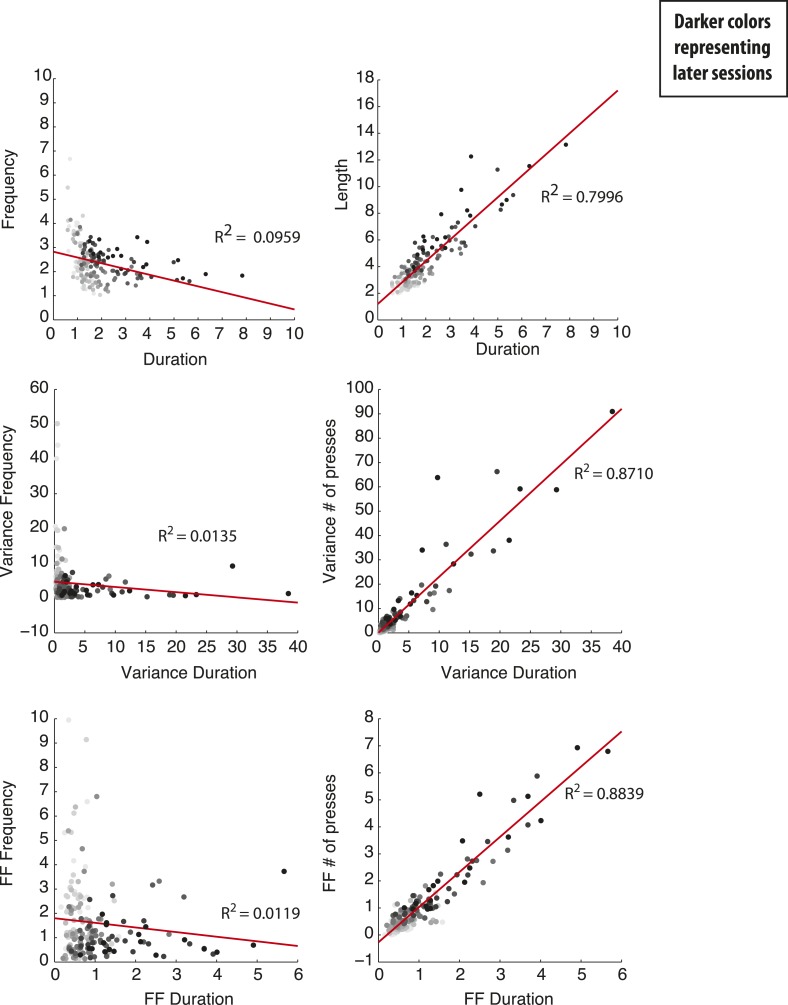
The mean frequency of each pressing bout (sequence frequency) decreased slightly (F8,152 = 2.372, p = 0.0195, Figure 2A), while the duration of each pressing bout (sequence duration) increased with training (F8,152 = 22.69, p < 0.0001, Figure 2B). Importantly, the sequence-to-sequence variability of the behavioral parameters (measured both by the variance and by the Fano factor, Figure 2C–F) was differentially modulated during training. While the variability of sequence frequency decreased significantly throughout training (variance: F8,152 = 4.450, p < 0.0001, Figure 2C; Fano factor: F8,152 = 5.343, p < 0.0001, Figure 2E), the variability of sequence duration significantly increased (variance: F8,152 = 11.15, p < 0.0001, Figure 2D; Fano factor: F8,152 = 16.86, p < 0.0001, Figure 2F). The sequence-to-sequence variability of these two behavioral features was independent as there was no correlation between the variability in sequence frequency and the variability in sequence duration (variance: R2 = 0.0135; Fano factor: R2 = 0.0119, Figure 2—figure supplement 1). This is in contrast with a strong correlation observed between variability in sequence duration and the variability in sequence length—number of presses (variance: R2 = 0.8710; Fano factor: R2 = 0.8839, Figure 2—figure supplement 1). The decrease in frequency variability cannot be explained by animals reaching a ceiling in pressing frequency, since the average frequency did not increase with training (it actually decreased slightly). Furthermore, frequency variability started stabilizing after session 4 where the target constrains are still rather loose (3 IPIs in less than 4 s) and this is a frequency that animals can reach in 78.91 ± 5.09% of the sequences at the end of training.

Figure 2. Variability of behavioral dimensions evolves independently as animals learn a motor task.

(A, B) Frequency and duration of lever-press sequences (CF) Variability, measured as the variance and Fano factor, for sequence frequency and sequence duration. (GH) Fano factor of both frequency and duration, normalized to the first session, for the frequency and control tasks. Shaded areas correspond to mean ± SEM.

DOI: http://dx.doi.org/10.7554/eLife.09423.006

Figure 2.

Figure 2—figure supplement 1. Significant correlation between variability of number of presses and duration, but not between variability of frequency and duration.

Figure 2—figure supplement 1.

Scatter plots of the paired values, variances and Fano factors, for frequency/duration and number of presses/duration. Each point corresponds to one session of one individual animal, with darker colors depicting later sessions. Line corresponds to the best linear fit of all the data, with the correspondent R2 value.

In order to test the specificity of these results, a different group of animals (N = 8) was trained on a control task (Figure 2H), where sequences of exactly four consecutive presses were reinforced but where the frequency at which these sequences were performed was not relevant. In contrast with the results observed for the frequency task, in which the sequence-to-sequence variability in frequency decreased (F8,152 = 5.343, p < 0.0001) and in duration increased (F8,152 = 16.86, p < 0.0001) (Figure 2G), in this control task the variability of sequence frequency did not decrease with training (F8,56 = 1.049, p = 0.4113), while variability in sequence duration did (F8,56 = 4.589, p = 0.0002) (Figure 2H).

These data indicate that the decrease in variability in sequence frequency was task-specific.

To further investigate this, we analyzed if the variability of these two behavioral dimensions was different in reinforced vs non-reinforced sequences (Figure 3). We verified that sequences leading to reinforcement had indeed significantly lower variability in frequency compared to non-reinforced sequences (main effect of reinforcement, F1,38 = 7.608, p = 0.0089, Figure 3C and F1,38 = 28.34, p < 0.0001, Figure 3E), but there were no significant differences in the variability of sequence duration between reinforced and non-reinforced sequences (Figure 3D,F). These results suggest that mice selectively reduced variability in the behavioral domains where variability affected the probability of reinforcement (sequence frequency), but not in domains where variability did not change this probability (sequence duration).

Figure 3. Behavior variability is differentially modulated during training.

Figure 3.

(A, B) Comparison of frequency and duration between reinforced (RF) and non-reinforced (Non-RF) sequences. (C, D) Variance and (E, F) variability, measured as the Fano factor, for reinforced and non-reinforced sequences. Black lines correspond to mean values for non-reinforced sequences. Red lines correspond to mean values for reinforced sequences. Shaded areas correspond to mean ± SEM.

DOI: http://dx.doi.org/10.7554/eLife.09423.008

Variability of motor cortex and striatal activity decreases with learning

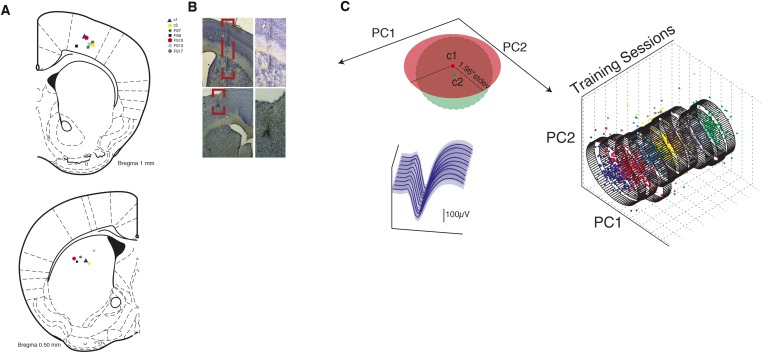
In order to investigate the dynamics of cortical and striatal circuits during the acquisition and performance of the fast lever pressing task, we continuously recorded extracellular neuronal activity simultaneously in layer 5 of the primary motor cortex (M1), and in the dorsal striatum (DS) of mice during the full duration of training (4 days, N = 7 animals, average of 18 M1 units and 10 DS units simultaneously recorded per animal, per session). Non-stop continuous electrophysiological recordings across 4 days encompassing all the sessions of training allowed us to track the activity of a subset of ‘stable’ cells throughout the whole period of training (49 M1 units, 21 DS Units). Putative single-units were isolated based on waveform characteristics, inter-spike intervals (ISI) and clustering statistics using principal component analysis (PCA). Units were considered ‘stable’ if the statistics in PCA space and waveform proprieties did not change significantly across sessions (see ‘Materials and methods’ and Figure 4—figure supplement 1C).

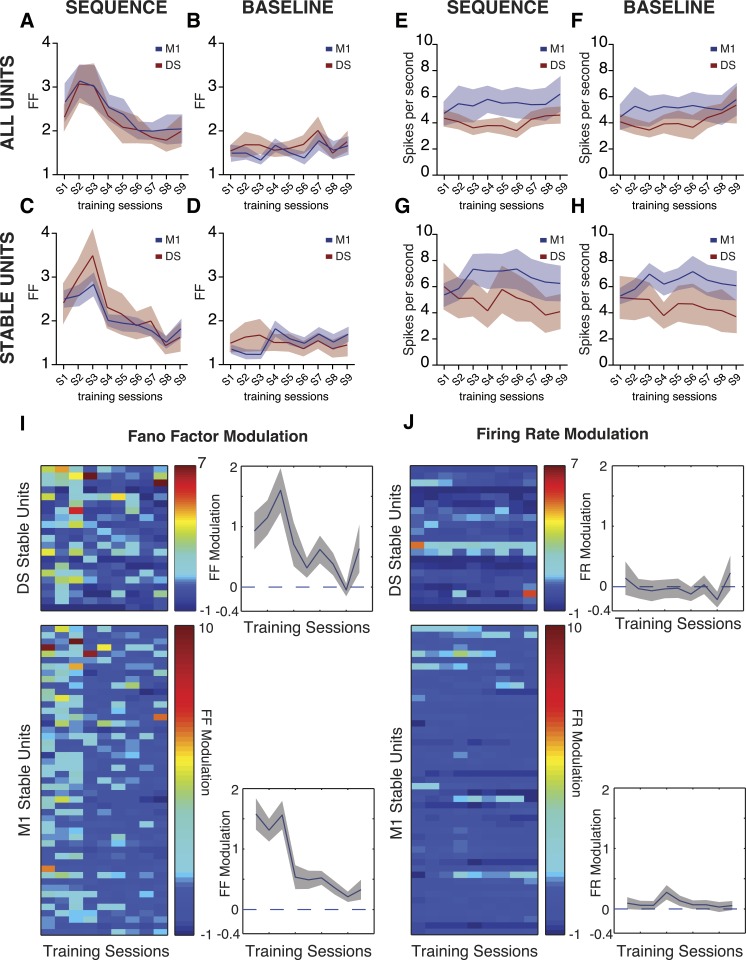
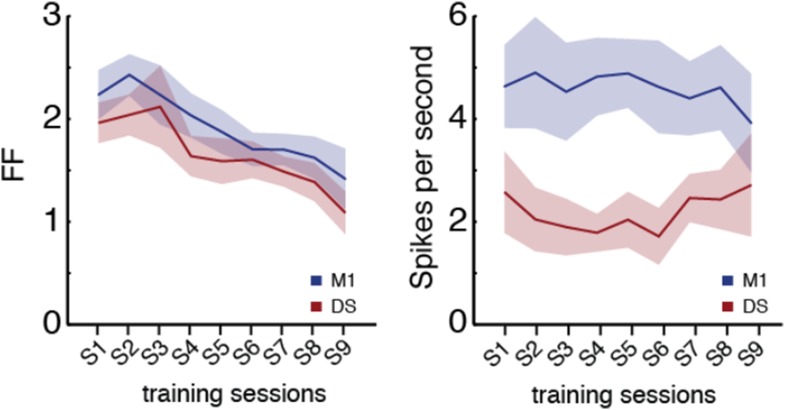
We found a high sequence-to-sequence variability in the activity of individual neurons (measured by the Fano factor of the firing rate) in the first couple of sessions, that then decreased with training (DS: F8,48 = 2.767, p < 0.05; M1: F8,48 = 2.771, p < 0.05; Figure 4A). These dynamics in neuronal variability were observed during the performance of lever-press sequences, but not during baseline periods (measured from 5 to 2 s before the initiation of each sequence), when the animals were not actively engaged in lever pressing (DS: F8,48 = 1.117, p = 0.3324; M1: F8,48 = 1.459, p = 0.1973; Figure 4B), or during periods flanking the sequence (first press: DS F8,48 = 1.213, p = 0.3121; M1 F8,48 = 0.1374, p = 0.9971; last press: DS F8,48 = 0.5227, p = 0.8335; M1 F8,48 = 0.8677, p = 0.5499; Figure 4—figure supplement 2). The decrease in neuronal variability was also observed when using exclusively ‘stable’ cells for this analysis (DS: F8,160 = 5.223, p < 0.0001; M1 F8,384 = 12.72, p < 0.0001; Figure 4C), showing that the differences in variability throughout learning could be observed in individual cells, and did not represent a shift in the population of neurons recorded across days. Importantly, the average firing rate of individual cells did not change significantly, neither across sessions nor across days (p > 0.05 for all conditions, Figure 4E–H), suggesting that the reduction in variability was not attributable to overall changes in firing rate, but instead to the selection/refinement of a particular firing patterns related to sequence execution.

Figure 4. Trial-to-trial variability in corticostriatal circuits decreases throughout training.

(AD) Neuronal variability (measured as the Fano factor of firing rates) during sequence performance and baseline periods, for all the recorded neuronal units and exclusively for ‘stable units’, for both M1 (blue traces) and dorsal striatum (DS, red traces). (EH) Firing rates during sequence performance and baseline, for all the recorded units and exclusively for stable units, for M1 (blue traces) and DS (red traces). (I, J) Fano factor (FF) and firing rate (FR) modulation relative to baseline values, for individual units recorded across the training sessions (stable units) within DS (top colorplots) and M1 (bottom colorplots). Right panels depict average modulation. Shaded areas correspond to mean ± SEM.

DOI: http://dx.doi.org/10.7554/eLife.09423.009

Figure 4.

Figure 4—figure supplement 1. Histological confirmation of electrode tip position and stable units criteria.

Figure 4—figure supplement 1.

(A) Depiction of electrode array tip localization for motor cortex (top) and DS (bottom) for each individual animal. (B) Example coronal brain slice magnification using cresyl violet staining for confirmation of electrodes position. Atlas adapted from Paxinos and Franklin (2004). (C) Illustration of an example stable cell. Diagram illustrating the criteria for stability of cells across different recording sessions (top left, c1: cluster centroid during one session, c2: centroid of the same cluster in the subsequent session, see ‘Materials and methods’). Average waveform in each session (bottom left). Cluster projection using principal component analysis (PCA) across the training sessions (right).
Figure 4—figure supplement 2. Neuronal variability around the first and last press of a sequence does not change with training.

Figure 4—figure supplement 2.

Fano factor calculated for 1 s intervals around the first (DS F8,48 = 1.213, p = 0.3121; M1 F8,48 = 0.1374, p = 0.9971) and last presses (DS F8,48 = 0.5227, p = 0.8335; M1 F8,48 = 0.8677, p = 0.5499) of a sequence. Red lines correspond to mean value for DS, blue lines correspond to mean value for M1. Shaded areas represent mean ± SEM.

Further analysis of these dynamics for individual stable cells clearly showed higher variability relative to baseline during the initial sessions (first session DS: W = 134, p = 0.0107; first session M1: W = 1119, p < 0.0001), that decreased throughout training until it reached the same levels of baseline at the end of training (last session DS: W = 73, p = 0.2157; last session M1: W = 253, p = 0.2121; Figure 4I). Again, average firing rates did not show any significant modulation in relation to baseline throughout the whole period of training (DS: F8,160 = 1.031, p = 0.4153; M1: F8,384 = 1.757, p = 0.084; Figure 4J).

This decrease in sequence-to-sequence variability of neural activity did not seem to result from the behavior becoming more stereotyped with training, as variability in behavior decreased for frequency but increased for duration (Figure 2). To further control that the decrease in neural variability was due to gross changes in behavior we restricted our analyses to sequences matched for frequency (t48 = 1.800, p = 0.0781) and duration (t48 = 1.733, p = 0.0895) between early and late sessions (Figure 5A,B). We observed that neuronal variability was still elevated in early sessions and decreased as training progressed (DS: F8,48 = 2.732, p = 0.0144; M1: F8,48 = 2.491, p = 0.0239; Figure 5C). Again, these dynamics were not observed during baseline periods (DS: F8,48 = 1.483, p = 0.1884; M1: F8,48 = 1.241, p = 0.2965; Figure 5D) and no changes in firing rates were evident in sequence (DS: F8,48 = 0.4684, p = 0.8723; M1: F8,48 = 0.4040, p = 0.9128; Figure 5E) or baseline periods (DS: F8,48 = 0.2208, p = 0.9855; M1: F8,48 = 0.3354, p = 0.9479; Figure 5F). Single unit analysis also revealed a significant decrease in Fano factor modulation throughout training (DS: F8,160 = 2.688, p = 0.0084; M1:F8,384 = 9.705, p < 0.0001; Figure 5G) with no modulation in firing rates (DS: F8,160 = 0.3008, p = 0.9648; M1:F8,384 = 1.406, p < 0.1923; Figure 5H).

Figure 5. Neuronal variability dynamics are still evident when analysis is restricted to sequences with duration and frequency.

Figure 5.

(A, B) Frequency and duration of matched sequences. (C, D) Neuronal variability, measured as the Fano factor of the firing rate, for sequences of matched duration and frequency, for both recorded areas, during sequences and baseline. (E, F) Firing rates, for sequences of matched duration and frequency, during sequences and baseline. (G, H) Fano factor (FF) and firing rate (FR) modulation relative to baseline values, for individual units recorded across the training sessions (stable units) within DS (top colorplots) and M1 (bottom colorplots), for sequences of matched duration and frequency. Right panels depict average modulation. Error bars correspond to mean ± SEM.

DOI: http://dx.doi.org/10.7554/eLife.09423.012

Corticostriatal variability becomes correlated with specific behavioral variability

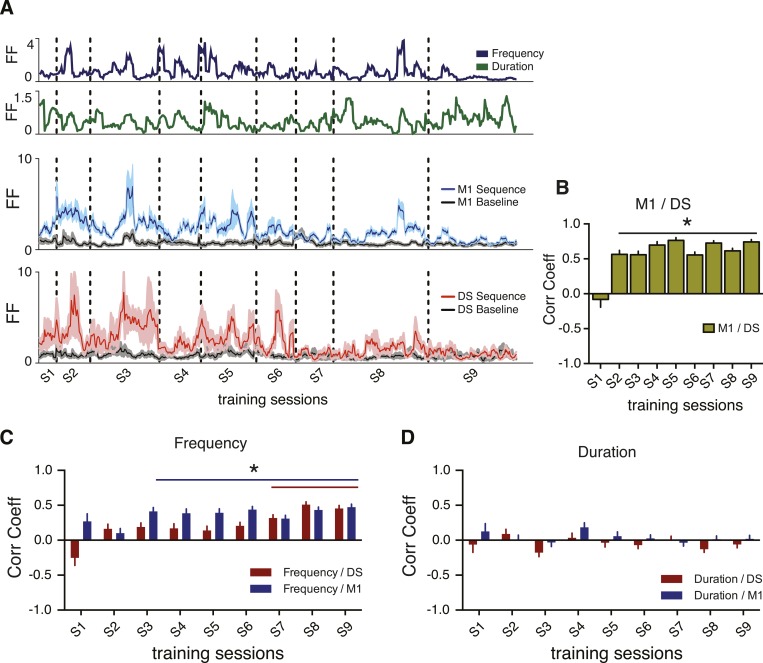
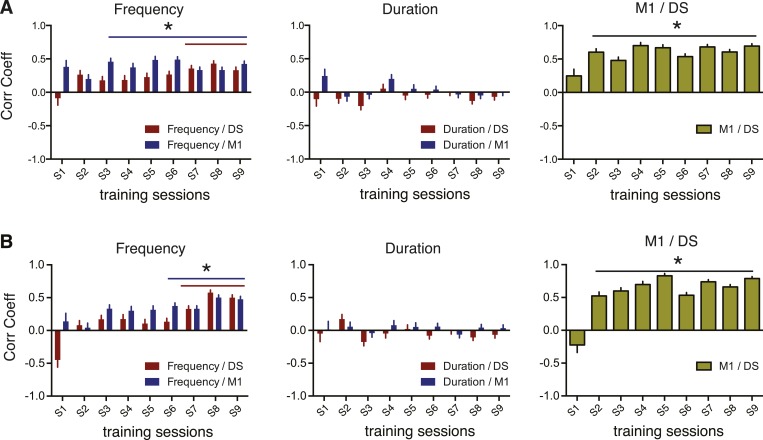
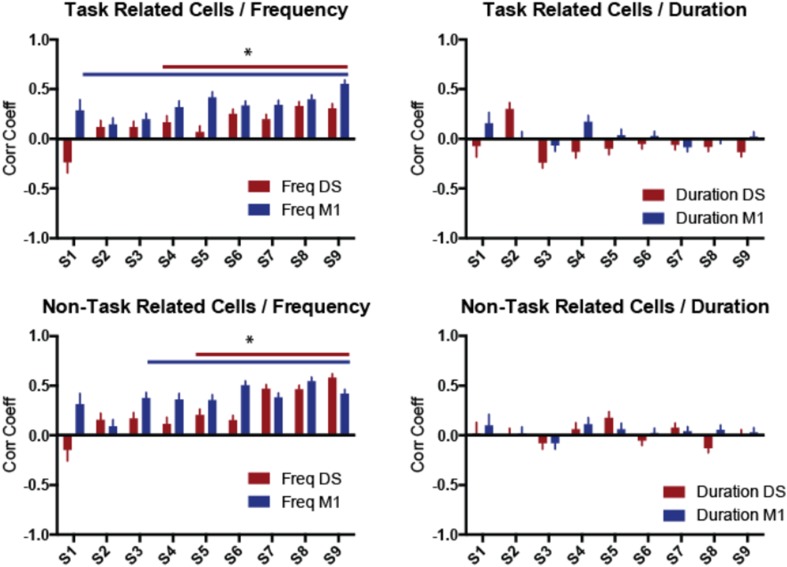
The results above suggest that the decrease in corticostriatal variability is not related to a general decrease in behavioral variability. We therefore investigated if the changes in sequence-to-sequence variability in neural activity were related to the changes in sequence-to-sequence variability of specific behavioral dimensions. We re-calculated the Fano factor of the behavioral features and the neuronal activity using a moving average of a reduced number of trials (5) to provide a higher within session resolution of the variability dynamics and therefore permit the correlation of behavioral and neuronal dynamics across training for each animal (Figure 6A, see ‘Materials and methods’). Analyses of the relationship between the variability of the recorded units and the variability of each independent behavior feature revealed a significant increase in correlation between neuronal and behavior variability, specific for sequence frequency (Figure 6C), but not for duration (Figure 6D). These results were observed when using only task-relevant or non-task-relevant neurons (data not shown). They were also observed using different number of trials for calculating the moving average of the Fano factor (Figure 6—figure supplement 2).

Figure 6. Correlations between corticostriatal and behavioral variability emerge for specific behavioral features.

(A) Example traces from a single animal representing variability, calculated as the Fano factor, using a moving window of five consecutive trials shifted by one for sequence frequency (dark blue trace), sequence duration (green trace), M1 units firing rate during sequences (blue trace) and baseline (grey trace), and DS units firing rate during sequences (red trace) and baseline (grey trace). Vertical dashed lines represent separation of different training sessions. Shaded areas correspond to mean ± SEM. (B) Correlation between the variability (FF) in M1 and DS. (C, D) Correlation between variability traces from neuronal firing rates in M1 (blue bars) or DS (red bars), and variability of sequence frequency or duration. Error bars denote correlation coefficient ±standard error of the correlation. *p < 0.05.

DOI: http://dx.doi.org/10.7554/eLife.09423.013

Figure 6.

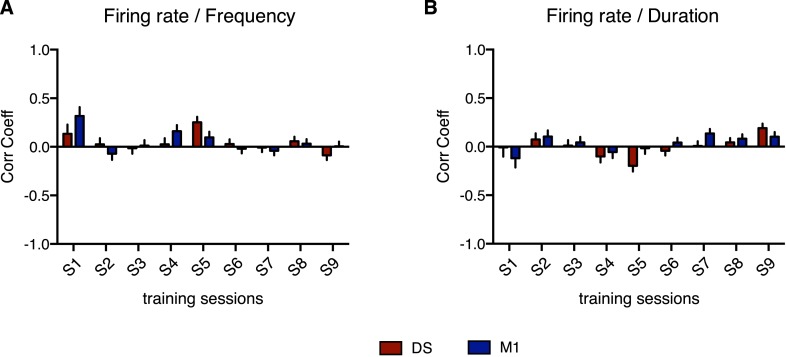
Figure 6—figure supplement 1. No significant correlation was found between average firing rate and any of the behavior features.

Figure 6—figure supplement 1.

Correlation between the firing rate and (A) sequence frequency or (B) sequence duration. Error bars denote correlation coefficient ±standard error of the correlation.
Figure 6—figure supplement 2. Changing the number of trials used for Fano factor calculation did not affect the observed corticostriatal and neuronal/behavioral variability correlations.

Figure 6—figure supplement 2.

(A, B) Correlation between variability traces from neuronal firing rates of cortical and striatal units, and between neuronal variability and variability of sequence frequency and duration using 3 (A) or 7 (B) consecutive trials. Error bars denote correlation coefficient ±standard error of the correlation. *p < 0.05.

These results show that the decrease in variability in M1 and DS is not just a reflection of a more constrained performance of the movement as training progresses; variability of the movement decreased in a specific dimension but it increased in others were no significant correlation with neuronal variability was evident. Furthermore, no significant correlations were observed between the firing rate of neurons and the variability any of the behavior features (Figure 6—figure supplement 1), indicating again that the observed relationship between neuronal and behavior dynamics was not the reflex of a general increase in correlation between neuronal activity and behavior.

The data presented above suggested that as training progressed variability in M1 and striatum became more correlated with variability in a specific domain of behavior that changed the probability of reinforcement. This suggests that neural variability in M1 and striatum could also become more coupled with training. We verified that at the onset of training the sequence-to-sequence variability of neural activity in DS and M1 in each animal was not correlated. However, a strong correlation between the variability in DS and M1 rapidly emerged during training (p < 0.05 for all except the first training session, Figure 6B), suggesting that as behavioral variability is refined, neural variability in M1 and striatum becomes correlated.

Corticostriatal plasticity is required for the refinement of behavior variability

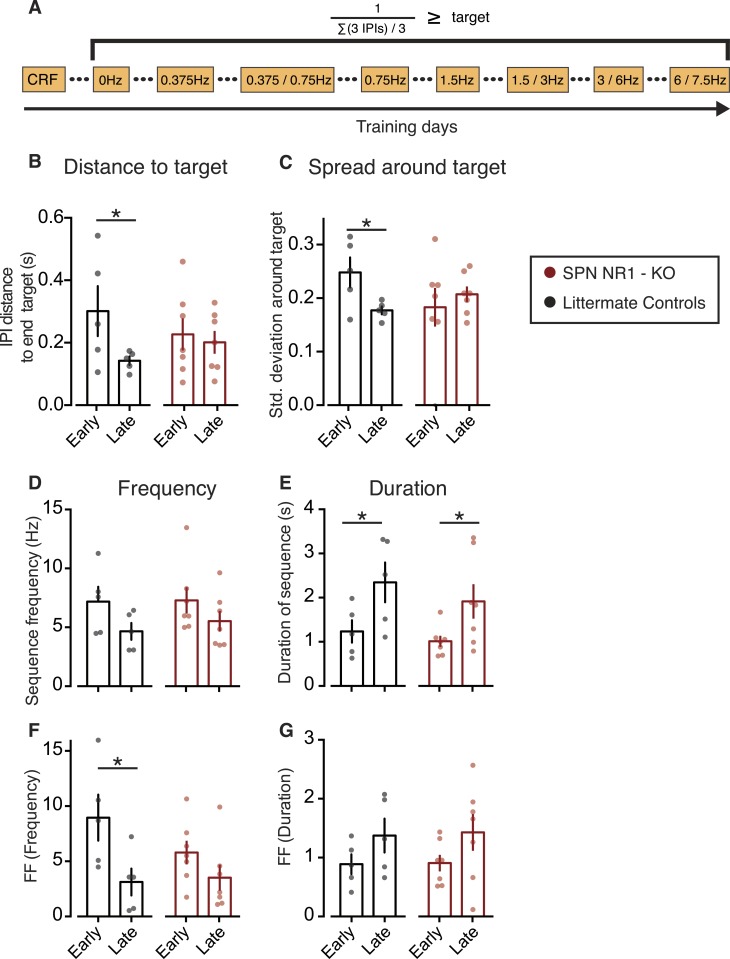
The results presented above show that a coupled reduction in corticostriatal variability accompanies the reduction in variability of sequence frequency, but not of sequence duration, suggesting that corticostriatal plasticity is necessary to select the appropriate motor features and hence reduce variability within specific domains. We decided to directly test if the observed reduction in sequence frequency variability is dependent on corticostriatal plasticity by using mutant mice with NMDA receptors deleted specifically at glutamatergic synapses of striatal projection neurons (RGS9-LCre::Grin1tm1Yql; referred to in the figures as striatal projection neuron SPN NR1-KO), which have impaired corticostriatal plasticity (Dang et al., 2006), and control littermates. Mutant animals had more difficulty learning the task, so we adapted the training protocol to one session per day for both mutant and littermate controls (and repeated sessions when needed), in order to achieve comparable performance levels (see ‘Materials and methods’, Table 1 and Figure 7A).

Table 1.

Training protocol and respective number of animals reaching performance criteria for the SPN NR1-KO group and littermate controls

DOI: http://dx.doi.org/10.7554/eLife.09423.016

Training protocol Free 0.375 Hz 0.375/0.75 Hz (30 reinf) 0.75 Hz 1.5 Hz 1.5/3 Hz (30 reinf) 3/6 Hz (10 reinf) 6/7.5 Hz (10 reinf)
# of subjects reaching criteria NR1–KO 7 7 6 6 5 4 1 1
Controls 5 5 5 5 5 5 5 2

Figure 7. Corticostriatal plasticity is necessary for the specific refinement of behavioral variability.

(A) Schematic of the adapted training sessions for mutant animals and littermate controls. Animals would remain in the same training session until reaching a stable performance. (B) Distance of the sum of all three consecutive IPIs from the final covert target (∑(3 IPIs) <660 ms, ∼4.5 Hz) in SPN NR1 mutants and littermate controls (C) Spread of the distance between three consecutive IPIs around the final covert target. (DG) Behavior parameters and variability, measured as the Fano factor, during early and late training sessions in SPN NR1 mutants and littermate controls groups. Bars correspond to mean, with data from individual animals plotted on the background (red: SPN NR1-KO; black: littermate controls).

DOI: http://dx.doi.org/10.7554/eLife.09423.017

Figure 7.

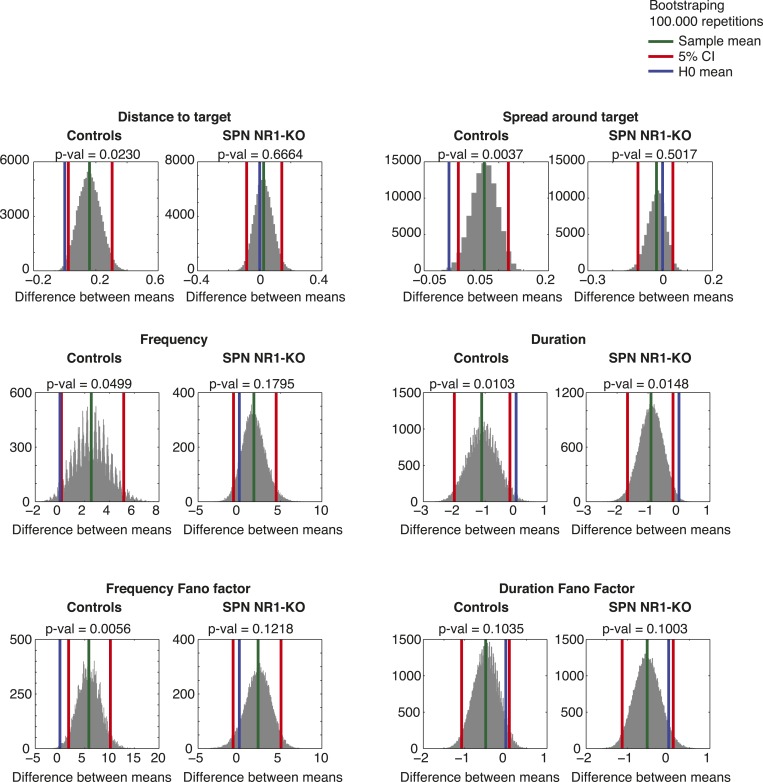
Figure 7—figure supplement 1. Bootstrapping statistics in the SPN NR1-KO data support the observations from the post hoc planned comparisons.

Figure 7—figure supplement 1.

Histograms depicting the sampled statistic (difference between the means of two groups), after sampling with replacement the original data 100.000 times. Red vertical lines correspond to the 5% confidence intervals. Green vertical line corresponds to the mean of the sampled data. Blue vertical line corresponds to the difference between the original data groups (H0).

As expected, the distance to target (Controls: p = 0.0450, t5 = 2.657, Figure 7B) and spread around the target (Controls: p = 0.0179, t5 = 3.466, Figure 7C) decreased in littermate controls. However, neither of these measures changed with training in mutants (Mutants: p = 0.3535, t6 = 1.005; and p = 0.2817, t6 = 1.183, respectively; Figure 7B,C).

In general, no significant difference was observed for any of the behavior features between the two groups of animals. However, planned comparisons did show that RGS9-LCre::Grin1tm1Yql mutants did not decrease sequence frequency variability during training, in contrast to littermate controls which did (significant main effect of training time: F1,10 = 10.13, p = 0.009; Posthocs: Mutant group: t10 = 1.38, p = 0.1964; Control group: t10 = 3.00, p = 0.0134). Importantly, no differences in the modulation of sequence duration variability were observed between the two groups (no significant main effect for genotype: Duration FF: F1,10 = 0.02, p = 0.887) (Figure 7D–G). These statistical results were robust as they were confirmed using bootstrapping statistics (using 100.000 random samples of the data, with replacement) (Figure 7—figure supplement 1). These data suggest that corticostriatal plasticity is required for the reduction in variability of specific behavioral features that change the probability of reinforcement.

Discussion

In this study we show that when mice are trained on a difficult operant paradigm they differentially refine specific behavioral features. When mice were asked to perform progressively faster covert patterns of lever presses to obtain a reinforcer, they reduced variability in sequence frequency, but increased variability in an orthogonal uncorrelated feature (sequence duration). These results are interesting because both features would be classically considered task-relevant—a covert sequence of four presses, which is the minimum to produce a reinforcer in this task, has to have a minimal duration. However, although both features could be considered relevant for the task, only changes in frequency variability were differentially reinforced. Reinforced sequences had lower variability in frequency than non-reinforced sequences, but had equal variability in duration as non-reinforced sequences. Thus, our results indicate that animals reduced frequency variability because that was what was reinforced throughout training. Consistent with this interpretation, in a task where the exact number of presses (correlated with duration) was reinforced but the frequency at which the sequence was performed was not, variability in duration decreased and in frequency increased. This in line with data demonstrating differential modulation of the different components of task space during learning (Todorov and Jordan, 2002; Müller and Sternad, 2004; Cohen and Sternad, 2009).

In previous studies from our group where animals performed operant tasks where the constrains were more relaxed (Jin and Costa, 2010), animals decreased variability in all behavioral domains (i.e., they became more stereotypical overall). However, when faced with a more challenging task as in the present study, they decreased variability in the domain that was critical for getting a reinforcer, but increased variability in orthogonal domains (i.e., they were more stereotypical in just a particular domain). It could be that the increase in variability in the orthogonal behavioral domains happens because in difficult tasks animals try to minimize the effort to obtain reinforcers, and hence do not attempt to reduce variability in more than one independent domain. Alternatively, it could also be that mice increased the duration of the sequence (and the correlated number of presses) as a strategy to try to increase the probability of getting a successful covert pattern in that sequence. However, this second possibility is less likely, given that the two behavioral features were not correlated, and that sequences of different durations were equally likely to get reinforced. These data suggest that in more challenging motor tasks it is difficult to reduce variability in all domains, and animals seem to differentially refine the motor patterns that led to reinforcement. Consistently, the number of sequences that comply with the minimum frequency required for the last session (end-target) increased with training and the distance to the end-target decreased with training, indicating that mice implicitly learned to shape their behavior to match the task requirements.

At the neural level, we observed initial high sequence-to-sequence variability of neuronal activity in corticostriatal circuits that decreased with training. Variability in the spike patterns of individual neurons and populations of neurons may be the bases for a process of behavioral exploration (or trial) (Olveczky et al., 2005; Kao et al., 2005; Mandelblat-Cerf et al., 2009), while a decrease in neural variability may reflect a process of selection of specific patterns of neural activity that lead to specific behavioral outputs (Costa et al., 2004; Kao et al., 2005; Fee and Goldberg, 2011). It has been suggested that a decrease in corticostriatal variability as a motor task is learned (Costa et al., 2004; Barnes et al., 2005) could correspond to the process of selection and consolidation of specific motor patterns (Costa, 2011). Here, we show that this decrease in neural variability in corticostriatal circuits correlates specifically with the decrease in variability of a particular behavior domain. These data suggest that the neural patterns in motor cortex and sensorimotor striatum that give rise to the behavioral patterns that are reinforced are progressively selected. Provocatively, it also suggests that changes in motor variability that are not specifically reinforced but are part of a strategy or driven by effort reduction may be encoded somewhere else.

Finally, we also show that corticostriatal plasticity is important for the refinement of specific behavior features. Our data therefore suggests an important role for corticostriatal plasticity in selecting the appropriate implicit neural and behavioral patterns that are reinforced (Costa, 2011). However corticostriatal plasticity did not seem to be necessary for the increase in behavioral variability in other domains (Goldberg and Fee, 2011). Although in this study we don't investigate the mechanisms underlying the generation of variability, several studies have suggested that the basal ganglia, dopaminergic system, specific cortical circuits, or cerebellar circuits could subserve this function (Olveczky et al., 2005; Costa et al., 2006; Leblois et al., 2010; Costa, 2011; Fee and Goldberg, 2011; Shmuelof and Krakauer, 2011; Woolley et al., 2014).

Taken together, our findings suggest that corticostriatal plasticity is important to select the neural patterns that lead to the movement patterns that are reinforced. They highlight that corticostriatal plasticity is not only important for choosing which action to do, but also to shape how to do it to obtain a desired outcome.

Materials and methods

Animals

All experiments were carried in accordance to the ethics committee guidelines of the Champalimaud Foundation and Instituto Gulbenkian de Ciência, and with approval of the Portuguese DGAV (Ref. 0421). Experiments were carried out using 20 male, 3 to 5 month old C57BL6/J mice. From these, 13 animals were used exclusively for behavioral training while the remaining seven underwent microelectrode array implantation for neuronal data recordings. Animals were maintained on a light–dark cycle of 12 hr:12 hr starting at 7 AM. All experiments were done during the light cycle. Mice were housed in groups of four animals prior to surgery and individually after the electrodes were implanted. 3 to 6 months old RGS9-LCre::Grin1tm1Yql homozygous mice (N = 7) and Cre negative littermate controls (N = 5) were used for the mutant mouse behavioral experiments.

Surgery and in vivo extracellular recordings

Seven C57Bl6/J mice were implanted bilaterally with two micro-electrode arrays (2 × 8), 35–50 µm tungsten electrodes with micro-polished tips. One array targeted the primary motor cortex (M1, layer 5) while the second was targeting the (DS, sensorimotor area that receives projections from the same area in M1). Craniotomies and electrode array positioning were done according to coordinates from the Mouse Brain Atlas (Paxinos and Franklin, 2008). M1 array was placed 1 mm rostral and 1.6 mm lateral from bregma, and lowered ∼1 mm from the surface of the brain. DS array was placed 0.5 mm rostral and 2.1 mm lateral from bregma, and lowered ∼2.3 mm from the surface of the brain. Electrodes were manually lowered at slow rates while constantly monitoring neural activity in all the channels in order to control for proper electrode function and correct positioning. Final verification of electrode position was done after all the experiments were finished, by perfusing animals with PFA and histological confirmation of Nissl stained 70 µm brain slices (Figure 4—figure supplement 1A,B). After surgery animals were allowed to recover for at least 2 weeks before starting any other experimental procedure. Single and multi unit activity was recorded using Blackrock Microsystems Neural Signal Processor, allowing for online sorting of identified units. Further offline sorting of selected units was done using Plexon Offline Sorter v3 (Plexon Inc, Dallas, TX, United States), based on waveform characteristics, ISI and PCA clustering. Units stability was assessed from waveforms and PCA cluster proprieties. For PCA cluster comparison data from all the training sessions was pooled together to calculate common eigen vectors. Data from individual sessions was then projected into this common PC space, allowing us to determine cluster centroids and dispersion for each session. Clusters were considered stable whenever the centroid in a given session was comprised within the interval of the centroid of the previous session ±1.96 * standard deviation of the cluster, in the first two principal components (Figure 4—figure supplement 1C for a graphical representation of this criteria).

Behavioural training

Animals were trained using operant chambers (MedAssociates Inc, St. Albans, VT, United States) placed inside sound attenuating boxes. A retractable lever was extruded in the beginning of each session, simultaneous to the onset of a light. Animals were required to perform a sequence of presses at a minimum frequency in order to obtain a 20 mg food pellet (Bio-Serv, Flemington, NJ, United States). 24 hr before the first training session animals were placed under a food restriction schedule. Body weight was constantly monitored in order to be kept above 85% of the initial weight. In order to facilitate learning, animals were initially exposed to one session of magazine training were food pellets would be available on a random time schedule, and to three sessions of continuous reinforcement schedule (CRF) 1 day before training, where single lever presses would be reinforced. On the following training sessions animals were reinforced if they performed a sequence of consecutive presses at a minimum frequency (covert target), defined by the inverse of three consecutive inter-press intervals (IPIs), which increased with training. On the first session there was no minimum frequency target, meaning that any consecutive 3 IPIs would lead to reinforcement. In consecutive sessions the minimum frequency that would lead to reinforcement was increased or maintained in the following order: 0.375 Hz, 0.75 Hz, 0.75 Hz, 1.5 Hz, 3 Hz, 3 Hz, 4.5 Hz and 4.5 Hz. This constant increase in the minimum frequency of the covert target forced the animals to systematically adapt to the task requirements and perform faster sequences of presses from session to session. The training protocol for mutant animals and littermate controls was adapted due to difficulties learning the task, to one daily session and using automatic progressive schedules once a minimum number of reinforcements (30 or 10) was achieved. (Table 1 for performance summary.)

Sequences of lever presses

Sequences of presses were differentiated based on IPI and occurrence of a magazine head entry. An IPI >2 s (determined based on the distribution of IPIs) or a head-entry were used to define the bouts or sequences of presses. The 2 s cutoff was determined from the joint distribution of the instantaneous IPIs (and the corresponding log distribution) from all the animals, by determining the valley between the two main peaks of IPIs (Figure 1—figure supplement 1C,D). Frequency of each sequence was defined as the inverse of the average IPI of each sequence. Duration of each sequence was defined as the time between the first and the last press event. Length of each sequence was defined as the number of press events in each sequence. For the matched sequences analysis, sequences with a duration of 0.2–2 s and a frequency higher than 2 Hz were selected.

Task-related neurons

Neural activity was averaged in 20-ms bins, shifted by 1 ms, and averaged across trials to construct the peri-event histogram (PETH). Data from the PETH from 5000 to 2000 ms before lever press were considered as baseline activity. A positive modulation in firing rate was defined if at least 20 consecutive bins had firing rate larger than a threshold of 99% above baseline activity, and a negative modulation of firing rate was defined if at least 20 consecutive bins had a firing rate smaller than a threshold of 95% below baseline activity (Belova et al., 2007). Paired t-tests between baseline firing rate and sequence firing rate were used to classify individual neurons as sequence-related.

Analysis and statistics

The programs to run the tasks presented in this study can be found at http://tinyurl.com/or7ug72. Analyses were done in Matlab (MathWorks, Natick, MA, United States) or GraphPad Prism (GraphPad Software Inc, La Jolla, CA, United States). Normality was verified for all tests using the D'Agostino-Pearson omnibus normality test, or the Kolmogorov–Smirnov test when sample size was too small. Repeated measures ANOVA were used to evaluate changes in behavior and neuronal features. Probability of a magazine check after lever-press was evaluated using one-way ANOVA and post hoc comparisons using Fisher's LSD test, but one subject was excluded from these analysis due to a lack of recorded timestamps for magazine head-entries. Paired t-tests were used to evaluate differences in percentage of lever-presses. Increases in FF modulation were assessed by the Wilcoxon Rank Signed test. Repeated measures two-way ANOVA was used to verify the general effect of the RGS9-NR1 mutants experiment. Bootstrapping statistics were used on the data from the RGS9-NR1 mutants and littermate controls to validate the results from the post hoc tests. Histograms were built from 100000 randomized samples with replacement. Sample sizes were calculated based on α = 0.05 and power of 0.7. Trial to trial variability of neuronal and behavior data was assessed using Fano factor. We calculate the Fano factor of individual units by dividing the variance of firing rates across all the trials of a session by the mean over those trials. Fano factor and firing rate modulations for individual stable cells were calculated as the ratio between the difference of values for sequence and baseline and the values during baseline (Fano factor: [FFsequence − FFbaseline]/FFbaseline; firing rate: [FRsequence − FRbaseline]/FRbaseline). Fano factor of the behavioral features was calculated by dividing the variance in the individual features by the mean of the feature for all the trials. To establish correlations between the variability of the neuronal data and the variability of the behavior, Fano factors were calculated using three, five or seven consecutive trials, allowing us to increase the resolution of the variability measures. Correlations between neuronal and behavior data were evaluated using Pearson's linear correlations. To avoid correlations bias due to sample size, statistical significance of all the correlations was assessed using the significance criteria for the session with smaller size. Within animal correlations averaged using Fisher's z transformation (Silver and Dunlap, 1987) returned similar results to grouped correlations for all the tested conditions (data not shown).

Acknowledgements

We thank V Paixão and A Gomez-Marin for valuable comments on the manuscript and A Vaz for animal colony management. This research was supported by the INDP Graduate Programme and a FCT fellowship to FJS, and European Research Council Consolidator Grant, HHMI International Early Career Scientist Grant, and ERA-Net NEURON grants to RMC.

Funding Statement

The funders had no role in study design, data collection and interpretation, or the decision to submit the work for publication.

Funding Information

This paper was supported by the following grants:

  • Howard Hughes Medical Institute (HHMI) International Early Career Scientist Grant IEC 55007415 to Rui M Costa.

  • European Research Council (ERC) Consolidator Grants, ERC CoG 617142 to Rui M Costa.

  • ERA NET NEURON to Rui M Costa.

Additional information

Competing interests

RMC: Reviewing editor, eLife.

The other authors declare that no competing interests exist.

Author contributions

FJS, Conception and design, Acquisition of data, Analysis and interpretation of data, Drafting or revising the article.

RFO, Acquisition of data, Drafting or revising the article.

XJ, Acquisition of data, Drafting or revising the article.

RMC, Conception and design, Analysis and interpretation of data, Drafting or revising the article.

Ethics

Animal experimentation: All experimental procedures were carried in accordance to the ethics committee guidelines of the Champalimaud Foundation and Instituto Gulbenkian de Ciência, and with approval of the Portuguese DGAV (ref 0421).

References

  1. Barnes TD, Kubota Y, Hu D, Jin DZ, Graybiel AM. Activity of striatal neurons reflects dynamic encoding and recoding of procedural memories. Nature. 2005;437:1158–1161. doi: 10.1038/nature04053. [DOI] [PubMed] [Google Scholar]
  2. Belova MA, Paton JJ, Morrison SE, Salzman CD. Expectation modulates neural responses to pleasant and aversive stimuli in primate amygdala. Neuron. 2007;55:970–984. doi: 10.1016/j.neuron.2007.08.004. [DOI] [PMC free article] [PubMed] [Google Scholar]
  3. Cohen RG, Sternad D. Variability in motor learning: Relocating, channeling and reducing noise. Experimental Brain Research. 2009;193:69–83. doi: 10.1007/s00221-008-1596-1. [DOI] [PMC free article] [PubMed] [Google Scholar]
  4. Costa RM. A selectionist account of de novo action learning. Current Opinion in Neurobiology. 2011;21:579–586. doi: 10.1016/j.conb.2011.05.004. [DOI] [PubMed] [Google Scholar]
  5. Costa RM, Cohen D, Nicolelis MA. Differential corticostriatal plasticity during fast and slow motor skill learning in mice. Current Biology. 2004;14:1124–1134. doi: 10.1016/j.cub.2004.06.053. [DOI] [PubMed] [Google Scholar]
  6. Costa RM, Lin SC, Sotnikova TD, Cyr M, Gainetdinov RR, Caron MG, Nicolelis MA. Rapid alterations in corticostriatal ensemble coordination during acute dopamine-dependent motor dysfunction. Neuron. 2006;52:359–369. doi: 10.1016/j.neuron.2006.07.030. [DOI] [PubMed] [Google Scholar]
  7. Dang MT, Yokoi F, Yin HH, Lovinger DM, Wang Y, Li Y. Disrupted motor learning and long-term synaptic plasticity in mice lacking NMDAR1 in the striatum. Proceedings of the National Academy of Sciences of USA. 2006;103:15254–15259. doi: 10.1073/pnas.0601758103. [DOI] [PMC free article] [PubMed] [Google Scholar]
  8. Diedrichsen J, Shadmehr R, Ivry RB. The coordination of movement: optimal feedback control and beyond. Trends in Cognitive Sciences. 2010;14:31–39. doi: 10.1016/j.tics.2009.11.004. [DOI] [PMC free article] [PubMed] [Google Scholar]
  9. Fee MS, Goldberg JH. A hypothesis for basal ganglia-dependent reinforcement learning in the songbird. Neuroscience. 2011;198:152–170. doi: 10.1016/j.neuroscience.2011.09.069. [DOI] [PMC free article] [PubMed] [Google Scholar]
  10. Franklin DW, Wolpert DM. Specificity of reflex adaptation for task-relevant variability. Journal of Neuroscience. 2008;28:14165–14175. doi: 10.1523/JNEUROSCI.4406-08.2008. [DOI] [PMC free article] [PubMed] [Google Scholar]
  11. Goldberg JH, Fee MS. Vocal babbling in songbirds requires the basal ganglia-recipient motor thalamus but not the basal ganglia. Journal of Neurophysiology. 2011;105:2729–2739. doi: 10.1152/jn.00823.2010. [DOI] [PMC free article] [PubMed] [Google Scholar]
  12. Grunow A, Neuringer A. Learning to vary and varying to learn. Psychonomic Bulletin & Review. 2002;9:250–258. doi: 10.3758/BF03196279. [DOI] [PubMed] [Google Scholar]
  13. Harris CM, Wolpert DM. Signal-dependent noise determines motor planning. Nature. 1998;394:780–784. doi: 10.1038/29528. [DOI] [PubMed] [Google Scholar]
  14. Jin X, Costa RM. Start/stop signals emerge in nigrostriatal circuits during sequence learning. Nature. 2010;466:457–462. doi: 10.1038/nature09263. [DOI] [PMC free article] [PubMed] [Google Scholar]
  15. Kao MH, Doupe AJ, Brainard MS. Contributions of an avian basal ganglia-forebrain circuit to real-time modulation of song. Nature. 2005;433:638–643. doi: 10.1038/nature03127. [DOI] [PubMed] [Google Scholar]
  16. Leblois A, Wendel BJ, Perkel DJ. Striatal dopamine modulates basal ganglia output and regulates social context-dependent behavioral variability through D1 receptors. Journal of Neuroscience. 2010;30:5730–5743. doi: 10.1523/JNEUROSCI.5974-09.2010. [DOI] [PMC free article] [PubMed] [Google Scholar]
  17. Mandelblat-Cerf Y, Paz R, Vaadia E. Trial-to-trial variability of single cells in motor cortices is dynamically modified during visuomotor adaptation. Journal of Neuroscience. 2009;29:15053–15062. doi: 10.1523/JNEUROSCI.3011-09.2009. [DOI] [PMC free article] [PubMed] [Google Scholar]
  18. Miller JE, Hilliard AT, White SA. Song practice promotes acute vocal variability at a key stage of sensorimotor learning. PLOS ONE. 2010;5:e8592. doi: 10.1371/journal.pone.0008592.s007. [DOI] [PMC free article] [PubMed] [Google Scholar]
  19. Müller H, Sternad D. Decomposition of variability in the execution of goal-oriented tasks: three components of skill improvement. Journal of Experimental Psychology. Human Perception and Performance. 2004;30:212–233. doi: 10.1037/0096-1523.30.1.212. [DOI] [PubMed] [Google Scholar]
  20. Olveczky BP, Andalman AS, Fee MS. Vocal experimentation in the juvenile songbird requires a basal ganglia circuit. PLOS Biology. 2005;3:e153. doi: 10.1371/journal.pbio.0030153. [DOI] [PMC free article] [PubMed] [Google Scholar]
  21. Paxinos G, Franklin KB. The mouse brain in stereotaxic coordinates. 3rd edition. Waltham, MA; Academic Press: 2008. [Google Scholar]
  22. Scott SH. Optimal feedback control and the neural basis of volitional motor control. Nature Reviews Neuroscience. 2004;5:532–546. doi: 10.1038/nrn1427. [DOI] [PubMed] [Google Scholar]
  23. Shmuelof L, Krakauer JW. Are we ready for a natural history of motor learning? Neuron. 2011;72:469–476. doi: 10.1016/j.neuron.2011.10.017. [DOI] [PMC free article] [PubMed] [Google Scholar]
  24. Shmuelof L, Krakauer JW, Mazzoni P. How is a motor skill learned? Change and invariance at the levels of task success and trajectory control. Journal of Neurophysiology. 2012;108:578–594. doi: 10.1152/jn.00856.2011. [DOI] [PMC free article] [PubMed] [Google Scholar]
  25. Silver NC, Dunlap WP. Averaging correlation coefficients: should Fisher's z transformation be used? Journal of Applied Psychology. 1987;72:146–148. doi: 10.1037/0021-9010.72.1.146. [DOI] [Google Scholar]
  26. Skinner BF. Selection by consequences. Science. 1981;213:501–504. doi: 10.1086/676645. [DOI] [PubMed] [Google Scholar]
  27. Sutton RS, Barto AG. Reinforcement learning. MIT Press; Cambridge, MA: 1998. [Google Scholar]
  28. Todorov E, Jordan MI. Optimal feedback control as a theory of motor coordination. Nature Neuroscience. 2002;5:1226–1235. doi: 10.1038/nn963. [DOI] [PubMed] [Google Scholar]
  29. Tumer EC, Brainard MS. Performance variability enables adaptive plasticity of ‘Crystallized’ adult birdsong. Nature. 2007;450:1240–1244. doi: 10.1038/nature06390. [DOI] [PubMed] [Google Scholar]
  30. Valero-Cuevas FJ, Venkadesan M, Todorov E. Structured variability of muscle activations supports the minimal intervention principle of motor control. Journal of Neurophysiology. 2009;102:59–68. doi: 10.1152/jn.90324.2008. [DOI] [PMC free article] [PubMed] [Google Scholar]
  31. Woolley SC, Rajan R, Joshua M, Doupe AJ. Emergence of context-dependent variability across a basal ganglia network. Neuron. 2014;82:208–223. doi: 10.1016/j.neuron.2014.01.039. [DOI] [PMC free article] [PubMed] [Google Scholar]
  32. Wu HG, Miyamoto YR, Gonzalez Castro LN, Olveczky BP, Smith MA. Temporal structure of motor variability is dynamically regulated and predicts motor learning ability. Nature Neuroscience. 2014;17:312–321. doi: 10.1038/nn.3616. [DOI] [PMC free article] [PubMed] [Google Scholar]
eLife. 2015 Sep 29;4:e09423. doi: 10.7554/eLife.09423.019

Decision letter

Editor: Ole Kiehn1

eLife posts the editorial decision letter and author response on a selection of the published articles (subject to the approval of the authors). An edited version of the letter sent to the authors after peer review is shown, indicating the substantive concerns or comments; minor concerns are not usually shown. Reviewers have the opportunity to discuss the decision before the letter is sent (see review process). Similarly, the author response typically shows only responses to the major concerns raised by the reviewers.

[Editors’ note: a previous version of this study was rejected after peer review, but the authors submitted for reconsideration. The first decision letter after peer review is shown below.]

Thank you for choosing to send your work entitled “Corticostriatal dynamics encode the refinement of outcome-relevant variability during skill learning” for consideration at eLife. Your full submission has been evaluated by Timothy Behrens (Senior Editor) a member of the Board of Reviewing Editors and three peer reviewers and the decision was reached after extensive discussions between the reviewers. Based on our discussions and the individual reviews below, we have reached the decision that we will reject the paper as is.

The reviewers agree that the study addresses an important issue in neuroscience and is of potential interest for a broad audience. There are, however, strong concerns whether the main claims of the paper are supported by the data as presented. An elaborated and unbiased analysis is needed to show that the behavior and electrophysiological results indeed support the main claims in the study. Because of eLife's policy direct invitation for revision should not require elaborated work we are forced to reject the paper. However, we would be willing to look at a new manuscript that addresses the main concerns that were raised against the study. It is essential that, in particular the point about outcome-relevant specificity, is addressed appropriately.

The main elements of concerns are outlined here and further elaborated in the specific comments from the reviewers.

1) The analysis should provide clear evidence that the reduction in frequency variability is in fact real and that the animal is refining its behavior. The authors need to demonstrate that the behavior is indeed refined and that the variance will decrease not just because the duration of presses decreases or that the number of presses in each sequence is very small in the first sessions. It also should be clear that the effect is not just the out of sequence presses that decrease rather than the in sequence that increase. For analysis of the neuron data is should be clear that on what segment the firing rate is measured. If the firing rate is measured on the entire duration of the pressing sequence then it is liable to the same criticism as pointed out above. Namely, measuring the firing rate in longer time windows will have smaller variance.

2) The main part of the story rests on the claim that it is only variability in the outcome relevant aspect of the behavior that decreases with learning. This is in contrast to variability in sequence length or duration, allegedly outcome-irrelevant aspects. Yet the data suggest that longer sequences improve task-performance and that the mice increase them with learning. Thus length/duration seems to be outcome relevant, despite the experimental protocol not explicitly rewarding on these features.

This point needs to be substantiated with further analysis to show an outcome-relevant specificity. It will be important to discuss why behaviors under FR3/0.66s protocol in this study and FR4/0.5s protocol in earlier study give rise to very different behavioral patterns. The authors should include a re-analysis of the FR4/FR8 behavioral results in this paper to show that, under slightly different operant requirements, mice can selectively reduce the variability of press length instead of press frequency. They should directly test the simple possibility that M1/DS activity linearly encode press frequency (for example average press frequency of a sequence; or max frequency of a sequence; or instantaneous frequency associated with each press) using correlation analysis. If such is the case, the authors should quantify the overlap between sequence-related neurons and press-related neurons, and see if the two populations show more overlap over training blocks. Alternatively, the absence of significant correlation would suggest that M1/DS activity is coding for properties related to press frequency in non-linear ways, and FF correlation is a novel approach to reveal this hidden relationship. As additional controls to establish the specificity of the observed FF correlation, the authors should (1) clearly indicate whether this analysis involve all neurons, or only sequence-related neurons, (2) indicate what the time window used to calculate average firing rate within a press, (3) provide a correlation analysis done on a per-neuron basis, (4) indicate if lever-press related neurons show the same correlation, as well as what happen to other task-unrelated M1/DS neurons.

3) The number of animals in Figure 7 seems very small, there are no error bars and the effects seem to be governed, in some cases by 1-2 animals. The authors should demonstrate that the main result is not due to these animals only.

Reviewer #1:

In this paper, Santos et al. investigated whether motor variability in the outcome-relevant dimension specifically reduces during learning, and whether such reduction is mediated by neuronal activity in corticostriatal circuits. By requiring mice to increase peak press frequency in order to obtain reward, the authors found that variability in press frequency is selectively decreased. Such a reduction in behavioral variability is correlated with a concomitant reduction in M1/DS neuronal activity variability over learning blocks, and abolished in mice with deficient corticostriatal plasticity. These results are potentially very interesting in that they provide elegant experimental support for a widely-held prediction in motor control literature, and also provide a new conceptual framework to analyze behavioral and neuronal dynamics during learning when the mapping between neuronal activity and behavior continues to evolve. I have a number of concerns that I wish the authors address using existing data.

1) A big part of the story rests on the behavioral finding that the variability of press frequency decreased while the variability for press length and duration increased. I was initially concerned that there may be a trivial explanation of this result, or that any animal undergoing press-related operant training may show similar behavior. However, after comparing the current results with those in Xin and Costa (2010) and Xin, Tecuapetla, and Costa (2014), I think it is likely the case that, in earlier studies, mice learn to optimize the number of press under extended FR4 or FR8 training protocol, and thus specifically reduced variability for the number of presses.

I think it is very important for the authors to emphasize this comparison and discuss why behaviors under FR3/0.66s protocol in this study and FR4/0.5s protocol in earlier study give rise to very different behavior patterns. To that end, the authors should perhaps include a re-analysis of the FR4/FR8 behavioral results in this paper to show that, under slightly different operant requirements, mice can selectively reduce the variability of press length instead of press frequency.

2) The moving-window FF correlation between the behavioral features and neural activity (Figure 6) is fascinating. This analysis shows that M1/DS activity FF (but not baseline activity FF) was correlated specifically with FF of average press frequency, but not length or duration. The use of FF to investigate the evolution of neural coding during learning is very clever because, without knowing exactly what behavioral parameters M1/DS activity encode and how the encoding may evolve during learning, the FF correlation strongly supports that M1/DS activity must encode properties related to the average press frequency.

To elaborate on this observation, the authors should directly test the simple possibility that M1/DS activity linearly encode press frequency (for example average press frequency of a sequence; or max frequency of a sequence; or instantaneous frequency associated with each press) using correlation analysis. The presence of significant correlation indicates that M1/DS neurons are encoding for press frequency. If such is the case, the authors should quantify the overlap between sequence-related neurons and press-related neurons, and see if the two populations show more overlap over training blocks. Alternatively, the absence of significant correlation would suggest that M1/DS activity is coding for properties related to press frequency in non-linear ways, and FF correlation is a novel approach to reveal this hidden relationship.

As additional controls to establish the specificity of the observed FF correlation, the authors should: (1) clearly indicate whether this analysis involve all neurons, or only sequence-related neurons; (2) specify what is the time window used to calculate average firing rate within a press (i.e. first press to the last press); can the authors include another window around the onset of the press sequence (i.e. [-1s to first press] or [-0.5s to 0.5s] of first press)?; (3) specify what was the correlation analysis done on a per-neuron basis and then averaged across all neurons (Figure 6C-E) and neuron pairs (Figure B)?; and (4) clarify whether lever-press related neurons show the same correlation. What about other task-unrelated M1/DS neurons? One would hope not.

Reviewer #2:

The paper claims that mice reduce performance variability during performance improvement on a lever-pressing task, but only in the outcome-relevant dimension. They then go on to show that trial-by-trial variability in the average firing rate correlates with performance variability in the outcome-relevant dimension, and more so late in learning. They then use a knockout mouse to probe whether variability reduction requires cortical input to the striatum.

Figure 1D plots the sequence rate, and 2A the sequence frequency. I assume that these are the same, but why are the graphs so different? Then the authors switch to talking about variability in pressing frequency, which is something different. But if we assume that what they call sequence frequency in 2A is in fact pressing frequency (I have no idea if that's the case, but it's a fair assumption given the rest of the paper), then I become confused, because Figure 1–figure supplement 1C and D clearly shows that instantaneous pressing frequency is increased with learning, yet 2A suggest otherwise.

The authors suggest that sequence frequency is task-relevant but that the length of the sequence is not. Yet their own data (Figure 3B) shows that the longer the sequence the more reward is being delivered, hence from the mouse's point of view sequence length seems to be a relevant dimension. If one wanted to make the claim that the mouse decreases the variability in the task relevant dimension over other task-irrelevant ones, then one should design a task that has two explicit and comparable dimensions and make reward contingent first on one and then the other in separate experiments. For example, one could make the first interval in 3-tap sequence subject to some reward criteria, but the second interval not, and then switch it up in the next experiment. If variability decreases for the relevant interval but not the irrelevant one no matter which the reward was contingent on, then that would, to me at least, be a far more compelling result. As it stands they are comparing dimensions that both seem relevant for reward, one which has an increase in variability with learning, another which has a decrease.

Further down, why do the authors compare all neurons when they look at neuronal variability during the task? It seems to me that this analysis should be done only on task-related neurons.

There are also other confounds, like reward probability decreasing with learning, something that on its own is known to affect motor variability.

Reviewer #3:

The manuscript suggests that the refinement of behavior in success related dimensions is correlated with refinement in corticostriatal spiking patterns. This is an important point to be made and the type of experiment the authors did is suitable. The idea itself is not completely novel and several previous studies have suggested this and shown reduction in variance as learning progresses; nevertheless, this is a nice demonstration of the concept and therefore can be important to the field. I do have some concerns with the analyses that dampen my enthusiasm and raise questions about the interpretation of the results. The authors need to make a cleaner and unbiased analysis to show that the behavior and electrophysiological results indeed support the main claim.

Summary of substantive concerns:

1) Are the animals really refining their behavior? The major changes along the training process seem to be:

1.1) The percentage of lever presses within sequences increase (Figure 1C). Alternatively the ‘out of sequence’ presses decrease (Figure 1–figure supplement 1D, all points left of -0.3 dashed line);

1.2) The mean number of presses in a sequence increases (Figure 2B, C);

1.3) The sequence frequency increases (Figure 1D).

The mean frequency in the sequences does not change much (Figure 2

A). This, in fact, may raise concerns about the change in Figures 2D, G. If the IPI in the sequences is drawn (i.i.d.) from a distribution with some fixed (μ) mean, it follows that the distribution of the press rate in some duration has a related mean (1/μ) but also, due to the central limit theorem, that the variance will decrease with the duration. Therefore, the authors need to find a controlled way to demonstrate that the behavior is indeed refined and not that the animals simply make longer pressing sequences and hit their targets by chance.

I think some simple controlled analyses can be done to address this (e.g. sampling similar periods of time etc.), but it has to be shown.

2) The mean number of presses in each sequence is very small in the first sessions (<3, Figure 2B) and the Fano Factor that approaches 1 (Figure 2G) suggests just that. Also, the distributions between the dashed lines in Figure 1–figure supplement 1D do not seem to change much in sessions 3-8. It is therefore important to show that the main result is not due to this effect alone (the low number of presses in sessions 1-2).

3) The case for independence of behavioral dimensions in not clear enough. Figure 2–figure supplement 1 is claiming so but it is not entirely clear to me what is the main conclusion. It needs to be better explained.

4) It is not clear on what segment the firing rate is measured? This is crucial. If the firing rate is measured on the entire duration of the pressing sequence then it is liable to the same criticism as point 1 above. Namely, measuring the firing rate in longer time windows will have smaller variance. Having a mutual cause may explain the result in Figure 6C.

5) The number of animals in Figure 7 seems very small, there are no error bars and the effects seem to be governed, in some cases by 1-2 animals. The authors should demonstrate that the main result is not due to these animals only.

6) In general, the definition of refinement is a bit over-stated here. Reduction is variability is one aspect, yet I could think of several other approaches to define ‘refinement’ that could be interesting as well and produce a richer manuscript with more interesting conclusions.

[Editors’ note: what now follows is the decision letter after the authors submitted for further consideration.]

Thank you for submitting your work entitled “Corticostriatal dynamics encode the refinement of outcome-relevant variability during skill learning” for peer review at eLife. Your submission has been favorably evaluated by Timothy Behrens (Senior Editor), a Reviewing Editor, and three reviewers.

The reviewers have discussed the reviews with one another and the Reviewing Editor has drafted this decision to help you prepare a revised submission.

In this manuscript, Santos et al. investigated whether variability of specific task parameters are reduces during learning, and whether such reduction is mediated by neuronal activity in corticostriatal circuits. By requiring mice to learn a task that involve increased press frequency in order to obtain reward, the authors find that the variability of press frequency is a decreased meter while variability of press duration is not. They conclude that the animals learn to reduce the variability of the frequency as outcome-relevant parameter while outcome irrelevant parameters, like duration, is not changed. They find that the reduction in frequency variability is correlated with a concomitant reduction in M1/DS neuronal activity variability over learning blocks, and abolished in mice with deficient corticostriatal plasticity.

The manuscript is a resubmission. There were several concerns whether the main claims of the manuscript as submitted before were supported by the data as presented. In particular further evidence to support that outcome specificity was restricted to press frequency was requested. The authors have provided new analysis and a set of new experiments to meet these concerns. However, while the reviewers agree that the study has improved after revision the issue of outcome-specificity is still not resolved. Given the paper's focus, this is a major issue that must be addressed. After extensive discussion among reviewers, and editors there is an agreement that the task as presented does not isolate frequency as the only causal dimension in the task. The fact that reward is dispensed based on frequency does not preclude other relevant behavioral parameters, even if those are orthogonal to, or uncorrelated with, sequence frequency. In fact, both sequence frequency and duration are modulated by learning. Success on the task is therefore likely to also depend on duration since it is coupled to sequence length. Therefore, the task does not isolate frequency as the only task-relevant parameter, and the dichotomy between task-relevant (frequency) and task-irrelevant (duration) parameters does not hold. Hence it cannot be claimed that learning is only tuning frequency as the outcome-relevant parameter. Duration is relevant by default in reward accumulation tasks. This may not be reflected in the tuning of neuronal firing patterns while frequency may in this task. This distinction may be interesting but is not spelled out in the manuscript. Careful wording is needed to clarify this and to discuss how the two outcome-relevant parameters that are being compared, sequence frequency and duration, differ. This is important because the difference in the neural correlates of these task aspects, and how they change with learning, is not due to one being task-relevant and the other not, but rather to these being qualitatively different aspects of the task. As the text is now this is not the message the reader will be left with. Thus the dimension along which the two task-relevant parameters differ should be discussed, and an attempt to generalize the results beyond this task should be made. The authors must revise their statements carefully to reflect this and explicitly explain the confounding factor introduced by press duration. This new message should also be reflected in the title and in a more nuanced description in the Abstract, and Introduction of the outcome relevant concept as well as in an expanded discussion of these issues.

A number of other issues were also raised by the reviewers, as outlined below in the detailed report. In particular whether animals know that they are rewarded (see review #2). An analysis based on behavioral data should clarify whether the mice indeed learn to anticipate reward. If so this is also a task-relevant parameter that is learned by the animals.

Reviewer #1:

In this paper, Santos et al. investigated whether motor variability in the outcome-relevant dimension specifically reduces during learning, and whether such reduction is mediated by neuronal activity in corticostriatal circuits. By requiring mice to increase peak press frequency in order to obtain reward, the authors found that variability in press frequency is selectively decreased. In contrast, in a control task that required 4 consecutive presses to obtain reward, variability in press duration but not press frequency decreased. The reduction in outcome-relevant behavioral variability is correlated with a concomitant reduction in M1/DS neuronal activity variability over learning blocks, and abolished in mice with deficient corticostriatal plasticity.

These results are potentially very interesting in that they provide elegant experimental support for a widely-held prediction in motor control literature, and also provide a new conceptual framework to analyze behavioral and neuronal dynamics during learning when the mapping between neuronal activity and behavior continues to evolve. I have a number of concerns that the authors should address.

1) The resubmitted manuscript has significantly improved with the addition of the new control experiment. The pattern of behavioral refinement in the control task is the opposite of the main task, which provides strong support that the behavioral refinement reported in this manuscript is specific to the outcome-relevant dimension. The authors should provide further information of this control task to support this key point, by providing un-normalized results of the control task as in Figure 2A-F, as well as comparison between rewarded and non-rewarded trials as in Figure 3.

2) In prior studies, Xin and Costa indicated that mice could not hear reward delivery and waited until the end of press sequence to check for reward. Is that still the case in this study? From Figure 1E, it seems that mice commonly check for reward right after reaching the press frequency criteria. The authors should provide an analysis to show how many presses do mice continue to press after reaching the criteria frequency in each press. A reduction of this quantity over training sessions will support that mice gained some knowledge of the reward criteria.

This analysis is also important to address lingering concerns about whether press length/duration is an outcome-relevant dimension. If both length and frequency are relevant, mice should generate long sequences with occasional fast presses. This scenario should predict that fast presses can take place anywhere in the sequence. On the other hand, if press frequency is the only outcome-relevant dimension, the fast presses should occur mostly toward the end of the sequence.

Reviewer #2:

My main concern with the initial submission was that the authors pitted two aspects of the task against each other: frequency and duration. While both are clearly correlated with success and both change with learning, the authors called one (frequency) task relevant and the other (duration) not relevant. I think this is misleading and incorrect. This was pointed out in the previous referee report, and the authors revised manuscript does not seem to address this issue.

The authors say that the two aspects aren't correlated with each other, and that this somehow means that if one dimension is task-relevant (frequency) the other (duration) can't be. At least that is how I infer their logic, but this does not make sense. Independent and uncorrelated aspects of a behavior can of course both be task-relevant.

The mice have to press the lever 4 times in a specified time span. Initially this window is long and they get reward easily, so no need for long durations. Then the task becomes harder. If they go to the reward magazine with the same duration, they now get less reward, but if they increase their duration, the chance of getting 4 presses in the allotted time increases, so they learn to increase the duration while also decreasing the frequency. Both are relevant for the task.

The authors also introduce a ‘control’ that shows that the variance in frequency goes down in the original task because it is task-relevant. I never doubted this. Frequency is task relevant, but so is duration. The control is irrelevant for the point I was making.

There are other issues I raised that the authors did not respond to, e.g. do animals know when reward is available, etc. (their analysis on this point is not addressing the point). The authors should show that the probability of mice going to the reward port is not influenced by the reward dropping into the magazine. The data they refer to in this regard (Figure 3) actually seems to suggest that mice do learn this. Early, the rewarded trials are longer than unrewarded, later they are shorter (3B). This is consistent with the mice ‘learning’ when a reward is available either by picking up on a cue or having an internal sense.

Reviewer #3:

The authors resubmitted the manuscript after doing considerable additional analyses and a control experiment. I find the paper to be fairly convincing now, as the authors addressed the concerns in a serious manner. The results now point to reduction in variability along with improvement in a motor task. This constitutes a nice finding. I hope the authors can convince us further by supplying:

1) Figure 2C (var of freq) computed on equal durations from all the sessions. Perhaps I missed it, but I did not see a clear demonstration that the reduction in freq is not related to the increase in duration. There is nice indirect evidence, and even a control experiment, and they are fairly convincing – but a direct demonstration would be appreciated.

2) Is there any relationship/correlation across individuals between the behavioral improvement and the physiological finding? This would strengthen the study.

[Editors' note: further revisions were requested prior to acceptance, as described below.]

Thank you for resubmitting your work entitled “Corticostriatal dynamics encode the refinement of behavioral variability during skill learning” for further consideration at eLife. Your revised article has been evaluated by Timothy Behrens (Senior Editor), a Reviewing Editor, and three reviewers.

In the previous decision letters clear guidance was given for how presentation and discussion should be improved so the paper conveys a clear message supported by the data. A substantial effort was placed in the discussion among reviewers to reach a consensus about the necessary changes. There is a feeling amongst all three reviewers that this has not yet happened and that you have chosen to be selective in your response thereby missing the opportunity to improve the manuscript and meet the raised criticism. We would however like to give you a chance to revise the manuscript so that it meets the raised criticism.

Three main issues still need to be considered:

You were asked to acknowledge that both features you look at (frequency and duration) are outcome-relevant. You have done this only in part. The Discussion mostly uses the old and misleading narrative. This should be remedied.

You were asked to parse the distinction between frequency and duration, and speculate as to why the neural firing patterns associated with these features evolve differently during learning. It was clearly stated that duration and frequency, though both outcome-relevant, are fundamentally different aspects of the task. This needs to be discussed. Frequency has to do with the action that is being reinforced while duration is a strategic decision. The fact that neuronal correlates associated with these fundamentally different processes evolve differently is perhaps not surprising. However, there is no discussion of these differences and what they mean in a form that allows one to generalize to other tasks and situations.

Finally, you were asked to demonstrate whether mice learn to anticipate the reward. You say in the text that you looked at the “probability of a magazine check after a reinforced lever-press” and found that this did not change with learning. In the figure and associated legend you say that you looked at the “Probability of a reinforcement preceding a magazine check” and show that this doesn't change. It is not clear whether these are the same metrics and how they are calculated and whether they allow one to infer anything about the animal's ability to anticipate reward. We advise that you simply show that the probability of checking the magazine does not depend on whether the preceding lever press was reinforced (i.e. the last one in a covert sequence) or not, and show that this is stable over the course of learning.

eLife. 2015 Sep 29;4:e09423. doi: 10.7554/eLife.09423.020

Author response


[Editors’ note: the author responses to the first round of peer review follow.]

The reviewers agree that the study addresses an important issue in neuroscience and is of potential interest for a broad audience. There are, however, strong concerns whether the main claims of the paper are supported by the data as presented. An elaborated and unbiased analysis is needed to show that the behavior and electrophysiological results indeed support the main claims in the study. Because of eLife's policy direct invitation for revision should not require elaborated work we are forced to reject the paper. However, we would be willing to look at a new manuscript that addresses the main concerns that were raised against the study. It is essential that, in particular the point about outcome-relevant specificity, is addressed appropriately.

The main elements of concerns are outlined here and further elaborated in the specific comments from the reviewers.

1) The analysis should provide clear evidence that the reduction in frequency variability is in fact real and that the animal is refining its behavior. The authors need to demonstrate that the behavior is indeed refined and that the variance will decrease not just because the duration of presses decreases or that the number of presses in each sequence is very small in the first sessions.

First of all we would like to apologize if some of the points raised were not clear in the previous version. We had indeed checked that variability in sequence frequency was orthogonal to variability in duration and length of the sequences. However, variability in duration and length (number of presses) was very correlated which may have caused some confusion. In order to simplify and better clarify the behavioral refinement observed we have modified the current version of the manuscript to compare only two main features of behavior that are orthogonal and independently modulated (frequency and duration).

As depicted in the plots in Figure 2–figure supplement 1 (each dot represents one session of each animal, with darker dots corresponding to later sessions), there is no significant correlation between the variability of sequence frequency and variability in sequence duration (measured both by the variance and Fano factor). By contrast, variability of sequence duration is highly correlated and dependent on the variability of number of presses of each session. This observation supports the idea that the behavioral dynamics and modulations observed are independent for the two dimensions described throughout the manuscript (Frequency and Duration). The same lack of correlation happens between variability in the number of presses and the frequency of pressing, as we had indicated in the previous version of the manuscript.

Furthermore, we have performed analyses in sequences with matched behavioral features (see Figure 5 of the current version of the manuscript). Finally, we ran a new control task to demonstrate that the decrease in variability in frequency is because frequency is outcome relevant and not only because the number of press in the sequences changes with learning.

It also should be clear that the effect is not just the out of sequence presses that decrease rather than the in sequence that increase.

We are sorry for the confusion but all analyses presented in the previous version of the manuscript exclude out of sequence presses (with the exception of the analyses in Figure 1B and Figure 1–figure supplement 1A, C-D, that were used to determine the thresholds for sequence criteria). So to be clear, all behavioral and neuronal measurements are done in lever-presses that are part of a sequence of two or more presses. Also, to further clarify, as depicted in Figure 1C, the percentage of lever-presses that is within a sequence very rapidly reach values close to 100%.

For analysis of the neuron data is should be clear that on what segment the firing rate is measured. If the firing rate is measured on the entire duration of the pressing sequence then it is liable to the same criticism as pointed out above. Namely, measuring the firing rate in longer time windows will have smaller variance.

Firing rate was measured on the entire duration of the sequence for all the analyses presented in the manuscript. It is pointed out that this could lead to changes in variance that could be dependent on the duration of the sequences. To control for this, we also measured firing rate in 200ms bins shifted by 1ms. The results from measuring the firing rate and Fano factor in fixed width bins (Author response image 1) were no different from the measurement on the entire duration of the sequence, hence pointing to the fact that the changes in variance observed were not dependent on sequence duration.

Author response image 1.

Author response image 1.

DOI: http://dx.doi.org/10.7554/eLife.09423.021

Furthermore, there was no correlation between firing rate during sequence

performance and sequence duration, or variability in firing rate and variability in sequence duration.

2) The main part of the story rests on the claim that it is only variability in the outcome relevant aspect of the behavior that decreases with learning. This is in contrast to variability in sequence length or duration, allegedly outcome-irrelevant aspects. Yet the data suggest that longer sequences improve task-performance and that the mice increase them with learning. Thus length/duration seems to be outcome relevant, despite the experimental protocol not explicitly rewarding on these features.

This point needs to be substantiated with further analysis to show an outcome-relevant specificity. It will be important to discuss why behaviors under FR3/0.66s protocol in this study and FR4/0.5s protocol in earlier study give rise to very different behavioral patterns. The authors should include a re-analysis of the FR4/FR8 behavioral results in this paper to show that, under slightly different operant requirements, mice can selectively reduce the variability of press length instead of press frequency.

We would like to first clarify that variability in number of presses or sequence duration was not different between reinforced and non-reinforced sequences (see Figure 3). We took the advice of the reviewers seriously and to further test the hypothesis that features are refined based on the relevance to the outcome of the task we ran a second experiment (Control task) were mice were reinforced if they performed a sequence of exactly 4 presses (3 IPIs), irrespectively of the frequency. In contrast with the results observed for the frequency task, in which the Fano factor for frequency decreased and for duration increased, in this control task variability of sequence frequency (which is not a relevant feature) increases with training, while variability of sequence duration decreases with training (see Figure 2).

This supports the view that, in similar tasks, slight changes in the requirements to achieve reinforcement can lead to opposite modulation of the variability of behavioral features dependent on their relevance for obtaining an outcome.

(Note: in the previous task mentioned, FR4/0.5s variability – measured as cv

– also decreased for frequency/IPIs, as shown in that study. Therefore the new task ran here is a more appropriate control for the questions raised by the reviewers).

They should directly test the simple possibility that M1/DS activity linearly encode press frequency (for example average press frequency of a sequence; or max frequency of a sequence; or instantaneous frequency associated with each press) using correlation analysis. If such is the case, the authors should quantify the overlap between sequence-related neurons and press-related neurons, and see if the two populations show more overlap over training blocks. Alternatively, the absence of significant correlation would suggest that M1/DS activity is coding for properties related to press frequency in non-linear ways, and FF correlation is a novel approach to reveal this hidden relationship.

We had done this but it was probably buried in the complexity of the manuscript. We tested the possibility that neuronal activity can encode sequence frequency (or duration) by studying the correlation between firing rate and the behavior features. As shown in Figure 6–figure supplement 1, there was no significant correlation between the firing rate and any of the measured features of behavior. As suggested by the reviewer, this excludes the simple explanation that firing rate in these structures is largely encoding simple kinematic parameters, and points to the hypothesis that cortico-striatal activity might be coding for outcome-relevant features in non-linear ways.

As additional controls to establish the specificity of the observed FF correlation, the authors should (1) clearly indicate whether this analysis involve all neurons, or only sequence-related neurons.

All analyses presented in the manuscript include all the neurons recorded in each session.

(2) Indicate what the time window used to calculate average firing rate within a press,

Firing rate was calculated using the time window of each sequence, but as clarified above, we have controlled this by using a 200ms window shifted by 1ms, which lead to comparable results.

(3) Provide a correlation analysis done on a per-neuron basis.

Besides the correlations done with the average Fano factor for the neuronal data (Figure 6), we have also calculated the correlations between behavioral variability and neuronal variability on a per-neuron basis (see Author response image 2). Despite the overall comparable results these results should be interpreted with care since skewed distributions of correlation coefficients can lead to biases in statistics (Corey, David M, Dunlap, William P, Burke, Michael J, Journal of General Psychology, Vol 125(3), Jul 1998, 245-262). Therefore we prefer to present the results in the manuscript per animal (and mention just in the text).

Author response image 2.

Author response image 2.

DOI: http://dx.doi.org/10.7554/eLife.09423.022

(4) Indicate if lever-press related neurons show the same correlation, as well as what happen to other task-unrelated M1/DS neurons.

This is a good point that we should have clarified. Comparable correlations between neuronal variability and behavior variability were observed when dividing the data between task-related and non-task related neurons (Author response image 3). Due to the absence of a specific effect between conditions and groups of neurons, all the analyses used in the manuscript include all neurons recorded, regardless of the firing rate modulations during sequence performance. But we now mention in the manuscript that the results are comparable between task-related and non-task related neurons.

Author response image 3.

Author response image 3.

DOI: http://dx.doi.org/10.7554/eLife.09423.023

3) The number of animals in Figure 7 seems very small, there are no error bars and the effects seem to be governed, in some cases by 1-2 animals. The authors should demonstrate that the main result is not due to these animals only.

We believe that it is dangerous to assume by eye that statistical effects are dominated by a few animals. If distributions are not significantly different it still may happen that some data points look different every time we sample the population, and vice-versa. What we try to assess is if the distributions that those samples came from are different or not. Therefore, we did a bootstrapping analysis for all the comparisons in Figure 7 (see Figure 7–figure supplement 1), performing 100.000 random samples of our data (with replacement). These bootstrap analyses confirmed the effects already described by the post hoc tests. Furthermore, we have now introduced error bars in Figure 7 (error bars depict standard error of the mean, albeit in the case of paired comparisons they are not indicative of the variability in the comparison).

[Editors' note: the author responses to the re-review follow.]

[…] The manuscript is a resubmission. There were several concerns whether the main claims of the manuscript as submitted before were supported by the data as presented. In particular further evidence to support that outcome specificity was restricted to press frequency was requested. The authors have provided new analysis and a set of new experiments to meet these concerns. However, while the reviewers agree that the study has improved after revision the issue of outcome-specificity is still not resolved. Given the paper's focus, this is a major issue that must be addressed. After extensive discussion among reviewers, and editors there is an agreement that the task as presented does not isolate frequency as the only causal dimension in the task. The fact that reward is dispensed based on frequency does not preclude other relevant behavioral parameters, even if those are orthogonal to, or uncorrelated with, sequence frequency. In fact, both sequence frequency and duration are modulated by learning. Success on the task is therefore likely to also depend on duration since it is coupled to sequence length. Therefore, the task does not isolate frequency as the only task-relevant parameter, and the dichotomy between task-relevant (frequency) and task-irrelevant (duration) parameters does not hold. Hence it cannot be claimed that learning is only tuning frequency as the outcome-relevant parameter. Duration is relevant by default in reward accumulation tasks. This may not be reflected in the tuning of neuronal firing patterns while frequency may in this task. This distinction may be interesting but is not spelled out in the manuscript. Careful wording is needed to clarify this and to discuss how the two outcome-relevant parameters that are being compared, sequence frequency and duration, differ. This is important because the difference in the neural correlates of these task aspects, and how they change with learning, is not due to one being task-relevant and the other not, but rather to these being qualitatively different aspects of the task. As the text is now this is not the message the reader will be left with. Thus the dimension along which the two task-relevant parameters differ should be discussed, and an attempt to generalize the results beyond this task should be made. The authors must revise their statements carefully to reflect this and explicitly explain the confounding factor introduced by press duration. This new message should also be reflected in the title and in a more nuanced description in the Abstract, and Introduction of the outcome relevant concept as well as in an expanded discussion of these issues.

We sincerely apologize for the misunderstandings that our use of outcome- relevant variability introduced. We believe that these are misunderstandings and do not affect the main message of the paper. So we carefully revised the manuscript as suggested, and abandoned the outcome-relevant/outcome- irrelevant nomenclature to refer to the different behavior dimensions. We now say that animals trained in a task to perform progressively faster sequences of lever presses reduced variability of sequence frequency but increased variability in an orthogonal domain (sequence duration as training progressed, variability in corticostriatal activity decreased and became progressively more correlated with behavioral variability, but only for sequence frequency. Corticostriatal plasticity was required for the reduction in frequency variability, but not for variability in sequence duration. We believe that these statements are not controversial.

We understand how some of the reviewers may find that duration is task- relevant, as any sequence of presses requires a minimum duration. What we meant to say is that, in our task, trial-to trial variability in frequency changes the probability of animals getting reinforcement, while trial-to-trial variability in sequence duration (which is orthogonal to frequency) does not affect the probability of getting a reinforcement. For the range of variability in duration observed in the task presented, there is no difference in variability between reinforced and non-reinforced trials; meaning that reinforced trials have the same variance/variability in duration as non-reinforced trials (and actually no difference in duration per se) (Figure 3). In contrast, reinforced trials do have much lower variability in frequency than non-reinforced trials (Figure 3). It is therefore plausible that animals reduced the variability in the domain that changed the probability of reinforcement. Therefore, in order to clarify this message and our claims, we have carefully revised and altered the title, Abstract and main text of the manuscript.

A number of other issues were also raised by the reviewers, as outlined below in the detailed report. In particular whether animals know that they are rewarded (see review #2). An analysis based on behavioral data should clarify whether the mice indeed learn to anticipate reward. If so this is also a task-relevant parameter that is learned by the animals.

We apologize for not having introduced this before but we thought we just had to address the comments in the summary. In order to clarify this point, we present additional analyses on the behavioral data (See Author response image 4 and Figure 1). We have calculated both the probability of a reinforcement preceding a magazine check for individual sessions (see Author response image 4, left plot), and the percentage of magazine checks that follow reinforced lever presses vs. non-reinforced lever presses for all the training data (see Author response image 4, right plot). The probability of a magazine check after a reinforced lever-press was rather low (∼0.25) and did not change from early to late sessions (Post hoc comparison: t144=1.184, p=0.283, Figure 1E, right) and the percentage of magazine checks following reinforced presses was significantly lower than for non-reinforced presses (t19=12.10, p<0.0001, Figure 1E, right).

Author response image 4.

Author response image 4.

DOI: http://dx.doi.org/10.7554/eLife.09423.024

Both these analysis provide support to the idea that reinforcement delivery does not provide an external cue that could be used by the animals to anticipate a reward.

Furthermore, as requested by the reviewers we further show no correlation between sequence frequency and sequence duration per se (Figure 2–figure supplement 1), and a strong correlation between sequence frequency and sequence length (showing that duration and length are not orthogonal).

[Editors' note: further revisions were requested prior to acceptance, as described below.]

Three main issues still need to be considered:

You were asked to acknowledge that both features you look at (frequency and duration) are outcome-relevant. You have done this only in part. The Discussion mostly uses the old and misleading narrative. This should be remedied.

You were asked to parse the distinction between frequency and duration, and speculate as to why the neural firing patterns associated with these features evolve differently during learning. It was clearly stated that duration and frequency, though both outcome-relevant, are fundamentally different aspects of the task. This needs to be discussed. Frequency has to do with the action that is being reinforced while duration is a strategic decision. The fact that neuronal correlates associated with these fundamentally different processes evolve differently is perhaps not surprising. However, there is no discussion of these differences and what they mean in a form that allows one to generalize to other tasks and situations.

We have modified substantially the Discussion to incorporate these two points very clearly. We also changed sentences in the main text that could allude to the old narrative. We feel though that we must first clarify that we initially used the term outcome-relevant feature as a different term than what is usually meant as task-relevant; we used it to mean what the reviewers call the feature that was reinforced. Given the confusion that this has generated we have eliminated references to outcome-relevant in the text and just refer a couple of times to the more established concept of task-relevant feature when discussing the literature.

So now we mostly just refer to the features that were specifically reinforced and others that could be part of a strategy/effort minimization, and discussed it in the terms suggested by the reviewers.

As you can see in the new Discussion, we acknowledge that both features can be considered task-relevant, and further discuss why variability may decrease in one and increase in the other given their relation to reinforcement. We also discuss why the neural activity would correlate with one and not the other, and generalize to other tasks.

Finally, you were asked to demonstrate whether mice learn to anticipate the reward. You say in the text that you looked at the “probability of a magazine check after a reinforced lever-press” and found that this did not change with learning. In the figure and associated legend you say that you looked at the “Probability of a reinforcement preceding a magazine check” and show that this doesn't change. It is not clear whether these are the same metrics and how they are calculated and whether they allow one to infer anything about the animal's ability to anticipate reward. We advise that you simply show that the probability of checking the magazine does not depend on whether the preceding lever press was reinforced (i.e. the last one in a covert sequence) or not, and show that this is stable over the course of learning.

Again, we apologize for the misunderstanding. Because in many sequences there is no reinforcement (or successful covert pattern), we feel that we have to present both probabilities. So we present both the probability of checking the magazine after a successful covert sequence; and the probability of a magazine check being preceded by a successful covert sequence (because many sequences do not contain successful presses the two probabilities are not similar). This should clarify the issue that animals are not checking the magazine because they hear the reinforce-delivery device. Please see the following passage in the main text: “Importantly, reinforcement delivery did not provide an external cue that could be used by the animals to anticipate a reward […] and did not change from early to late sessions (Post hoc comparison: t144=1.184, p=0.283, Figure 1E, bottom right)”.


Articles from eLife are provided here courtesy of eLife Sciences Publications, Ltd

RESOURCES