

Abstract
We aimed to determine the frequency of new microbleeds after intravenous thrombolysis using contiguous thin-slice 3T magnetic resonance imaging. We retrospectively examined clinical and imaging data from 121 consecutive acute ischemic stroke patients who underwent magnetic resonance imaging before and 24 hours after intravenous thrombolysis. Of the included patients, 44 (36.4%) were women, with a median age of 69 years (range, 35–94 years). A total of 363 baseline microbleeds were observed in 57 patients and 8 new microbleeds in 6 patients. Multiple regression analysis indicated that baseline infarct volume (odds ratio, 1.556/10 mL; 95% CI, 1.017–2.379; P = 0.04) and systolic blood pressure (odds ratio, 1.956/10 mm Hg; 95% CI, 1.056–3.622; P = 0.03), but not the presence of baseline microbleeds, were independently associated with new microbleeds. The frequency of neither symptomatic intracranial hemorrhage nor remote hemorrhage or any hemorrhagic transformation was different between patients with and without new microbleeds (0.0% vs 1.7%, P > 0.99; 0.0% vs 1.7%, P > 0.99; 50.0% vs 28.7%, P =0.36). New microbleeds developed rapidly 24 hours after intravenous thrombolysis. The significance of these new microbleeds and their effect on cognitive and functional outcome merits further investigation.
INTRODUCTION
Cerebral microbleeds (CMBs), defined as small, rounded or circular, and hypointense lesions within brain parenchyma with clear margins on gradient-recalled echo (GRE) scans,1 are commonly detected in elderly individuals2 and patients with cerebrovascular diseases.3 Focal accumulation of hemosiderin-containing macrophages was noted in areas with signal loss on magnetic resonance imaging (MRI).4
CMBs might be a potential risk factor for intracranial hemorrhage (ICH) after ischemic stroke,5 or after thrombolysis.6,7 Generally, CMBs have been considered to be old microhemorrhages that develop over an individual’s lifetime,4 but recent studies indicated that CMBs might develop rapidly after acute ischemic stroke8 or after tissue-type plasminogen activator infusion.9 It is increasingly known that the presence, number, and size of CMBs may vary substantially with the parameters of GRE. Longer echo time (TE) (range, 25–50 ms), higher spatial resolution (3-dimensional [3D] Fourier transform technique, thinner scanning sections, and no interslice gap), and increased field strength can increase the sensitivity of CMBs detection.1 However, the GRE sequences used in these 2 studies had a relatively greater slice thickness (5-mm and 6-mm) and interslice gap (2-mm and 1-mm) and were performed on 1.5T MRI.8,9 We therefore deemed it worthy to detect the CMBs with a contiguous, thin-slice, and 3D multiecho GRE sequence performed with a 3T MRI unit. Based on such measurements, this study aims to delve into the variations in GRE characteristics and their influence on detecting new CMBs, and investigate the independent risk factors of new CMBs and the relationship between new CMBs and ICH after thrombolysis.
MATERIALS AND METHODS
Study Subjects
We retrospectively reviewed our prospectively collected database for consecutive patients with acute ischemic stroke who received thrombolytic therapy between June 2009 and September 2013. We then enrolled patients who had a diagnosis of acute ischemic stroke confirmed by diffusion-weighted imaging (DWI), received intravenous recombinant tissue-type plasminogen activator (rtPA) within 6 hours of symptom onset, underwent GRE sequence before rtPA infusion, and underwent follow-up GRE sequence 24 hours after rtPA infusion. The onset was considered to be the time when a patient was last known to be without ischemic symptoms. We excluded patients whose image quality was poor because of motion artifacts. No patient received antithrombotic agents within 24 hours after rtPA infusion.
We retrieved demographic, clinical, laboratory, and imaging data including age and sex; comorbid conditions such as history of hypertension, diabetes mellitus, hyperlipidemia, atrial fibrillation, and hyperhomocysteinemia; previous use of aspirin and warfarin; time interval from stroke onset to rtPA infusion; National Institutes of Health Stroke Scale (NIHSS) score,10 systolic blood pressure (SBP), diastolic blood pressure (DBP), serum glucose, serum creatinine, platelet and international normalized ratio (INR) before rtPA infusion; infarct volume before rtPA infusion, leukoaraiosis volume, presence of baseline and new CMBs, number of baseline and new CMBs, hemorrhagic transformation 24 hours after rtPA infusion, and modified Rankin Scale (mRS) score after 3 months.11 The follow-up MRI was done before any subject was started on antithrombotic therapy.
Ethics Statement
All subjects conducting the research project in this manuscript had given written informed consent prior to the study and the protocols of MRI-guided intravenous thrombolysis had been approved by the human ethics committee of the Second Affiliated Hospital of Zhejiang University School of Medicine.
MRI Parameters
All subjects underwent MRI on a 3.0T system (Signa Excite HD; General Electric Medical System, Milwaukee, WI). The 3D multiecho GRE sequence covered the whole brain and used 11 equally spaced echoes: TE = 4.5 ms (first echo), interecho spacing = 4.5 ms, repetition time (TR) = 58 ms, field of view (FOV) = 24 × 24 cm2, matrix size = 256 × 256, flip angle = 20°, slice thickness = 2.0 mm with no gap between slices, and in-plane spatial resolution of 0.4688 × 0.4688 mm/pixel. Magnitude images were acquired. Axial T2 fluid-attenuated inversion recovery sequence was used to measure the leukoaraiosis volume (TR = 10,000 ms, TE = 150 ms, FOV = 24 × 24 cm2, matrix size = 256 × 256, inversion time = 2500 ms, slice thickness = 5.0 mm with no gap between slices, and in-plane spatial resolution of 0.4688 × 0.4688 mm/pixel). DWI sequence was used to measure the infarct volume before rtPA infusion (TR = 4000 ms, TE = 69.3 ms, b-value = 1000 s/mm2 with 3 acquired diffusion directions, FOV = 24 × 24 cm2, matrix size = 160 × 160, slice thickness = 5.0 mm, interslice gap = 1.0 mm, and in-plane spatial resolution of 0.9375 × 0.9375 mm/pixel); the segmentation threshold for infarct lesion was determined a priori as 3 standard deviations in pixel intensity above the mean of the fitted distribution of the contralateral brain parenchyma.
Detection Criteria of Baseline and New CMBs
We identified a CMB according to a field guide for the detection and interpretation of CMBs.1 Briefly, the signal of a CMB should be black or very hypointense on T2∗-weighted MRI, round or ovoid with a size of ≤10 mm, blooming, devoid of T1- or T2-weighted hyperintensity, and at least half-surrounded by brain parenchyma. Mineralization of the basal ganglia and diffuse axonal injury are excluded based on appearance or clinical history.
New CMBs were defined as CMBs that newly appeared on the follow-up GRE scans compared with the initial scans. We described the locations, counted the number of all CMBs on baseline and follow-up GRE scans independently, and then performed slice-to-slice comparison to determine whether the CMBs on follow-up GRE scans were new or unchanged. DWI was used to confirm that the new CMBs occurred outside the infarct area. Newly appearing CMBs in the acute infarct area were not regarded as new CMBs. CMBs that were questionably hypointense on the initial GRE scans but became conspicuous on the follow-up were not regarded as new CMBs. The locations of CMBs were classified as lobar, deep, or infratentorial.8
Evaluation of Outcome
Hemorrhagic transformation was classified by using clinical and imaging criteria as follows: hemorrhagic infarction (HI), parenchymal hemorrhage (PH), extraischemic hemorrhage, and symptomatic ICH (sICH). An ICH was defined as sICH if the patient had clinical deterioration causing an increase of NIHSS ≥4 points and if the hemorrhage was likely to be the cause of the clinical deterioration.12 An extraischemic hemorrhage was defined as the new appearance of hypointense lesions with a diameter of >10 mm outside the infarct area on follow-up GRE scans and at least 1 aspect didn’t meet the detection criteria of CMBs. Outcome was dichotomized into good clinical outcome (mRS, 0–2) or poor clinical outcome (mRS, 3–6) at 3 months.
Reliability and Validity of the Radiological Data
Two investigators blinded to the patients’ clinical data jointly evaluated the MRI findings. A trained observer (S.Y.) evaluated the images of all patients twice, at an interval of 3 months. Another observer (M.L.) independently made the same evaluation. The interobserver intraclass correlation coefficients (ICCs) were 0.96 and 0.95 for the number of baseline and new CMBs, respectively. The intraobserver ICCs were 0.93 and 0.94 for the number of baseline and new CMBs, respectively. ICCs were described in detail elsewhere.13 The interobserver and intraobserver reliabilities about the presence of CMBs (≥1) were also acceptable (κ value = 0.86 and 0.81, respectively). Discrepancies were resolved by consensus.
Statistical Analysis
Fisher exact test was used to compare the dichotomous variables between groups, whereas independent samples of 2-tailed t test or Mann–Whitney U test was used for continuous variables. Variables with a P < 0.10 in univariate regression analyses were included in the binary logistic regression model, whereas NIHSS score before rtPA infusion, time from onset to treatment, previous use of aspirin or warfarin, infarct volume before rtPA infusion, which were thought to be potential factors associated with ICH after intravenous thrombolysis, and age, hyperhomocysteinemia, presence of baseline CMBs, leukoaraiosis volume, which were thought to be associated with small vessel disease, were forced into the model. Hosmer–Lemeshow test was used to evaluate the difference between observed and predicted event rates in the binary logistic regression model. Statistical significance was set at a probability value of <0.05. All statistical analysis was performed with SPSS package (14.0 for Windows; SPSS Inc, Chicago, IL).
RESULTS
A total of 167 consecutive patients with acute ischemic stroke received MRI-guided intravenous thrombolysis during the study period. Among them, 39 did not undergo follow-up MRI 24 hours after treatment, MRI quality was poor for analysis in 4, and 3 had hypointense lesion on GRE scans with suspicious cavernous malformations, which might affect CMBs evaluation. A total of 121 remaining patients were included for the final analysis. Demographic, clinical, and laboratory data were not different between included and excluded subjects, except that baseline NIHSS score was higher in excluded patients (13.3 ± 6.7 vs 9.5 ± 5.9), mainly because some severe stroke patients were transferred to intensive care unit or received surgical treatment, resulting in failure of follow-up GRE scans. Of the included patients, 44 (36.4%) were women, with a median age of 69 years (mean, 67.26 ± 12.53 years; range, 35–94 years).
On initial GRE scans, we observed 363 CMBs in 57 patients (47.1%). The median number of baseline CMBs was 2 (range, 1–65). On follow-up GRE scans 24 hours after treatment, 8 new CMBs in 6 patients (5.0%) were observed. The median number of new CMBs among these patients was 1 (range, 1–2). None of the baseline CMBs disappeared on follow-up GRE scans. New CMBs were found in 5 (7.8%) of 64 patients without baseline CMBs, 0 (0.0%) of 36 patients with baseline CMBs of 1 to 2, and 1 (4.8%) of 21 patients with microbleeds of >2 (Fisher exact test, P = 0.25).
There were 133 (36.6%) baseline CMBs in a lobar location, 178 (49.0%) in a deep location, and 52 (14.3%) in an infratentorial location. For the 8 new CMBs, 4 (50.0%) were lobar, 2 (25.0%) were deep, 2 (25.0%) were infratentorial, and 6 new CMBs were located in the ipsilateral hemisphere of infarction, whereas 2 were in the contralateral hemisphere. Among 57 patients with baseline CMBs, 13 had lobar CMBs, 15 had deep CMBs, 1 had infratentorial CMBs, 14 had lobar and deep CMBs, 2 had lobar and infratentorial CMBs, 1 had deep and infratentorial CMBs, and 11 had lobar, deep, and infratentorial CMBs. In addition, 11 patients had multiple baseline CMBs (>2) in the lobar location.
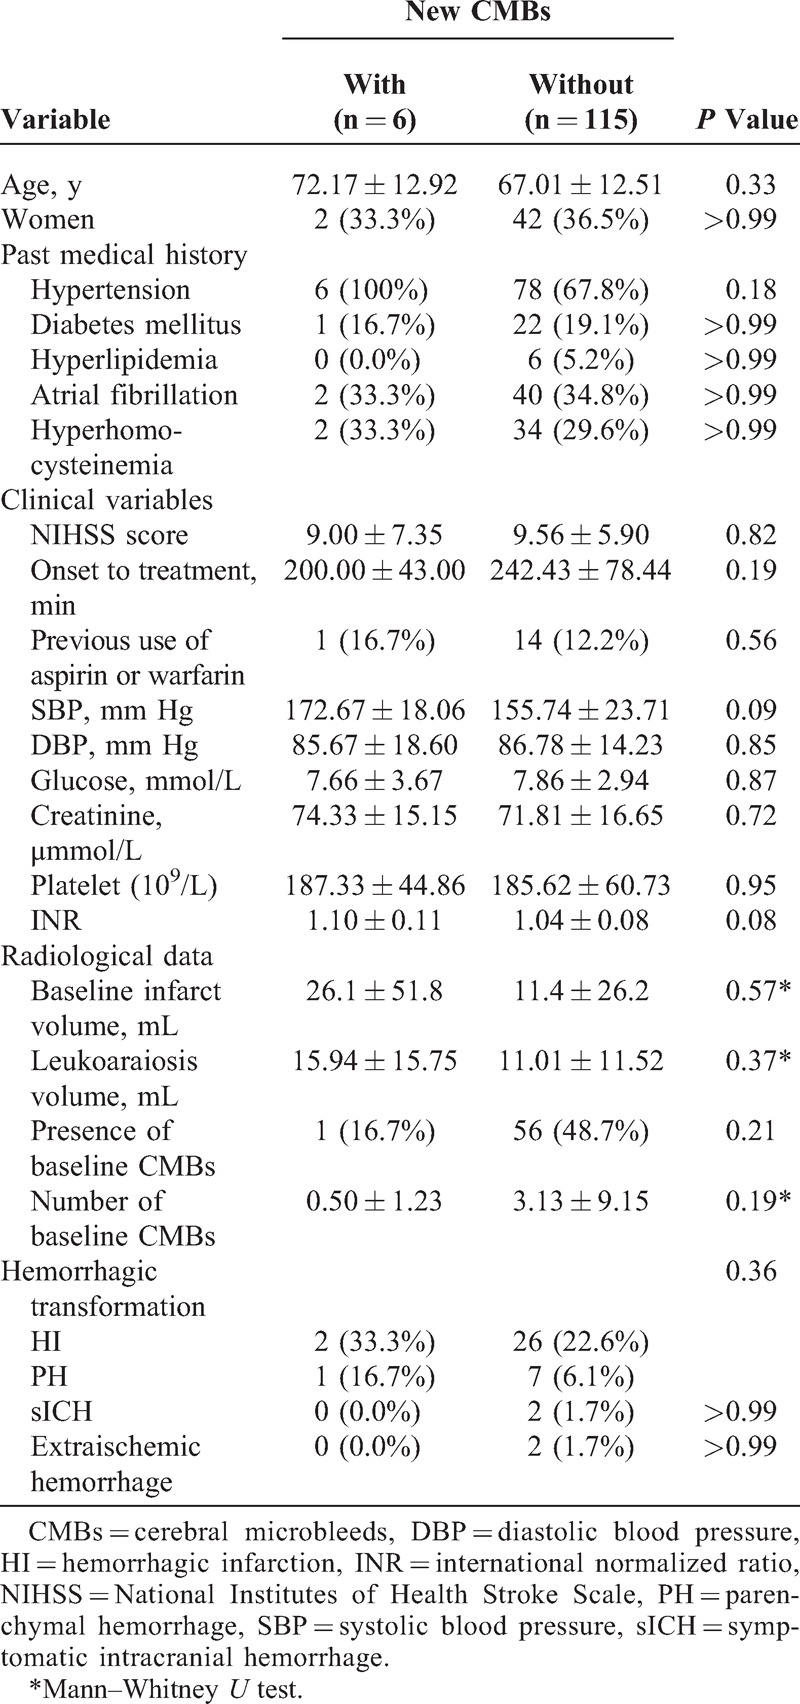
Table 1 shows the characteristics of patients with and without new CMBs for comparison. There were no significant differences in the risk factors between patients with and without new CMBs in univariate analysis. Only increased SBP and INR were marginally associated with new CMBs. Patients with baseline CMBs didn’t have more new CMBs than those without baseline CMBs (1.8% vs 7.8%, P = 0.21).
TABLE 1.
Univariate Comparison of Characteristics Between Patients With and Without New CMBs
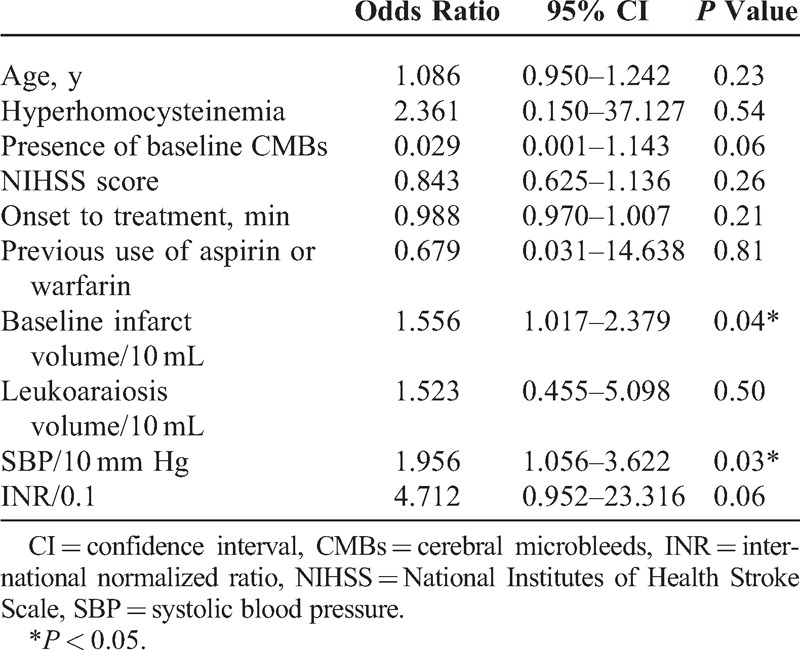
Age, hyperhomocysteinemia, the presence of baseline CMBs, baseline NIHSS, time from onset to treatment, previous use of aspirin or warfarin, baseline infarct volume and leukoaraiosis volume, SBP, and INR were included in the binary logistic regression model. Baseline DWI infarct volume and SBP were the independent factors associated with new CMBs (Table 2). The Hosmer–Lemeshow test showed no significant difference (P = 0.99) between observed and predicted event rates.
TABLE 2.
Multivariate Logistic Regression Analysis of Risk Factors for New CMBs
Follow-up GRE scans 24 hours after treatment revealed hemorrhagic transformation in 36 (29.8%, 28 were HI and 8 were PH) patients, and sICH was observed in 2 (1.7%) patients. Two (1.7%) patients had remote hemorrhage, one of which had sICH. The frequency of sICH (0.0% vs 1.7%, P > 0.99) or remote hemorrhage (0.0% vs 1.7%, P > 0.99) or any hemorrhagic transformation (50.0% vs 28.7%, P = 0.36) was not different between patients with and without new CMBs. Patients with baseline multiple lobar CMBs (>2) also did not reveal higher risk of sICH (0.0% vs 1.8%, P > 0.99), remote hemorrhage (0.0% vs 1.8%, P > 0.99), or any hemorrhagic transformation (9.1% vs 31.8%, P = 0.17). The presence of new CMBs was not associated with poor clinical outcome after adjusting for baseline NIHSS score and age in the binary logistic regression model (odds ratio, 0.557; 95% CI, 0.072–4.286; P = 0.57).
DISCUSSION
In the current study, we found that new CMBs developed rapidly in 5.0% of acute ischemic stroke patients received intravenous thrombolysis. However, the occurrence of new CMBs was not independently related with the presence of baseline CMBs, and patients with new CMBs did not experience more hemorrhagic transformation than those without new CMBs.
Generally, CMBs are regarded as old microhemorrhage and follow a slow process of development because histopathological analysis shows that CMBs consist of hemosiderin accumulations from red blood cells that presumably have leaked out of small vessels.4 However, a recent systematic review report stated that 12.9% of CMBs contained erythrocytes rather than hemosiderin, which indicated that not all CMBs are chronic in nature.14 Indeed, Jeon et al8 reported that 12.7% of acute ischemic stroke patients developed new CMBs within 1 week of stroke onset, whereas Kimura et al9 reported that 4.9% of acute ischemic stroke patients developed new CMBs 24 hours after rtPA infusion. Our results are similar to the findings of Kimura et al9 and confirm that CMBs could occur in the acute stage of ischemic stroke.
However, our findings did not repeat the previous findings that the presence of CMBs before rtPA therapy was associated with new CMBs. When we reviewed and compared the parameters of GRE scans in different studies (Table 3), including field strength, echo time, slice thickness, and interslice gap, we found that new CMBs may be misidentified even though slice-to-slice comparison between initial and follow-up GRE scans was done. Usually, CMB detection depends on lesion size, slice thickness, lesion position relative to slice, thickness of gap between slices, and inherent contrast between lesion and background.15 Image co-registration is not reliable with a relatively greater slice thickness and an interslice gap. As shown in Figure 1, if there is an interslice gap in the GRE protocol, the unchanged CMBs may be undetected or misidentified as “new” or “disappeared” CMBs because of even a minor head motion. The images of our patient with initial and follow-up GRE scans presented in Figure 2 further confirm this misidentification. Thus, the misidentified “new” CMBs would only appear in the patients with baseline CMBs, which leads to the bias that more “new” CMBs occurred in the patients with the presence of CMBs. Similarly, this reason could also explain the phenomenon that 8 baseline CMBs in 7 patients were disappeared on follow-up GRE scans in the study by Jeon et al.8 Furthermore, radiological size of the missed CMBs might be larger than the thickness of interslice gap (such as 1- or 2-mm) because of the so-called “blooming” effect.1 Therefore, a contiguous thin-slice imaging study is particularly important in determining whether a CMB is new or not. Our study, the first to use contiguous 2-mm slice-to-slice comparison to detect CMBs, confirms that the presence of baseline CMBs is not a predictor for the development of new CMBs after thrombolytic therapy.
TABLE 3.
Clinical Studies Investigating New CMBs in Acute Ischemic Stroke Patients
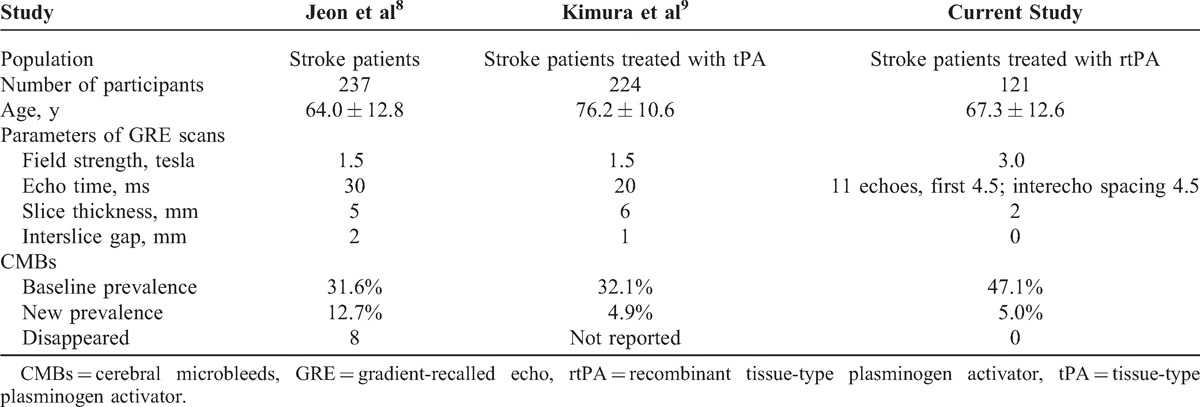
FIGURE 1.
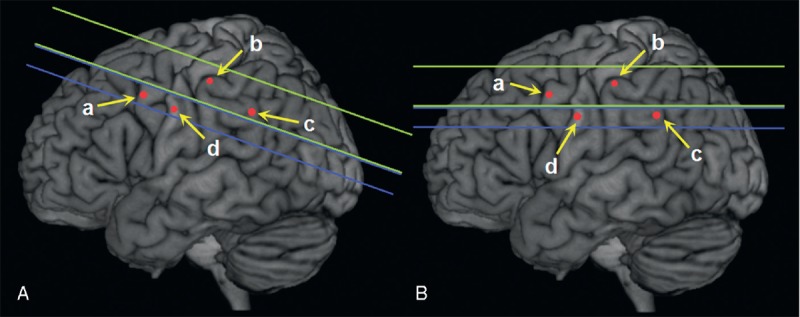
Theoretical illustration of new CMB detection. (a), (b), (c), and (d) represent unchanged CMBs on the initial (A) and follow-up (B) GRE scans. The space between green lines is scan slice, and blue is interslice gap. Therefore, (b) and (c) are observed on initial scans, and (a) and (b) are observed on follow-up scans. At last (a), (b), (c), and (d) are identified as “new” CMB, unchanged CMB, “disappeared” CMB, and undetected CMB, respectively. CMB = cerebral microbleed, GRE = gradient-recalled echo.
FIGURE 2.
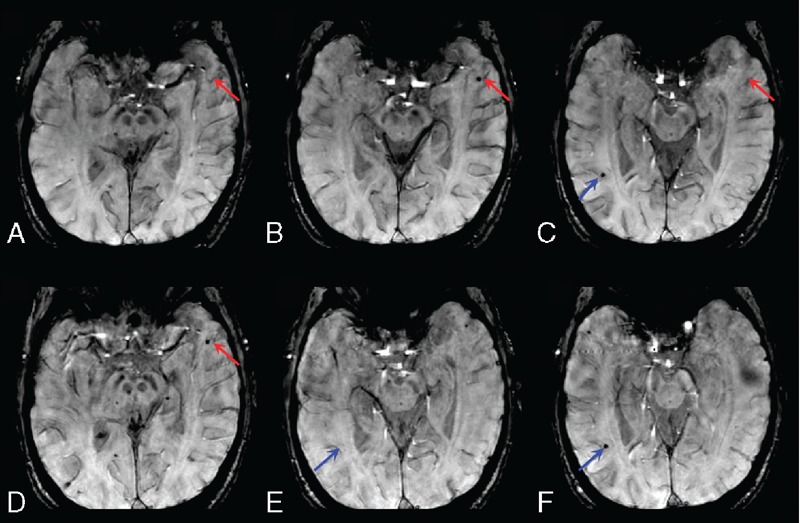
Initial and follow-up GRE scans of an acute ischemic stroke patient. (A), (B), and (C) were the 28th, 29th, and 30th slice before rtPA infusion, respectively. (D), (E), and (F) were the 28th, 30th, and 31st slice 24 hours after rtPA infusion, respectively. A “new” CMB shown in slice-to-slice comparison between (A) and (D) (the 28th slice, red arrow) could be observed on the 29th but not the 30th slice of the initial GRE scans. If (B) (the 29th slice) was in an interslice gap, the CMB in red arrow would be misidentified as “new” CMB; a “disappeared” CMB showed in slice-to-slice comparison between (C) and (E) (the 30th slice, blue arrow) could be observed on the 31st slice of the follow-up GRE scans. If (F) the 31st slice was in an interslice gap, the CMB in blue arrow would be misidentified as “disappeared” CMB. CMB = cerebral microbleed, GRE = gradient-recalled echo, rtPA = recombinant tissue-type plasminogen activator.
We found that large baseline DWI infarct volume and high SBP were the independent factors associated with new CMBs. The cellular mechanism that underlies the formation of new CMBs remains to be elucidated. It is suggested that CMBs result from 2 main pathogenic mechanisms: leakage from damaged vessels in cerebral small vessel diseases associated with hypertension and other cerebrovascular risk factors, or from vessels damaged by vascular amyloid deposition. “New” CMBs have been reported to occur in 38% of patients with cerebral amyloid angiopathy and previous lobar hemorrhage during the 1.5-year follow-up period16 and in 30% of hypertensive patients with ICH after a median period of 23 months.17 New CMBs appearing within 24 hours after rtPA treatment would be fresh. Hence, the presence of large DWI infarct volume in the acute ischemic stage may precipitate abnormal permeability of the arteriolar blood–brain barrier leading to extravasation of blood components, providing a possible explanation for its association with the formation of new CMBs. Previous studies showed blood pressure elevation was associated with hemorrhagic transformation in patients with rtPA therapy. The arterioles are vulnerable to the effects of high blood pressure, resulting in damage to the smooth muscle cells and microbleeding. Thus, blood pressure lowering treatment during rtPA infusion should be important to reduce the occurrence of new CMBs.
It has been questioned whether the presence of microbleeds is a risk factor for sICH after tPA therapy. However, it was underpowered to detect the relationship between CMBs and sICH in our study due to the small number of sICH patients. We did not find the difference between patients with and without new CMBs in the frequency of hemorrhagic transformation both in the infarct and extraischemic area, which is inconsistent with the previous finding that extraischemic hemorrhage was associated with new CMBs.9 Indeed, it was difficult to discriminate new CMBs from extraischemic hemorrhage sometimes. Microbleeds and macrobleeds may fall in a naturally bimodal size distribution that does not strongly depend on the precise cut point chosen to differentiate them. The size of a CMB is relatively less important for correctly categorizing lesions because it depends on imaging parameters on MRI.1 Furthermore, the presence of new CMBs may have little clinical implication in the prevention of hemorrhagic transformation after thrombolysis, considering that new CMBs and hemorrhagic transformation are both detected on follow-up imaging scans.
The present study had limitations. First, our study had a retrospective design and might have a potential risk of selection bias. Some severe stroke patients might transfer to intensive care unit or receive surgical treatment next day so that they were unable to undergo follow-up GRE scans, leading to the small sample of patients with sICH. Second, some new CMBs outside the infarct area might be covered by remote hemorrhage. This limitation made it more difficult to detect new CMBs and investigate the relationship between new CMBs and postthrombolytic hemorrhage. Third, interslice gap has been used sometimes to minimize interference from adjacent slices (“cross-talk”), which is a cause of reduced signal intensity, so we used a 3.0 tesla field strength magnet to provide a high signal-to-noise ratio and high spectral resolution, in order to minimize this limitation.18 Fourth, we did not perform follow-up computed tomography (CT) scans, which might discriminate new CMBs from tiny remote hemorrhage after rtPA infusion.
In summary, we found that new CMBs developed in 5% of thrombolytic patients. The baseline DWI infarct volume and SBP, but not the presence of baseline CMBs, were independent factors associated with new CMBs. We highlight the effect of variation in slice thickness and interslice gap on new CMB detection. It is still uncertain whether the new CMBs are caused by thrombolysis or just ischemic stroke. The significance of these new CMBs and their effect on cognitive and functional outcome requires further investigations.
Footnotes
Abbreviations: CMB = cerebral microbleed, DWI = diffusion-weighted imaging, GRE = gradient-recalled echo, HI = hemorrhagic infarction, NIHSS = National Institutes of Health Stroke Scale, PH = parenchymal hemorrhage, rtPA = recombinant tissue-type plasminogen activator, sICH = symptomatic intracranial hemorrhage.
This work was supported by the Science Technology Department of Zhejiang Province (2013C13G2010032, 2012C23088, and 2014C33186), Zhejiang Provincial Natural Science Foundation of China (LR12H09001), and National Natural Science Foundation of China (81,171,095).
The authors have no conflicts of interest to disclose.
References
- 1.Greenberg SM, Vernooij MW, Cordonnier C, et al. Cerebral microbleeds: a guide to detection and interpretation. Lancet Neurol. 2009;8:165–174. [DOI] [PMC free article] [PubMed] [Google Scholar]
- 2.Vernooij MW, van der Lugt A, Ikram MA, et al. Prevalence and risk factors of cerebral microbleeds: the Rotterdam Scan Study. Neurology. 2008;70:1208–1214. [DOI] [PubMed] [Google Scholar]
- 3.Werring DJ, Coward LJ, Losseff NA, et al. Cerebral microbleeds are common in ischemic stroke but rare in TIA. Neurology. 2005;65:1914–1918. [DOI] [PubMed] [Google Scholar]
- 4.Fazekas F, Kleinert R, Roob G, et al. Histopathologic analysis of foci of signal loss on gradient-echo T2∗-weighted MR images in patients with spontaneous intracerebral hemorrhage: evidence of microangiopathy-related microbleeds. AJNR Am J Neuroradiol. 1999;20:637–642. [PMC free article] [PubMed] [Google Scholar]
- 5.Fan YH, Zhang L, Lam WW, et al. Cerebral microbleeds as a risk factor for subsequent intracerebral hemorrhages among patients with acute ischemic stroke. Stroke. 2003;34:2459–2462. [DOI] [PubMed] [Google Scholar]
- 6.Shoamanesh A, Kwok CS, Lim PA, et al. Postthrombolysis intracranial hemorrhage risk of cerebral microbleeds in acute stroke patients: a systematic review and meta-analysis. Int J Stroke. 2013;8:348–356. [DOI] [PMC free article] [PubMed] [Google Scholar]
- 7.Charidimou A, Kakar P, Fox Z, et al. Cerebral microbleeds and the risk of intracerebral haemorrhage after thrombolysis for acute ischaemic stroke: systematic review and meta-analysis. J Neurol Neurosurg Psychiatry. 2013;84:277–280. [DOI] [PMC free article] [PubMed] [Google Scholar]
- 8.Jeon SB, Kwon SU, Cho AH, et al. Rapid appearance of new cerebral microbleeds after acute ischemic stroke. Neurology. 2009;73:1638–1644. [DOI] [PubMed] [Google Scholar]
- 9.Kimura K, Aoki J, Shibazaki K, et al. New appearance of extraischemic microbleeds on T2∗-weighted magnetic resonance imaging 24 hours after tissue-type plasminogen activator administration. Stroke. 2013;44:2776–2781. [DOI] [PubMed] [Google Scholar]
- 10.Brott T, Adams HP, Jr, Olinger CP, et al. Measurements of acute cerebral infarction: a clinical examination scale. Stroke. 1989;20:864–870. [DOI] [PubMed] [Google Scholar]
- 11.van Swieten JC, Koudstaal PJ, Visser MC, et al. Interobserver agreement for the assessment of handicap in stroke patients. Stroke. 1988;19:604–607. [DOI] [PubMed] [Google Scholar]
- 12.Larrue V, von Kummer RR, Muller A, et al. Risk factors for severe hemorrhagic transformation in ischemic stroke patients treated with recombinant tissue plasminogen activator: a secondary analysis of the European-Australasian Acute Stroke Study (ECASS II). Stroke. 2001;32:438–441. [DOI] [PubMed] [Google Scholar]
- 13.Lee J, Koh D, Ong CN. Statistical evaluation of agreement between two methods for measuring a quantitative variable. Comput Biol Med. 1989;19:61–70. [DOI] [PubMed] [Google Scholar]
- 14.Shoamanesh A, Kwok CS, Benavente O. Cerebral microbleeds: histopathological correlation of neuroimaging. Cerebrovasc Dis. 2011;32:528–534. [DOI] [PubMed] [Google Scholar]
- 15.Bradley WG, Glenn BJ. The effect of variation in slice thickness and interslice gap on MR lesion detection. AJNR Am J Neuroradiol. 1987;8:1057–1062. [PMC free article] [PubMed] [Google Scholar]
- 16.Greenberg SM, O’Donnell HC, Schaefer PW, et al. MRI detection of new hemorrhages: potential marker of progression in cerebral amyloid angiopathy. Neurology. 1999;53:1135–1138. [DOI] [PubMed] [Google Scholar]
- 17.Jeon SB, Kang DW, Cho AH, et al. Initial microbleeds at MR imaging can predict recurrent intracerebral hemorrhage. J Neurol. 2007;254:508–512. [DOI] [PubMed] [Google Scholar]
- 18.Anupindi S, Jaramillo D. Pediatric magnetic resonance imaging techniques. Magn Reson Imaging Clin N Am. 2002;10:189–207. [DOI] [PubMed] [Google Scholar]