Supplemental Digital Content is available in the text
Abstract
Hypertension is a leading cause of cardiovascular disease. There are very few studies dealing with the incidence of hypertension and changes in blood pressure (BP) over time. We aimed to evaluate the prevalence and incidence of hypertension within an adult population-based cohort.
The sample included 967 men and 812 women aged 45 to 83 years at baseline, 1436 subjects completed follow-up1 after 4 years and 1079 completed follow-up2 after 9 years. BP was measured according to a standardized protocol with oscillometric devices and hypertension was defined as mean systolic BP (SBP) ≥140 mmHg and/or diastolic BP (DBP) ≥90 mmHg and/or use of antihypertensive medication if hypertension was known. We examined prevalence and incidence of hypertension, by age and sex.
The age-standardized prevalence of hypertension at baseline was 74.3% for men and 70.2% for women. The age-standardized annual incidence rate of hypertension for men was 8.6 (95% confidence interval [95% CI] 4.3–12.9) for follow-up period1 and 5.4 (95% CI 2.8-10.6) for follow-up period2 and for women 8.2 (95% CI 3.6–12.8) for follow-up1 and 5.6 (95%CI 2.7-11.4) for follow-up2. A clear decrease in SBP and DBP between baseline and follow-up1 and follow-up2 was seen, accompanied by an increase in anti-hypertensive medication consumption and a higher awareness of the condition.
Hypertension prevalence and incidence in the CARLA Study appear to be elevated compared with other studies. The decrease of BP over time seems to be caused by improved hypertension control due to interventional effects of our observational study and improved health care.
Hypertension is a well-recognized risk factor for cardiovascular and renal diseases; moreover, even slightly elevated blood pressure (BP) levels lead to increased risk in cardiovascular diseases (CVD) or stroke.1 Hence, it is one of the leading causes of global burden of disease.2 As age is an important risk factor for hypertension,3 the population aging in Western countries exacerbates the situation.
The prevalence of hypertension differs substantially by regions. The eastern parts of Germany reveal a higher prevalence of hypertension than the western parts.4–6 Elucidations on this regional disparity are not yet clear. However, similar studies held in European countries have proposed several explanations for diverging poor BP control, for example, high obesity prevalence could mitigate the effects of antihypertensive medications; inappropriate drug prescription or poor patient adherence to medication.7–9 In general, prevalence of hypertension is greater in European countries compared with Northern American countries;10 besides hypertensive patients are less treated and controlled in Europe than in the United States.11 Regional differences are also found in the awareness of hypertension.10
Although the prevalence of hypertension has been documented in a number of studies, there are only few on incidence of hypertension in the general adult population.12–14 The CARLA Study (CARdiovascular disease–Living and Ageing in Halle) is a population-based cohort study in the general population.15 First results of a study showed an unfavourable distribution of diabetes mellitus, hypertension, and central obesity in this eastern part of Germany compared with other regions of Germany.4 Furthermore, the federal state Saxony-Anhalt, where the CARLA study was performed, is characterized by the highest cardiovascular mortality in Germany.16
Therefore, the aim of our study is to investigate the prevalence and incidence of hypertension in the general population in eastern Germany and its change over time. Additionally, changes in medical treatment and awareness of hypertension over time are investigated. In our study, we report not only the hypertension prevalence as previously done by other German cohorts, but also the yearly incidence over a long follow-up period (9 years in average). Also, we take into consideration the non-response bias, by weighting the incidence for lost to follow-up, which otherwise could influence the results by underestimating the incidence rates.
METHODS
Participants and Setting
The CARLA study is a population-based cohort study in the adult population of the city of Halle/Saale in eastern Germany. Study design and methods were described in detail elsewhere.15,17 In brief, subjects were recruited randomly from the population registry in a multistage process. At baseline, 1779 subjects (46% women) aged 45 to 83 years were examined between July 2002 and January 2006. After a mean of 4.0 years of follow-up (standard deviation [SD] = 0.3, minimum = 3.4, maximum = 6.8), 1436 subjects (45% women) took part in the first follow-up examination and after a mean of 8.8 years (SD = 0.7, minimum = 7.5, max = 10.4) 1136 participants (N = 47% women) took part in the second follow-up examination (response rates 92% and 80% for follow-up1 and follow-up2, respectively, see Figure 1). The study was in accordance with the declaration of Helsinki. All participants gave their written informed consent. The study was approved by the local ethic commission of the Medical Faculty of the Martin-Luther-University Halle-Wittenberg.
FIGURE 1.
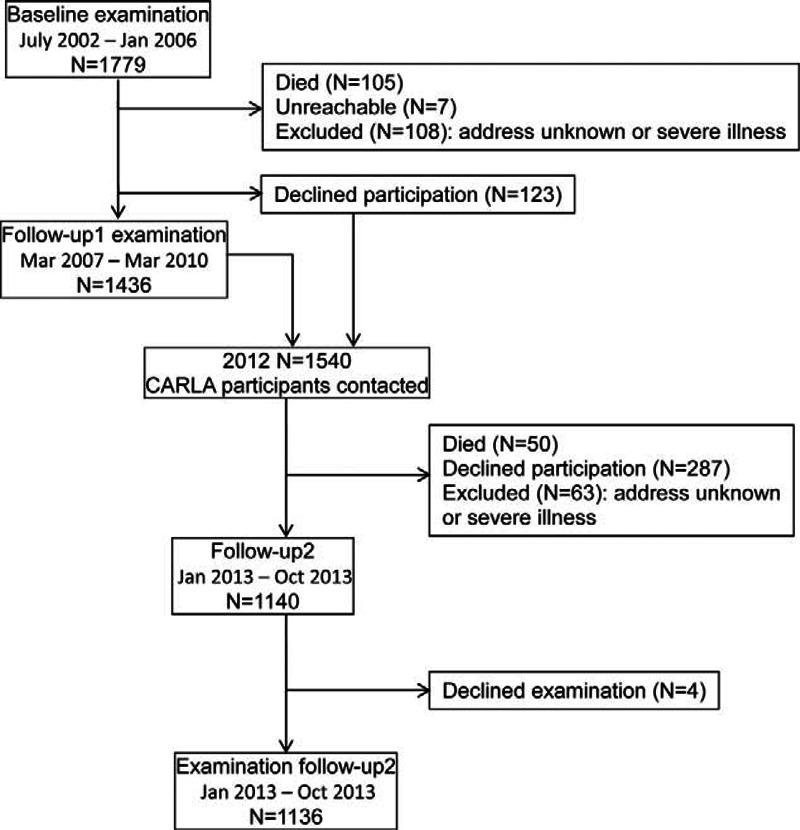
Flow chart of the CARLA study.
The examinations at baseline and both follow-up investigations included a standardized computer-assisted personal interview, self-administered questionnaires, a medical examination by trained personnel, and drawing of a non-fasting venous blood sample. The standardized, computer-assisted interview collected information on sociodemographic and socioeconomic variables, psychological and biomedical factors, medical history, and use of medication within the preceding 7 days.
Outcome
Measurement of BP was conducted within the medical examination in a sitting position and started after a resting phase of at least 5 minutes. Systolic and diastolic BPs (SBPs and DBPs) were measured with an oscillometric device (OMRON HEM-705CP, OMRON, Tokyo, Japan) 3 times on the left arm with a break of 3min between measurements. BP was defined as the mean of second and third measurement. Medication was coded according to the Anatomical Therapeutic Chemical Classification System (ATC code). ATC codes C02, C03, C07, C08, and C09 were selected to define current use of antihypertensive medication. However, because the indication for taking these medications may be other than hypertension, the antihypertensive medication was only used for defining hypertension if the participant stated a physician-diagnosis of hypertension.
Hypertension was defined as mean SBP ≥140 mmHg, and/or mean DBP ≥90 mmHg, and/or use of antihypertensive medication according to the ATC code, given the participant had known hypertension.
Hypertensive participants were categorized into 1 of the following 4 subgroups: unaware of hypertension; aware of hypertension, but not treated with antihypertensive medication; aware of hypertension and treated, but not reaching BP values < 140 mmHg and 90 mmHg; aware of hypertension and controlled treated.
Statistical Analysis
The prevalence and incidence rate of hypertension was calculated for men and women age-standardized according to the German adult population in the age range 45 to 85 years grouped in 10-year categories (Germany, 31 December 2011) (www.gbe-bund.de). The annual incidence rate was weighted multiplicatively for non-response.18 For derivation of non-response weights, 2 logistic regression models for participation at follow-up1 or follow-up2 were run with baseline variables as predictors (age, sex, smoking status, SBP and DBP, body mass index (BMI), waist-hip-ratio (WHR), alcohol consumption, and education level). The inverse of the probability to participate at each follow-up was calculated and used as drop outs weights.
Distributions of SBP and DBP sex-stratified at each follow-up point and weighted for loss to follow-up are presented as determined with the procedure CAPABILITY. All analyses were conducted using SAS 9.3 (SAS Institute, Cary, NC).
RESULTS
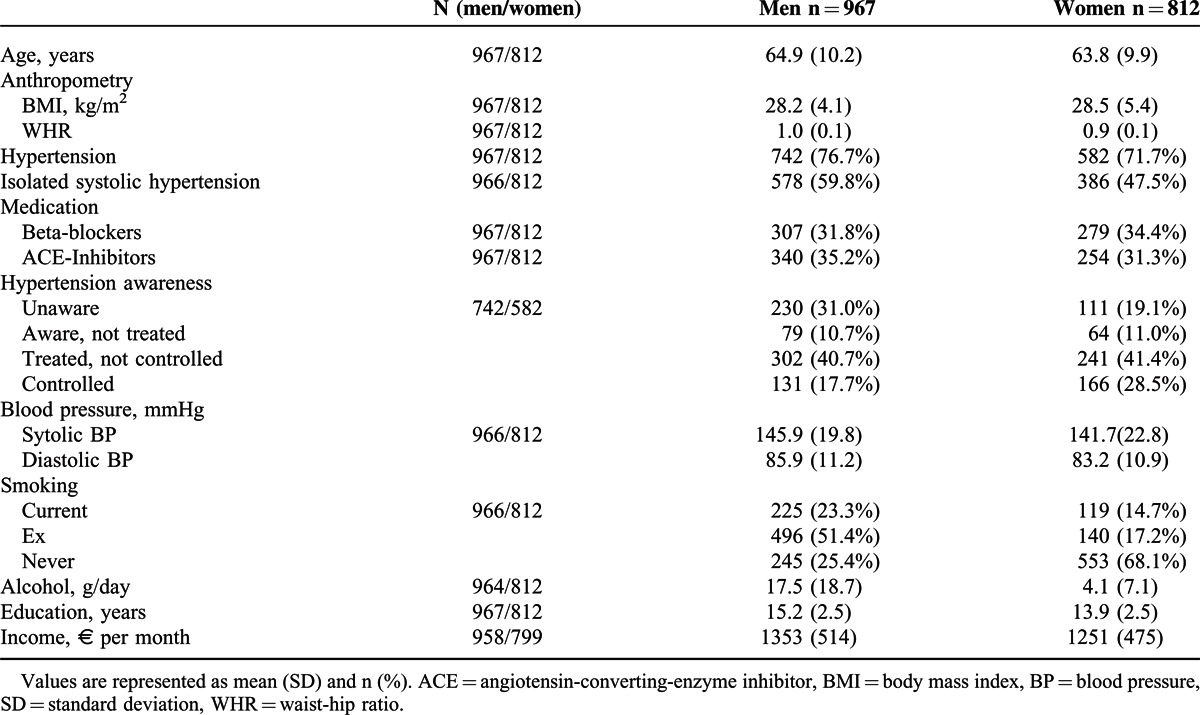
Table 1 shows the baseline characteristics of the sample. The CARLA study comprised 1779 subjects with a mean age of 64.9 (SD = 10.2) years for men and 63.8 (SD = 9.9) years for women at baseline. The average BMI at baseline for men was 28.2 kg/m2 and for women was 28.5 kg/m2; 76% of participants were overweight (BMI ≥25 kg/m2) according to the WHO definition.19 Mean SBP was 145.9 mmHg for men (SD = 19.8), 141.7 mmHg for women (SD = 22.8), respectively and mean DBP was 85.9 mmHg for men (SD = 11.2) and 83.2 for women (SD = 10.9), respectively.
TABLE 1.
Baseline Characteristics of the Study Population (N = 1779)
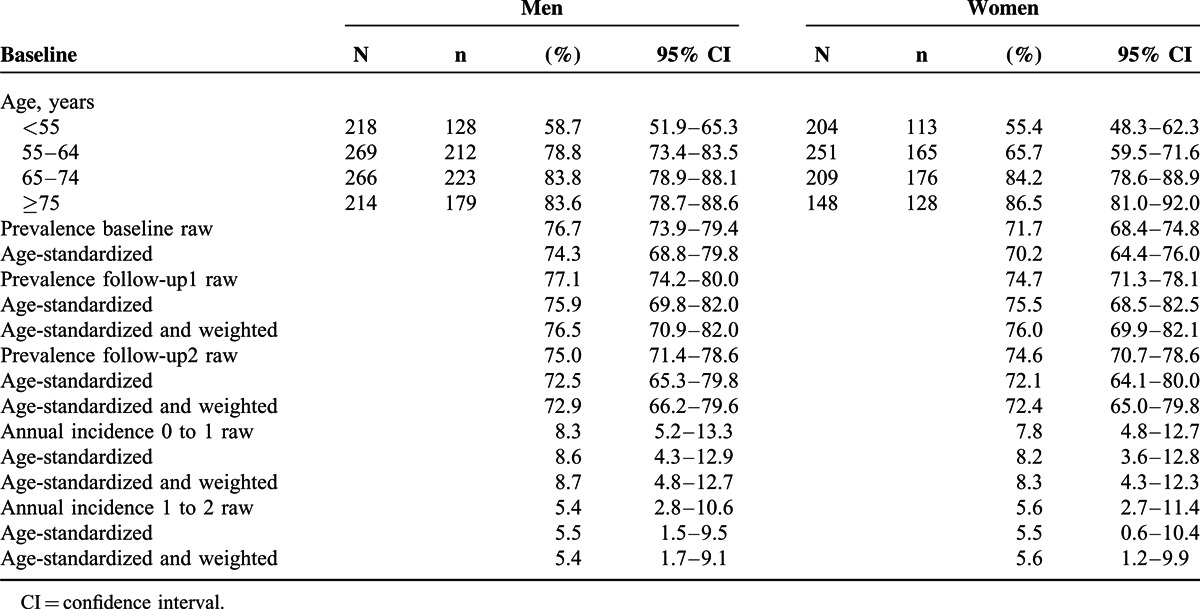
At baseline, we observed a noticeably high percentage of hypertensive participants in the study sample: 76.7% males and 71.7% females either had elevated BP or took antihypertensive medication, that is, 1324 participants (74.4%) were classified as hypertensive. It is of notice that with rising age the percentage of hypertensive participants increased (see Table 2). The age-standardized prevalence of hypertension at baseline was slightly higher for men than for women (74.3% and 70.2%, respectively). During the first 4-year follow-up, 64 men (33.3% of normotensive men at baseline) and 60 women (31.3% of normotensive women at baseline) developed hypertension. The age-standardized and weighted annual incidence rate from baseline to follow-up1 was very similar for men and for women (8.6, 95% confidence interval [CI] = 4.3–12.9 and 8.2, 95% CI = 3.6–12.8, respectively). During the next 5 years of follow-up, 38 men (25.5% of normotensive men at baseline) and 33 women (26.2% of normotensive women at baseline) developed hypertension. The age-standardized and weighted annual incidence rate from follow-up1 to follow-up2 was 5.4 per 100 men (95% CI 2.8-10.6) and 5.6 per 100 women (95% CI 2.7-11.4).
TABLE 2.
Prevalence and Annual Incidence of Hypertension Sex- and Age-stratified for 967 Men and 812 Women From the CARLA Cohort
At first follow-up examination, we measured a mean SBP of 138.7 mmHg for men and 135.2 mmHg for women and a mean DBP of 80.6 mmHg for men and 79.0 mmHg for women. On average, for men, a decrease of 7.0 mmHg (SD = 20.1) for SBP and of 6.0 mmHg (SD = 10.1) for DBP from baseline to follow-up1 was registered, whereas for women, a decrease of 5.0 mmHg (SD = 20.8) for SBP and 4.3 mmHg (SD = 9.4) for DBP were registered. At the second follow-up examination, we measured a mean SBP of 127.3 mmHg for men and 124.4 mmHg for women and a mean DBP of 74.2 mmHg for men and 73.4 mmHg for women. On average, for men a decrease of 10.6 mmHg (SD = 23.5) for SBP and of 7.1 mmHg (SD = 10.2) for DBP from follow-up1 to follow-up2 was registered, whereas for women a decrease of 9.7 mmHg (SD = 21.5) for SBP and 6.1 mmHg (SD = 9.5) for DBP was registered. In the total follow-up time (9 years) for men, a mean decrease of 17.5 mmHg (SD = 24.2) in SBP and of 13.1 mmHg (SD = 11.2) in DBP was noticed, whereas for women, the decrease in SBP was of 15.5 mmHg (SD = 25.4) and in DBP of 10.5 mmHg (SD = 11.1). Figure 2 shows the distribution of SBP and DBP for men and women over time and the shift toward lower BP. The main decrease in BP was seen in participants with hypertension (SBP ≥140 mmHg or DBP ≥90 mmHg) at baseline, whereas for those without hypertension, BP did not change overly during the study period (see supplementary digital content 1, http://links.lww.com/MD/A292, which shows less prominent decreases in BP in participants without hypertension at baseline).
FIGURE 2.
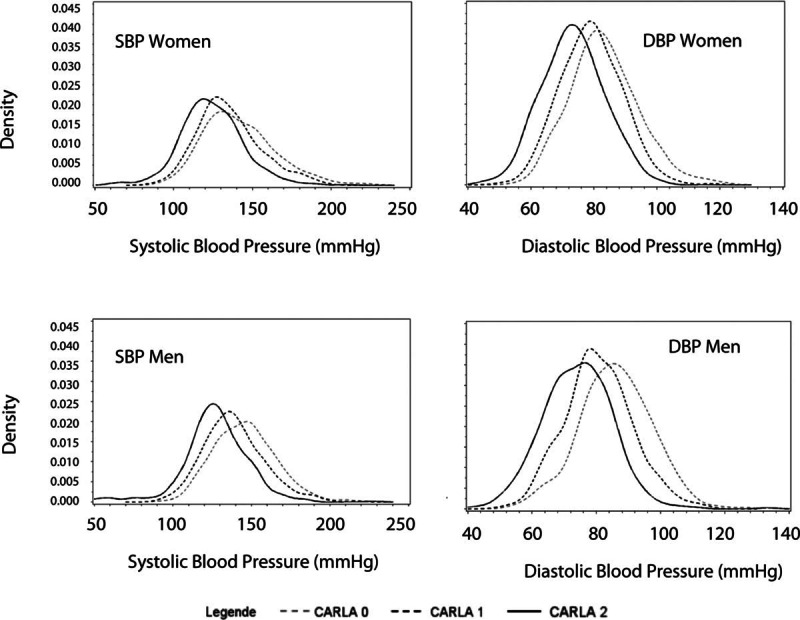
Systolic blood pressure (SBP) and diastolic blood pressure (DBP) changes from CARLA baseline (CARLA 0) to follow-up2 (CARLA 2) sex-stratified (follow-up data were weighted for loss to follow-up).
Increases in the percentage of anti-hypertensive medication consumption could be seen with increasing age cross-sectionally and longitudinally (Figure 3). At baseline, 23% of hypertensive men between 45 and 55 years took medication and that increased to 81% in men older than 75 years. Additionally, 35% of male hypertensive participants 45 to 55 years at baseline took medication at follow-up1 and 54% of them at follow-up2. This trend is also seen in hypertensive women.
FIGURE 3.
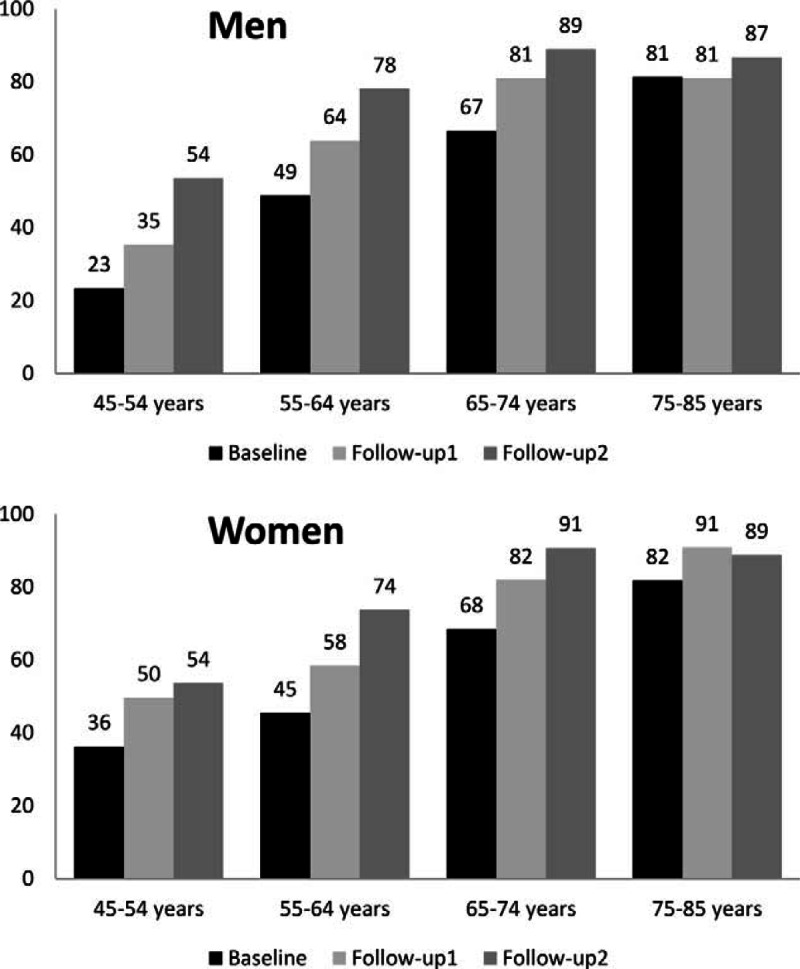
Percentage of hypertensive participants with anti-hypertensive medication by age at baseline for men and women. Follow-up data were weighted for loss to follow-up. Baseline is represented by black balks, follow-up1 by light grey and follow-up2 by dark grey.
Among participants with hypertension at baseline, only 18% (n = 131) of men and 29% (n = 166) of women were treated and controlled, that is, they got antihypertensive medication and reached BP levels <140/90 mmHg. In contrast, 381 men (51%) and 305 women (53%) had elevated BP, although they were aware of their hypertension, as they were either not treated or not controlled. In general, men were more likely to be unaware of their hypertension (n = 230; 31%) compared with women (n = 110, 19%) and were treated more often without controlling the hypertension. Positive changes in awareness of hypertension were seen over time (Figure 4). The percentage of unawareness decreased with time (to 6% for both men and women at follow-up2), whereas the percentage of correctly treated and controlled increased (to 68% and 71%, respectively, for men and women at follow-up2).
FIGURE 4.
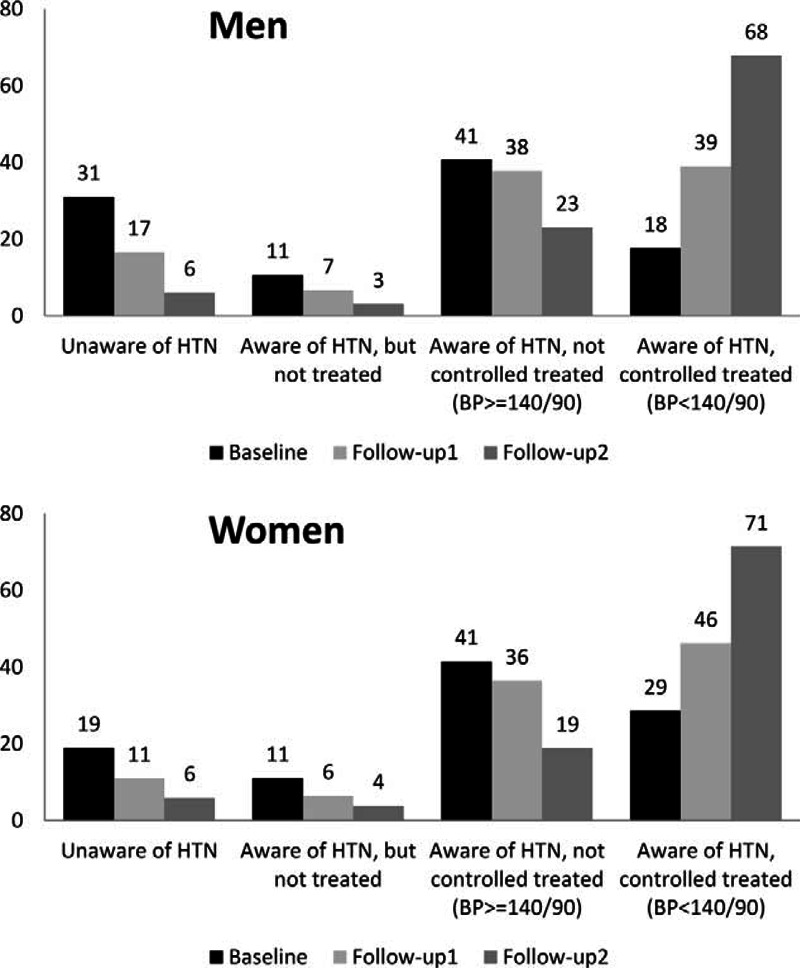
Changes in percentage of hypertension awareness among participants with hypertension at each study point, for men and women. Follow-up data were weighted for loss to follow-up. Baseline is represented by black balks, follow-up1 by light grey and follow-up2 by dark grey. BP = blood pressure, HTN = hypertension.
DISCUSSION
We found an extremely high prevalence of hypertension in our study of the general adult population at baseline. Moreover, also a high incidence of hypertension was observed during follow-up time. The prevalence of hypertension was higher for men than for women and for older participants. The annual incidence rate in this population was around 8% to 9% for the first 4 years of follow-up and 5% to 6% for the next 5 years of follow-up in men and women aged 45 to 83 years at baseline.
Additionally, for most participants, but especially for those with hypertension at baseline, there are remarkable BP decreases over the follow-up periods, independently from pharmacological or medical intervention. A possible explanation for BP reductions is the awareness of the hypertension status after taking part in the study. Participants with BP values >140/90 mmHg at baseline received a letter with their results and were advised to inform their physician. Therefore, a selective treatment effect could have occurred. All medical examinations and personal interviews at baseline and both follow-ups were done by trained personnel (study nurses). This has implications, as it has been shown that white coat hypertension is smaller for BP measurement made by nurses than by doctors.20 Hence, the BP decreases seen in our study cannot be due to differences in BP measurements.
Prevalence
Several studies have investigated the prevalence of hypertension in the adult population; however, the results depend on the definition of hypertension. In Germany, comparisons with studies using the same definition of hypertension (SHIP and KORA) show similar prevalence for men (SHIP men aged 45–54 years: 70% to aged 65–74: 81%; KORA men aged 45–54: 46% to aged 65–74: 71%; CARLA men aged 45–54: 59% to aged 65–74: 84%), but higher prevalence for women (SHIP women aged 45–54: 43% to aged 65–74: 75%; KORA women aged 45–54: 37% to aged 65–74: 62%; CARLA women aged 45–54: 55% to aged 65–74: 84%) in all age-ranges.5 The sex-related differences flatten with increasing age, among women aged 65 to 85 years; the prevalence of hypertension is slightly higher than in men in the same age-group. This trend has been shown in other studies and is attributed to the role of sex hormones.21,22 Furthermore, the prevalence of hypertension increased over time. This finding is consistent with other studies that have analyzed hypertension prevalence. In the National Health and Nutrition Examination Survey (NHANES), hypertension prevalence rises rapidly by age from 7.3% (95% CI 6.4–8.2) for subjects aged 18 to 39 years to 66.3% (95% CI 64.5%–68.1%) in subjects older than 60 years.23 Our study does not provide direct evidence to explain the higher hypertension prevalence, but, according to the current literature, possible explanations could be an unhealthy lifestyle (alcohol intake, smoking, low physical activity), or increase in BMI.10,24,25 However, it seems unlikely that for the CARLA cohort, the unhealthy lifestyle could be an explanation as alcohol intake, smoking, physical inactivity, and BMI were not excessive. In this regard, further work in progress aims the clarification of determinants of higher hypertension prevalence in this population.
Remarkably, the increase in prevalence of hypertension over time occurs simultaneously with a decrease in mean BP values. The improvement in control may be due, in part, to physician education and changing practice patterns based on the European Society of Hypertension and the European Society of Cardiology guidelines.26 The status achieved of hypertension awareness at follow-up2 (89% and 88% for men and women) is very high compared internationally27,28 and nationally.6 The differences could be explained by the age differences in the populations, as usually younger men (under 30 years) are less aware of having hypertension. Awareness of hypertension at baseline was similar to that in other regions (SHIP and KORA).5 But there is also high percentage of treated and not controlled at baseline. A Romanian population study already reported a decrease in hypertension prevalence associated with an increase in hypertension awareness and control,29 which could also be a reason for the apparent contradiction between increasing prevalence in hypertension occurring simultaneously with a decrease in BP. Further investigation requires the question whether or not only awareness, but also adherence has improved. A recent study showed that good medical adherence was associated with a better BP control.30
Incidence
Several studies have reported the incidence of hypertension in the general population. One of the first studies was the Framingham Heart Study, wherein the 2-year hypertension incidence ranged from 4% at ages 50 to 59 years to 6.2% at ages 70 to 79 years in men, and from 4% at ages 50 to 59 years to 8.6% at ages 70 to 79 years in women.12 In the ARIC study, the annual incidence of hypertension among whites aged 45 to 64 years was 4% for women and men.31 However, other studies have shown higher annual incidence rates. In Poland, the Pol-MONICA study, the age-adjusted annual hypertension incidence for men was 6% to 8%, and for women 8% to 9%.32 In Portugal, the EPIPorto study showed annual incidence rates of 6% for women and 7% for men aged 45 to 64 years.33 Comparisons between different studies reporting incidence rates of hypertension are problematic due to diverse definitions used and differences in the population structure, especially, variances in age range. Nevertheless, the comparison with other studies shows that the annual incidence of hypertension in Halle is as severe, as in Poland or Portugal. This is consistent with the high prevalence of hypertension previously reported in this population 34 and contributes to maintain an upcoming high burden of disease.35
Strengths and limitations
This study provides an estimate of the prevalence and incidence of hypertension in an adult eastern German cohort. This information is essential to evaluate the impact of the medical management and increasing awareness for this condition. Nevertheless, some limitations need to be recognized; the estimates of incidence rates are based on relatively small population size, due to the high proportion of hypertensive participants at baseline and to non-response. To correct the non-response bias, we have used weighting of the data such that the distribution of observables in the follow-up sample matches the distribution in the baseline population. Additionally, the definition of hypertension used in this study could lead to an underestimation of prevalent and incident cases because of the combination of anti-hypertensive medication and self-reported diagnosis of hypertension, which does not consider participants unaware of their hypertension.
A further question is whether regression to the mean occurred in this population sample. Regression to the mean consists of a random error that happens at repeated measurements on the same subjects that average a non-systematic variation in the observed values around the true mean. The apparent inconsistency of lower BP values but higher hypertension rates at follow-up could be in part a consequence of randomly measured higher baseline BP values. Participants with BP values >140/90 mmHg at baseline received a letter with their results and were advised to inform their physician. Therefore, a selective treatment effect could have occurred.
CONCLUSION
The prevalence and annual incidence of hypertension in this adult population is high and despite recent progresses in BP- related outcomes, the risk of hypertension remains higher in eastern Germany than in other countries and regions in Germany. Whereas some progress has been made, BP values decreased constantly probably due to a better medical control and patient compliance, there is still the urgent necessity to decrease the incidence of hypertension especially in younger people. A regular and timely control of BP by health professionals together with an improvement of compliance could lead to a better success in hypertension control.
Acknowledgement
The authors are grateful for the commitment of the study participants and for the work of the CARLA Study staff.
Footnotes
Abbreviations: 95% CI = 95% confidence intervals, ACE = angiotensin-converting-enzyme inhibitor, ATC = Anatomical Therapeutic Chemical classification system, BMI = body mass index, BP = blood pressure, CARLA = CARdiovascular disease—Living and Ageing in Halle, CVD, cardiovascular disease = DBP, diastolic blood pressure = HTN, hypertension = SBP, systolic blood pressure = SD, standard deviation = WHR, waist hip ratio.
MEL and AK contributed equally to this study.
The CARLA study was supported by a grant from the Deutsche Forschungsgemeinschaft as part of the Collaborative Research Centre 598 “Heart failure in the elderly—cellular mechanisms and therapy” at the Medical Faculty of the Martin-Luther-University Halle-Wittenberg, by a grant, from the Wilhelm-Roux Programme of the Martin-Luther-University Halle-Wittenberg, by the Ministry of Education and Cultural Affairs of Saxony-Anhalt, and by the Federal Employment Office.
The authors have no conflicts of interest to declare.
Supplemental digital content is available for this article. Direct URL citations appear in the printed text and are provided in the HTML and PDF versions of this article on the journal's Website (www.md-journal.com).
REFERENCES
- 1.Kannel WB. Elevated systolic blood pressure as a cardiovascular risk factor. Am J Cardiol 2000; 85:251–255. [DOI] [PubMed] [Google Scholar]
- 2.Ezzati M, Lopez AD, Rodgers A, et al. Selected major risk factors and global and regional burden of disease. Lancet 2002; 360:1347–1360. [DOI] [PubMed] [Google Scholar]
- 3.Whelton PK, He J, Muntner P. Prevalence, awareness, treatment and control of hypertension in North America, North Africa and Asia. J Hum Hypertens 2004; 18:545–551. [DOI] [PubMed] [Google Scholar]
- 4.Schipf S, Werner A, Tamayo T, et al. Regional differences in the prevalence of known Type 2 diabetes mellitus in 45–74 years old individuals: results from six population-based studies in Germany (DIAB-CORE Consortium). Diabet Med 2012; 29:e88–e95. [DOI] [PubMed] [Google Scholar]
- 5.Meisinger C, Heier M, Volzke H, et al. Regional disparities of hypertension prevalence and management within Germany. J Hypertens 2006; 24:293–299. [DOI] [PubMed] [Google Scholar]
- 6.Neuhauser H, Thamm M, Ellert U. [Blood pressure in Germany 2008–2011: results of the German Health Interview and Examination Survey for Adults (DEGS1)]. Bundesgesundheitsblatt Gesundheitsforschung Gesundheitsschutz 2013; 56:795–801. [DOI] [PubMed] [Google Scholar]
- 7.Tocci G, Ferrucci A, Guida P, et al. Global cardiovascular risk management in different Italian regions: an analysis of the Evaluation of Final Feasible Effect of Control Training and Ultra Sensitisation (EFFECTUS) educational program. Nutr Metab Cardiovasc Dis 2012; 22:635–642. [DOI] [PubMed] [Google Scholar]
- 8.Dallongeville J, Banegas JR, Tubach F, et al. Survey of physicians’ practices in the control of cardiovascular risk factors: the EURIKA study. Eur J Prev Cardiol 2012; 19:541–550. [DOI] [PubMed] [Google Scholar]
- 9.Kotseva K, Wood D, De Backer G, et al. EUROASPIRE III. Management of cardiovascular risk factors in asymptomatic high-risk patients in general practice: cross-sectional survey in 12 European countries. Eur J Cardiovasc Prevent Rehabil 2010; 17:530–540. [DOI] [PubMed] [Google Scholar]
- 10.Wolf-Maier K, Cooper RS, Banegas JR, et al. Hypertension prevalence and blood pressure levels in 6 European countries, Canada, and the United States. JAMA 2003; 289:2363–2369. [DOI] [PubMed] [Google Scholar]
- 11.Wolf-Maier K, Cooper RS, Kramer H, et al. Hypertension treatment and control in five European countries, Canada, and the United States. Hypertension 2004; 43:10–17. [DOI] [PubMed] [Google Scholar]
- 12.Dannenberg AL, Garrison RJ, Kannel WB. Incidence of hypertension in the Framingham Study. Am J Public Health 1988; 78:676–679. [DOI] [PMC free article] [PubMed] [Google Scholar]
- 13.Vargas CM, Ingram DD, Gillum RF. Incidence of hypertension and educational attainment: the NHANES I epidemiologic followup study. First National Health and Nutrition Examination Survey. Am J Epidemiol 2000; 152:272–278. [DOI] [PubMed] [Google Scholar]
- 14.Vasan RS, Larson MG, Leip EP, et al. Assessment of frequency of progression to hypertension in non-hypertensive participants in the Framingham Heart Study: a cohort study. Lancet 2001; 358:1682–1686. [DOI] [PubMed] [Google Scholar]
- 15.Greiser KH, Kluttig A, Schumann B, et al. Cardiovascular disease, risk factors and heart rate variability in the elderly general population: design and objectives of the CARdiovascular disease, Living and Ageing in Halle (CARLA) Study. BMC Cardiovasc Disord 2005; 5:33. [DOI] [PMC free article] [PubMed] [Google Scholar]
- 16.Muller-Nordhorn J, Rossnagel K, Mey W, et al. Regional variation and time trends in mortality from ischaemic heart disease: East and West Germany 10 years after reunification. J Epidemiol Community Health 2004; 58:481–485. [DOI] [PMC free article] [PubMed] [Google Scholar]
- 17.Haerting J, Kluttig A, Greiser KH, et al. [A cohort study investigating risk factors for cardiovascular disease in an urban elderly East-German population (CARLA study)]. Bundesgesundheitsblatt Gesundheitsforschung Gesundheitsschutz 2012; 55:795–800. [DOI] [PubMed] [Google Scholar]
- 18.Hogan JW, Roy J, Korkontzelou C. Handling drop-out in longitudinal studies. Stat Med 2004; 23:1455–1497. [DOI] [PubMed] [Google Scholar]
- 19.WHO. Obesity: preventing and managing the global epidemic. Report of a WHO consultation. World Health Organ Tech Rep Ser 2000; 894:i-253. [PubMed] [Google Scholar]
- 20.Clark CE, Horvath IA, Taylor RS, et al. Doctors record higher blood pressures than nurses: systematic review and meta-analysis. Br J Gen Pract 2014; 64:e223–e232. [DOI] [PMC free article] [PubMed] [Google Scholar]
- 21.Maric C. Sex differences in cardiovascular disease and hypertension: involvement of the renin-angiotensin system. Hypertension 2005; 46:475–476. [DOI] [PubMed] [Google Scholar]
- 22.McDonald M, Hertz RP, Unger AN, et al. Prevalence, awareness, and management of hypertension, dyslipidemia, and diabetes among United States adults aged 65 and older. J Gerontol A Biol Sci Med Sci 2009; 64:256–263. [DOI] [PMC free article] [PubMed] [Google Scholar]
- 23.Ong KL, Cheung BM, Man YB, et al. Prevalence, awareness, treatment, and control of hypertension among United States adults 1999–2004. Hypertension 2007; 49:69–75. [DOI] [PubMed] [Google Scholar]
- 24.Gasse C, Hense HW, Stieber J, et al. Assessing hypertension management in the community: trends of prevalence, detection, treatment, and control of hypertension in the MONICA Project, Augsburg 1984–1995. J Hum Hypertens 2001; 15:27–36. [DOI] [PubMed] [Google Scholar]
- 25.Hajjar I, Kotchen TA. Trends in prevalence, awareness, treatment, and control of hypertension in the United States, 1988–2000. JAMA 2003; 290:199–206. [DOI] [PubMed] [Google Scholar]
- 26.Mansia G, De BG, Dominiczak A, et al. 2007 ESH-ESC Guidelines for the management of arterial hypertension: the task force for the management of arterial hypertension of the European Society of Hypertension (ESH) and of the European Society of Cardiology (ESC). Blood Press 2007; 16:135–232. [DOI] [PubMed] [Google Scholar]
- 27.Guo F, He D, Zhang W, et al. Trends in prevalence, awareness, management, and control of hypertension among United States adults, 1999 to 2010. J Am Coll Cardiol 2012; 60:599–606. [DOI] [PubMed] [Google Scholar]
- 28.Kastarinen MJ, Antikainen RL, Laatikainen TK, et al. Trends in hypertension care in eastern and south-western Finland during 1982–2002. J Hypertens 2006; 24:829–836. [DOI] [PubMed] [Google Scholar]
- 29.Dorobantu M, Darabont R, Ghiorghe S, et al. Hypertension prevalence and control in Romania at a seven-year interval. Comparison of SEPHAR I and II surveys. J Hypertens 2014; 32:39–47. [DOI] [PubMed] [Google Scholar]
- 30.Krousel-Wood M, Holt E, Joyce C, et al. Differences in cardiovascular disease risk when antihypertensive medication adherence is assessed by pharmacy fill versus self-report: the Cohort Study of Medication Adherence among Older Adults (CoSMO). J Hypertens 2015; 33:412–420. [DOI] [PMC free article] [PubMed] [Google Scholar]
- 31.Diez Roux AV, Chambless L, Merkin SS, et al. Socioeconomic disadvantage and change in blood pressure associated with aging. Circulation 2002; 106:703–710. [DOI] [PubMed] [Google Scholar]
- 32.Rywik SL, Williams OD, Pajak A, et al. Incidence and correlates of hypertension in the Atherosclerosis Risk in Communities (ARIC) study and the Monitoring Trends and Determinants of Cardiovascular Disease (POL-MONICA) project. J Hypertens 2000; 18:999–1006. [DOI] [PubMed] [Google Scholar]
- 33.Pereira M, Lunet N, Paulo C, et al. Incidence of hypertension in a prospective cohort study of adults from Porto, Portugal. BMC Cardiovasc Disord 2012; 12:114. [DOI] [PMC free article] [PubMed] [Google Scholar]
- 34.Greiser KH, Kluttig A, Schumann B, et al. Cardiovascular diseases, risk factors and short-term heart rate variability in an elderly general population: the CARLA study 2002–2006. Eur J Epidemiol 2009; 24:123–142. [DOI] [PubMed] [Google Scholar]
- 35.Danaei G, Finucane MM, Lu Y, et al. National, regional, and global trends in fasting plasma glucose and diabetes prevalence since 1980: systematic analysis of health examination surveys and epidemiological studies with 370 country-years and 2.7 million participants. Lancet 2011; 378:31–40. [DOI] [PubMed] [Google Scholar]


