

Abstract
Prostate cancer (PCa) is a common illness for aging males. Lycopene has been identified as an antioxidant agent with potential anticancer properties. Studies investigating the relation between lycopene and PCa risk have produced inconsistent results. This study aims to determine dietary lycopene consumption/circulating concentration and any potential dose–response associations with the risk of PCa. Eligible studies published in English up to April 10, 2014, were searched and identified from Pubmed, Sciencedirect Online, Wiley online library databases and hand searching. The STATA (version 12.0) was applied to process the dose–response meta-analysis. Random effects models were used to calculate pooled relative risks (RRs) and 95% confidence intervals (CIs) and to incorporate variation between studies. The linear and nonlinear dose–response relations were evaluated with data from categories of lycopene consumption/circulating concentrations. Twenty-six studies were included with 17,517 cases of PCa reported from 563,299 participants. Although inverse association between lycopene consumption and PCa risk was not found in all studies, there was a trend that with higher lycopene intake, there was reduced incidence of PCa (P = 0.078). Removal of one Chinese study in sensitivity analysis, or recalculation using data from only high-quality studies for subgroup analysis, indicated that higher lycopene consumption significantly lowered PCa risk. Furthermore, our dose–response meta-analysis demonstrated that higher lycopene consumption was linearly associated with a reduced risk of PCa with a threshold between 9 and 21 mg/day. Consistently, higher circulating lycopene levels significantly reduced the risk of PCa. Interestingly, the concentration of circulating lycopene between 2.17 and 85 μg/dL was linearly inversed with PCa risk whereas there was no linear association >85 μg/dL. In addition, greater efficacy for the circulating lycopene concentration on preventing PCa was found for studies with high quality, follow-up >10 years and where results were adjusted by the age or the body mass index. In conclusion, our novel data demonstrates that higher lycopene consumption/circulating concentration is associated with a lower risk of PCa. However, further studies are required to determine the mechanism by which lycopene reduces the risk of PCa and if there are other factors in tomato products that might potentially decrease PCa risk and progression.
INTRODUCTION
Prostate cancer (PCa) is the second most common cancer and fifth leading cause of death in men. There were 1.1 million patients diagnosed with PCa worldwide in 2012 accounting for 15% of the total diagnosed cancers in men and 307,000 deaths, representing 6.6% of the total male cancer mortality.1 Diet, lifestyle, environment, and genetics are regarded as risk factors for PCa. A case-control study in Western Australia found that a Western dietary pattern with high intake of red or processed meats, fried fish, chips, high-fat milk and white bread was associated with a higher risk for PCa.2 In recent decades, growth of the Chinese economy accompanied with a shift towards western lifestyle has been associated with an increased prevalence of PCa in China. The overall incidence of PCa in China increased from 3.80/100,000 in 2001 to 7.10/100,000 in 2011 and in urban areas from 4.49/100,000 to 10.06/100,000).3,4 The World Cancer Research Fund has reported that a high intake of fruit and vegetable may be beneficial in reducing the risk of cancer including PCa.5 Tomatoes and tomato products, which contain abundant lycopene, are in particular recommended for PCa prevention. Lycopene, a 40-carbon carotenoid molecule, has been identified as an antioxidant agent with potential anti-cancer properties and no obvious side effects.6
A number of studies have investigated lycopene in relation to PCa risk.7–31 Some studies12,20,25,28,31 supported an inverse association, whereas others7–9,13–19,21–24,26,27,29,30 presented null findings. At present there are 2 meta-analyses studying the association between lycopene and PCa. In a meta-analysis32 published in 2003, Etminan et al found an inverse association. However a study published in 2013 by Chen et al found no effect.33 Moreover, these 2 meta-analyses did not evaluate the dose–response association with risk reduction or determine a beneficial range of consumption and both suggested a further study was needed to determine the type and quantity of tomato products for preventing PCa. In 2014, a high-quality 24-years follow-up nested case-control (NCC) study20 including 51,529 US healthy men suggested a reduced odds of PCa for those with highest lycopene intake when compared to those with lowest lycopene intake (hazard ratio [HR] 0.91, 95% confidential interval [CI] 0.84 to 1.00). As inconsistencies between studies may relate to different exposure levels, it is important to determine the shape of the dose–response curve. It is also possible that only those individuals with a low baseline lycopene intake or status may benefit from higher lycopene consumption. However, none of previous reviews have investigated these issues. Therefore we conducted an updated systematic review to clarify whether lycopene intake or serum concentration is inversely related to PCa, with particular emphasis on the shape of the dose–response curve.
METHOD
Search Strategy
Based on the Meta-analysis of Observational Studies in Epidemiology (MOOSE),34 we carried out and reported the present study. Case-control (CC) or NCC or prospective cohort studies that examined the associations of lycopene intake or circulating (plasma/serum) concentrations with the risk of PCa were analyzed. Databases, including PubMed (from 1950), Sciencedirect Online (from 1998), Wiley online library (from 1960) were searched for articles published up to 10 April 2014. The key search terms used were as follows: “lycopene,” “intake,” “consumption,” “lycopene concentrations,” “prostate,” “neoplasm,” “humans,” “case-control studies,” “follow-up studies,” “prospective studies” and their variants. Reference lists from published studies were manually searched to identify additional articles. The approval by an institutional review board is not required because this study was based on published studies.
Eligibility Criteria
Two independent investigators (WHZ, XW) conducted an initial screening of article titles and abstracts to remove duplicate references, letters, comments, reviews, ecological studies, animal studies, single case reports, and meta-analyses. Reviewers used prespecified guidelines to ensure a consistent approach. Then 2 independent investigators (PC and ZL) evaluated all potentially relevant articles based on full text reviews using a structured flow chart and detailed guidelines to determine eligibility for inclusion. Any disagreement was settled by a third reviewer (QM).
Studies were included if they meet the following criteria: first, patients in the case group must be diagnosed with PCa and free of PCa in the control group or the non-case group; second, there was documentation of lycopene intake or circulating concentrations; third, PCa was diagnosed by histology, pathology, biopsy, or histopathology; fourth, original research from observational studies, such as CC, NCC, or cohort studies; fifth, complete data was provided, such as relative risk (RR), risk ratio (RO), odd risk (OR) or HR, number of cases, controls or noncases or person years; finally, there were at least 3 quantitative categories of lycopene intake or circulating concentrations. Studies were excluded if they did not meet all criteria.
Multiple reports from the same cohort study were reviewed and papers with the longest follow-up for identical outcomes were included. If longer follow-up but insufficient data were presented, we chose those complete shorter follow-up ones. Different studies with sufficient data from one article were also included.
Data Extraction and Quality Assessment
Three reviewers (PC, KKZ and DSN) independently performed the data extraction by using a standardized data collection form. We extracted the information as follows: first author, cohort name, publication year, country, age, duration of follow-up, study design, clinical classification of PCa, numbers of cases, numbers of controls or noncases or person years, dose categories, adjusted or crude RR, OR or HR with 95% CI and adjusted variables that entered into the multivariable model as potential confounders. If studies already reported a linear dose–response trend with CI or standard error, they were used directly. For dose–response meta-analysis, the term RR will be used as a generic term for RO (cumulative incidence data), rate ratio (incidence-rate data), odds ratio (CC data) and HR.35 The mean value or midpoint of the upper and lower boundaries of each category was used to estimate assigned dose. For the lowest quartile, lower boundary was assumed to be 0 if it was not provided. For the open-ended upper category, the assigned dose which was the cut point multiplied by 1.5 was evaluated.36 Any potential inconsistencies were resolved through discussion.
Methodological quality of studies was evaluated using the Newcastle–Ottawa Scale.37 Other aspects of study quality, such as follow-up duration, study types, study location, adjustment for various important confounders and clinical classification, were investigated through subgroup analysis.
Statistics Analysis
To derive a linear dose–response curve, the distribution of cases and person-years, or cases and non–cases with RRs and estimates of uncertainty (such as CIs) for at least 3 categories of quantified lycopene intake or circulating concentrations was required to be presented in the included studies. If the total number of cases or person-years was presented without distribution, we estimated the distribution on the basis of definitions of the quantiles. If the unit for circulating concentrations was μmol/L, it was multiplied by 536.85 (relative molecular weight of lycopene) and adjusted to μg/L.
STATA version 12.0 (StataCorp LP, College Station, TX) was applied to analyze the data. RR and 95% CI were used as a measure of the effect size for all studies, as HR and OR would be approximately regarded as RR for low incidence of diseases. The RR and relevant 95% CI of highest vs. lowest category of lycopene intake or circulating concentrations were pooled and an estimated dose–response trend was derived for each study with method recommended by Greenland and Longnecker.38 These trends were then combined with using random effects meta-analysis, as a random effects model can provide more conservative results than a fixed one for variation between studies.39 Based on data presented for each category of lycopene intake or circulating concentrations, study specific slopes (with 95% CIs) were generated.
In addition, we examined linear and nonlinear associations between lycopene intake or circulating concentrations and PCa by plotting linear and nonlinear dose–response curves using restricted cubic splines, with 3 knots at fixed centiles (10%, 50%, and 90%) of the distribution.35,40 Considering the correlation between each published RR,41 a restricted cubic spline model was estimated with a generalized least squares regression. Then study-specific estimates were combined with the restricted maximum likelihood method.39
Heterogeneity among studies was explored with Cochran's Q test and I2 was applied to quantify the proportion of the total variation in study estimates resulted from that heterogeneity.42 Sensitivity analyses and subgroup analysis were made to determine whether the results were robust and evaluate the sources of heterogeneity. In sensitivity analyses, the influence of individual studies on the overall risk was carried out by sequentially omitting one study at each turn. Other methodological features were also evaluated through subgroup analysis, including geographical location (North America, Europe or others); follow-up duration (<10 years or ≥ 10 years); study quality scores (< 8 or ≥ 8), study type, clinical classification (advanced PCa or nonadvanced PCa) as well as confounders, such as age, family history, energy intake, and body mass index (BMI).
Potential publication bias was assessed by using contour-enhanced funnel plots43 with Egger's linear regression test44 and Begg's rank correlation test45 of asymmetry. If evidence of asymmetry was indicated, the trim and fill method was used to recalculate the adjusted estimates with the addition of the missing studies.46
RESULTS
Search Results and Study Characteristics
Figure 1 depicts the literature search and the study selection process. We identified 319 articles from the PubMed database, 959 articles from the Sciencedirect database, and 1037 articles from Wiley online library. After excluding duplicates and papers that did not meet the inclusion criteria, 37 full articles of 38 potentially relevant studies were obtained. When full text was reviewed, we further excluded the following articles: 1 article47 in which the unit for estimate of trend was g/1000 kcal; 3 random control trial48–50 with different outcomes; 5 studies about lycopene and PCa progression;51–55 1 before-after study in which there was no control group;56 and 2 studies57,58 conducted by Giovannucci with shorter follow-up than the study conducted by Zu20 in the same cohort. Since Huang's article26 contains 2 different studies (CLUE I and CLUE II) in total we identified 25 articles containing 26 studies which met our criteria, with 9 CC studies,7–15 17 NCC or cohort studies.16–31 Totally, 17,517 cases of PCa reported from 563,299 participants were analyzed.
FIGURE 1.
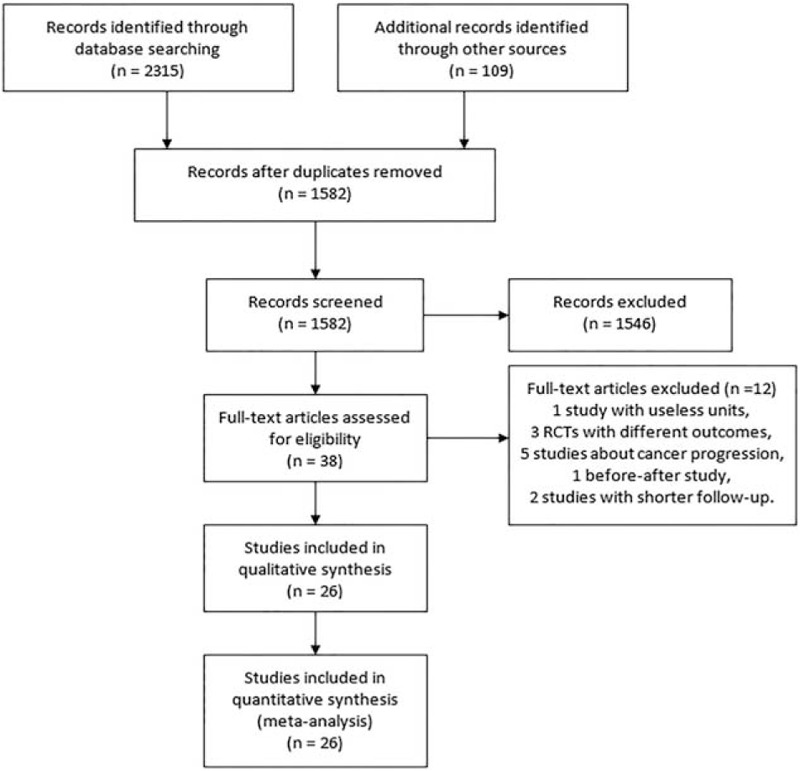
Flowchart of literature searches.
These studies were performed primarily in 2 different regions: North America (18 studies)9,10,12,15–17,20,21,23–29,31 and Europe (5 studies)13,18,19,22,30 with other regions, such as New Zealand,7 Uruguay,8 Australia14 and China11 represented by only 1 study. The main characteristics were presented in Table 1. Table 2 and Table 3 describe detailed outcomes on lycopene intake and circulating concentrations with RRs of PCa risk, respectively.
TABLE 1.
Characteristics of the Identified Studies Included in the Meta-Analyses on the Lycopene Status and Prostate Cancer
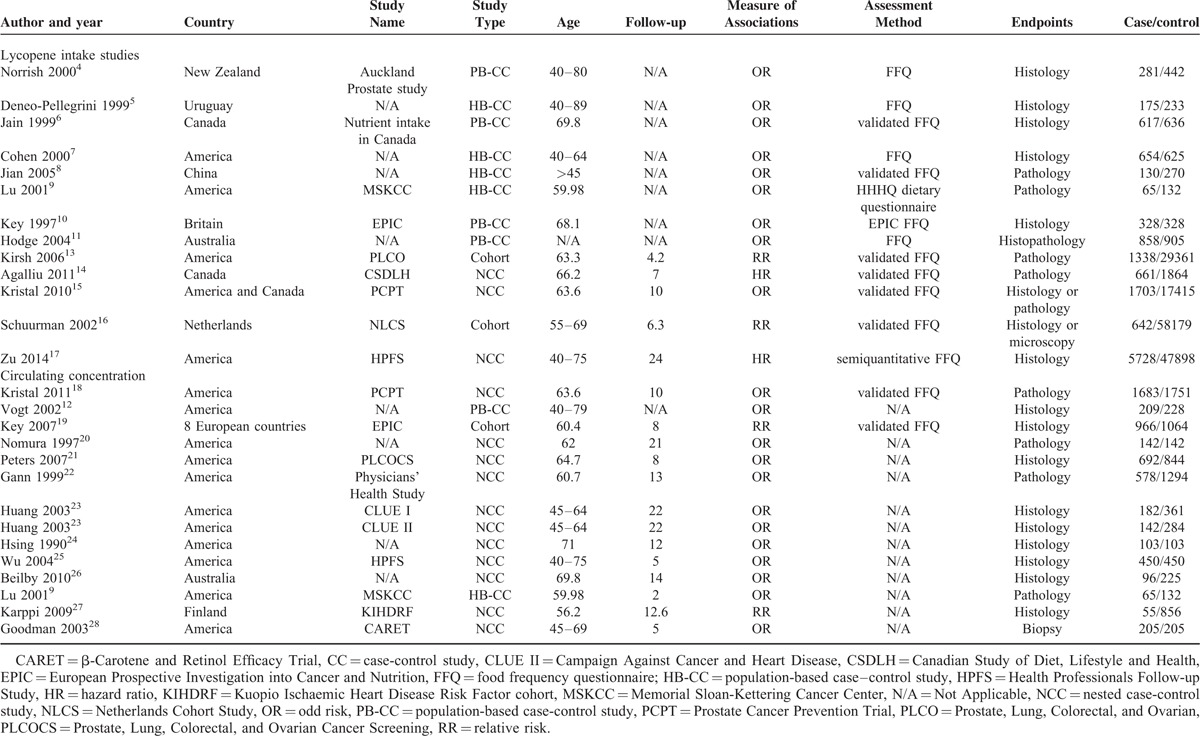
TABLE 2.
Detailed Outcomes on Lycopene Intake and RRs of Prostate Cancer
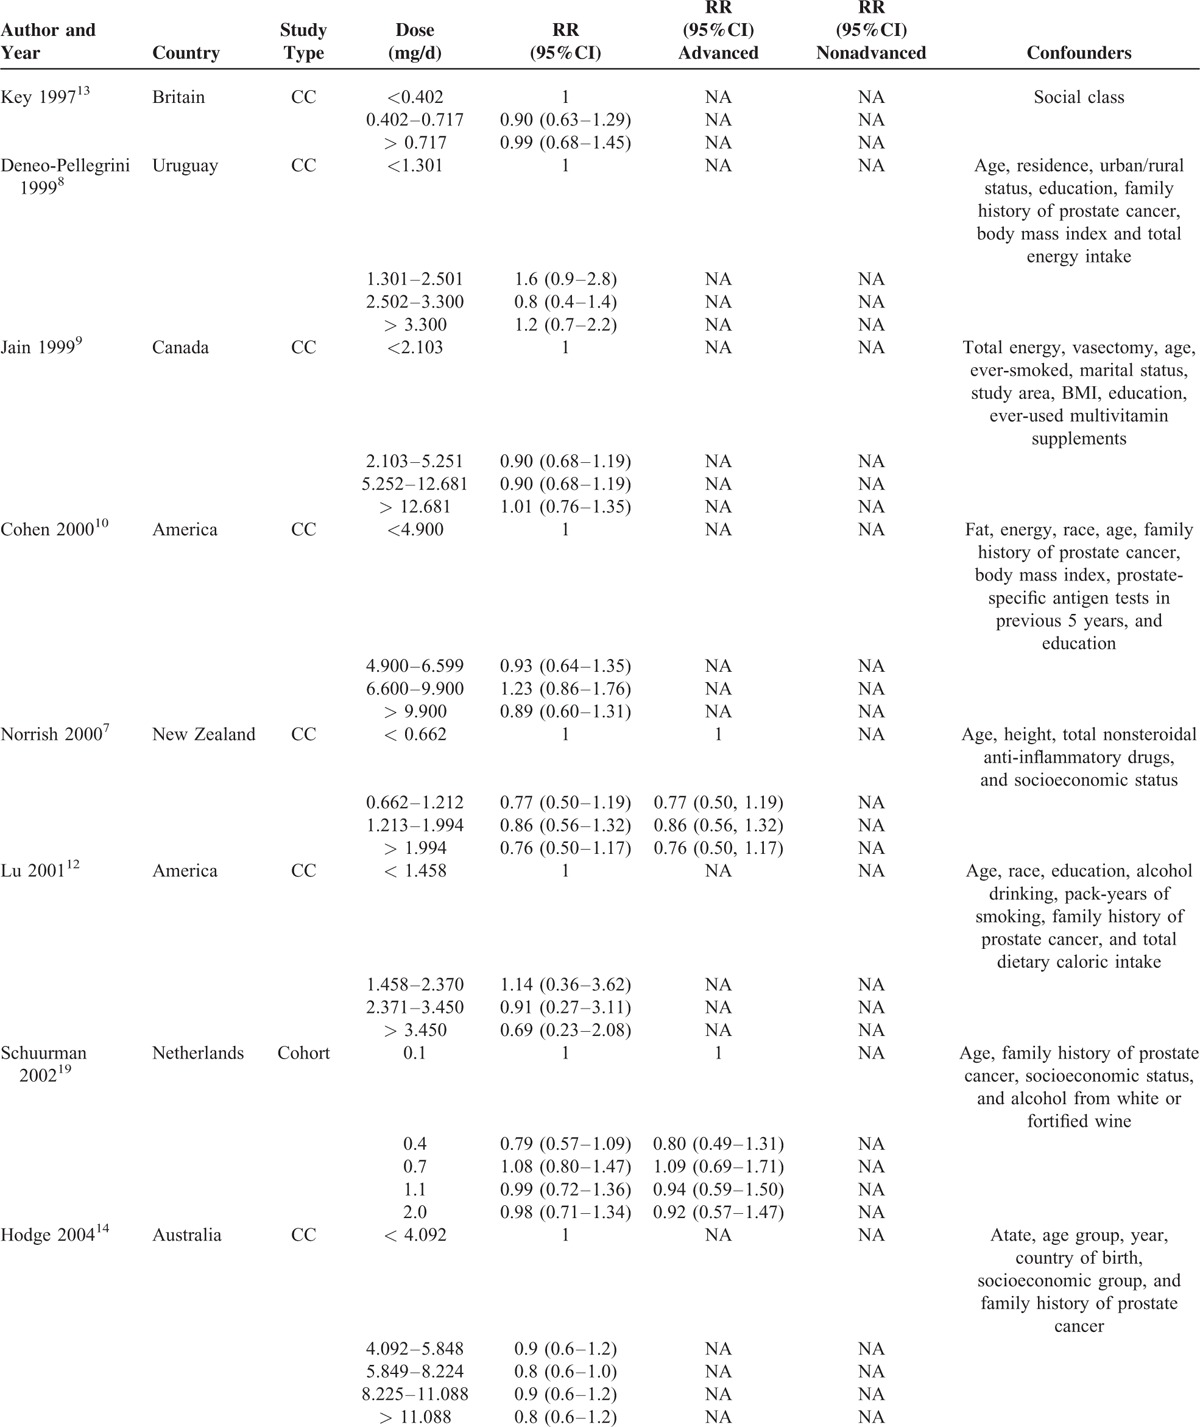
TABLE 2 (Continued).
Detailed Outcomes on Lycopene Intake and RRs of Prostate Cancer

Quality Assess
The Newcastle–Ottawa Scale37 was applied to assess the quality of included studies. As described in Table 4, the mean score was 7 (highest 8 and lowest 6) and 8 (highest 9 and lowest 6) for CC studies and cohort/NCC studies, respectively.
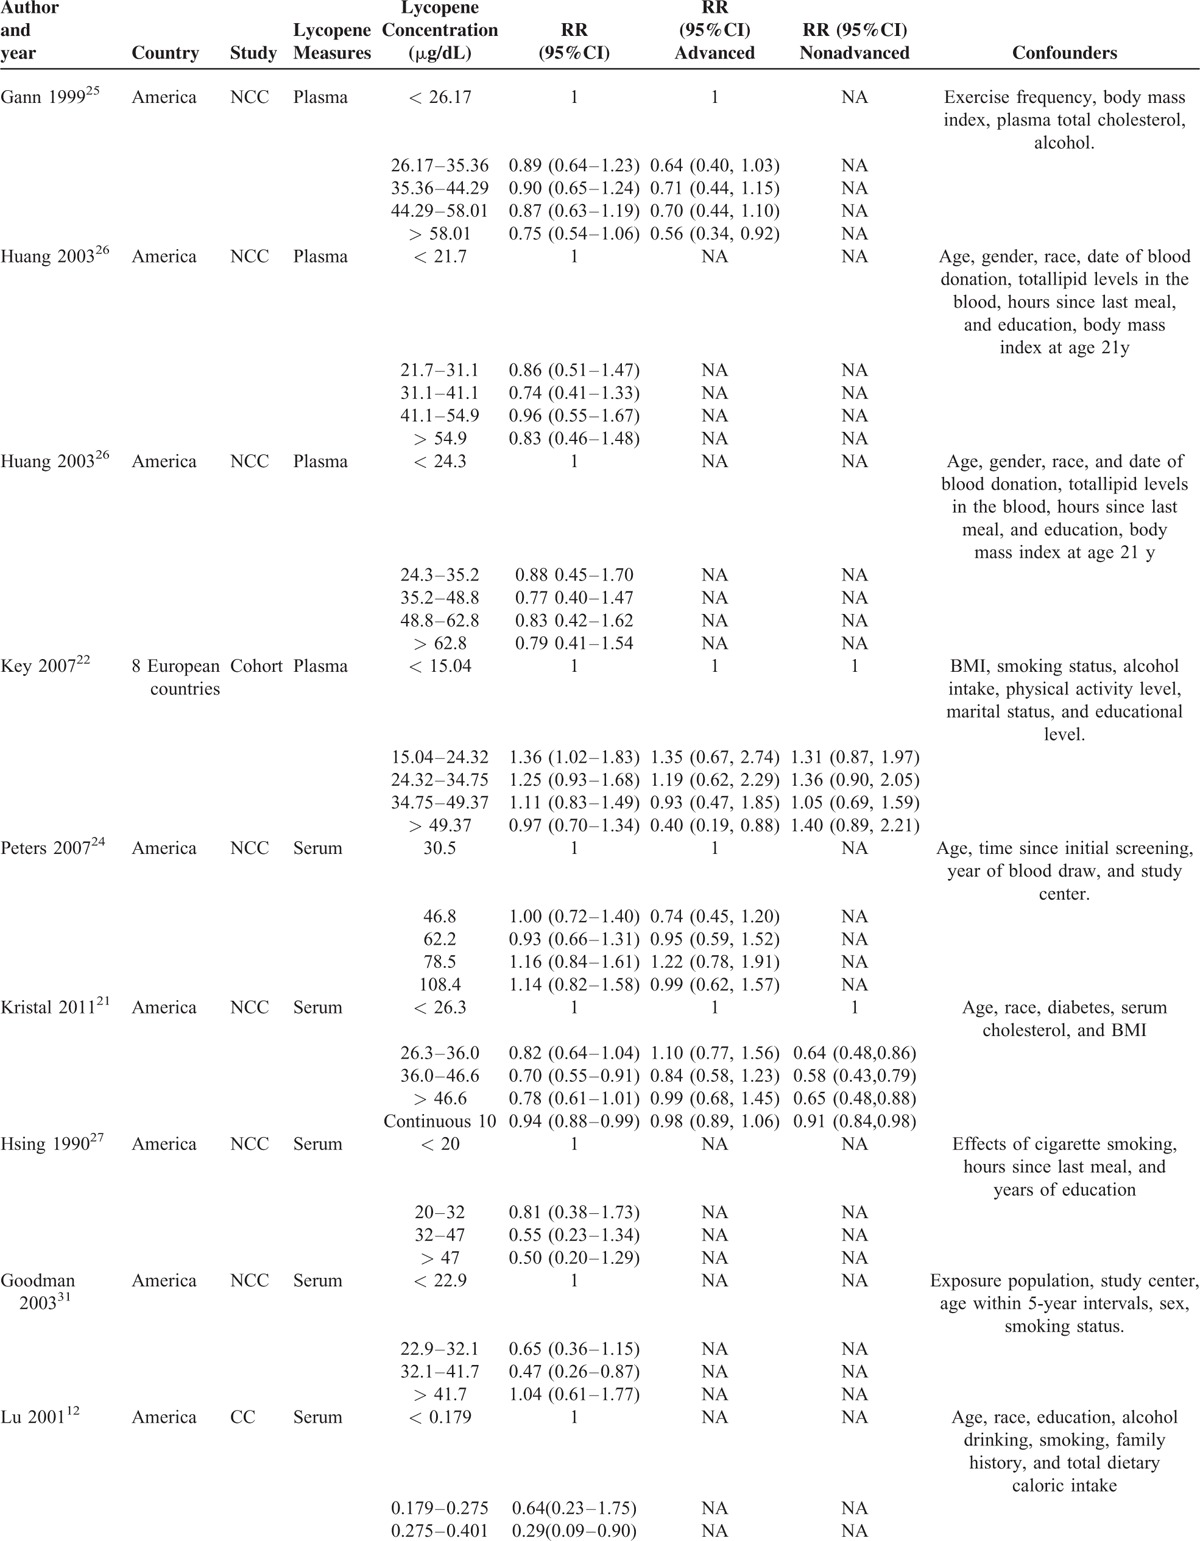
TABLE 3.
Detailed Outcomes on Plasma/Serum Lycopene Concentration and RRs of Prostate Cancer
Lycopene Intake and Risk of PCa
A total of 13 studies7–14,16–20 reported the relevant risk of PCa with lycopene supplementation, including 8 CC studies7–14 and 5 NCC or cohort studies.16–20 All of these studies provided complete data allowing dose–response meta-analysis.
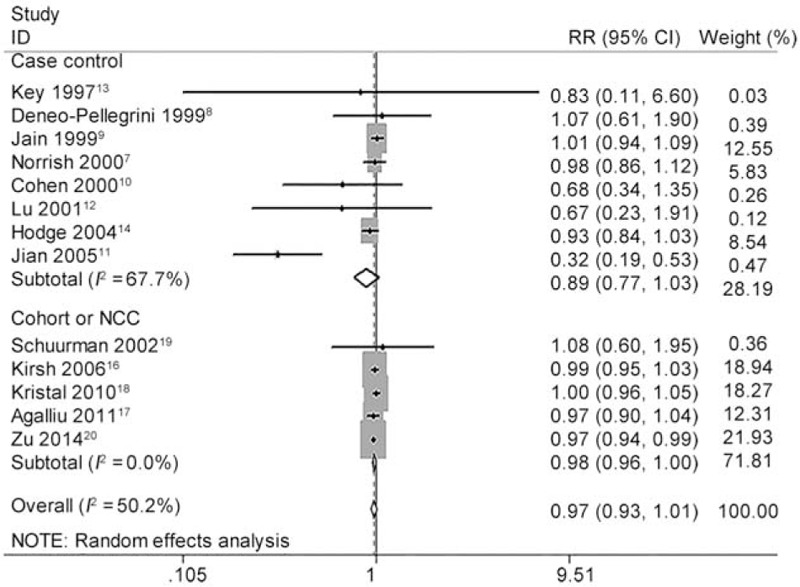
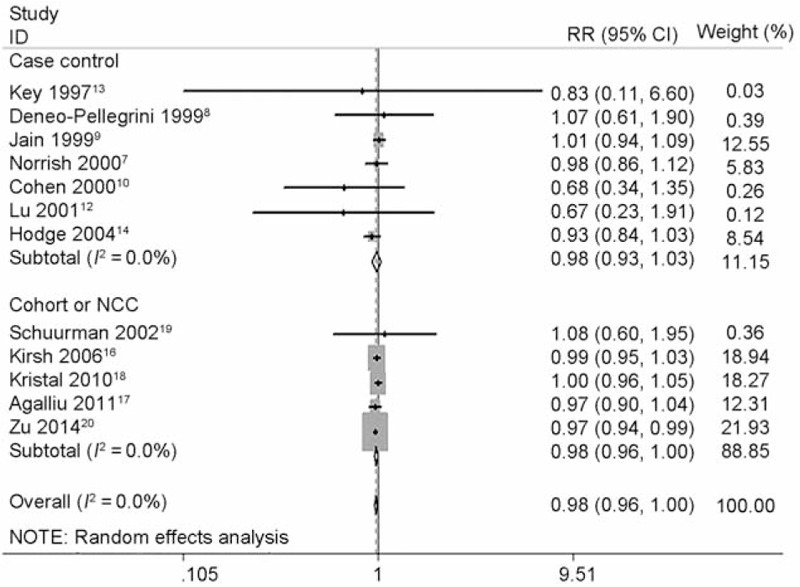
As shown in Figure 2, the pooled RR of highest vs. lowest category of total lycopene intake was 0.910 (95% CI 0.819 to 1.011, P = 0.078) for all studies, 0.813 (95% CI 0.629 to 1.052, P = 0.115) for CC studies, 0.939 (95% CI 0.880 to 1.003, P = 0.061) for NCC or cohort studies. Although no statistical significance was found, higher lycopene intake showed a trend to reduce the incidence of PCa. We further carried out several sensitivity analyses. Heterogeneity between studies was mainly caused by 1 Chinese study.11 After this study was excluded, there was no longer any evidence of significant heterogeneity for highest vs. lowest categories of total lycopene intake (I2 changed from 45.5% to 0.0%). Moreover, the overall pooled estimates (RR 0.935, 95% CI 0.881 to 0.993, P = 0.030) became significant without this study (Figure 3). The heterogeneity test showed moderate heterogeneity (I2 = 45.5%, P = 0.037) among all studies, moderate heterogeneity (I2 = 60.6%, P = 0.013) among CC studies and little heterogeneity (I2 = 0.0%, P = 0.504) among NCC or cohort studies (Table 5).
FIGURE 2.
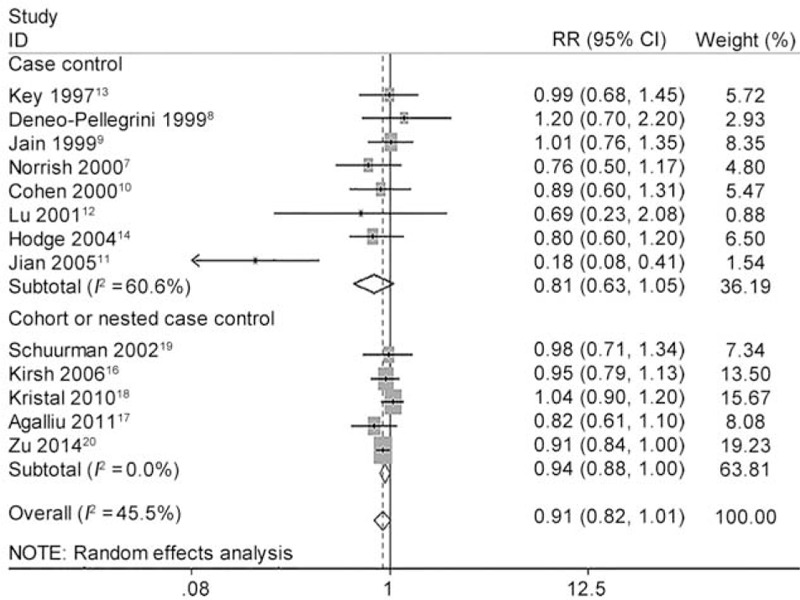
Forest plot for the association of highest vs. lowest categories of dietary lycopene consumption and the risk of prostate cancer (PCa). The association was indicated as relative risk (RR) estimate with the corresponding 95% confidence interval (CI). The RR estimate of each study is marked with a solid black square. The size of the square represents the weight that the corresponding study exerts in the meta-analysis. The CIs of pooled estimates are displayed as a horizontal line through the diamond. RR <1 indicates decreased risk of PCa.
FIGURE 3.
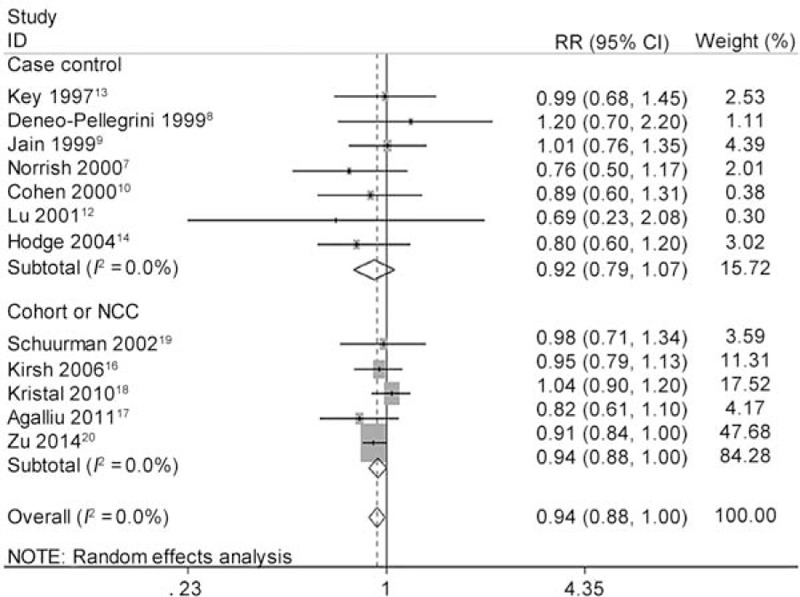
Forest plot for dose–response association of highest vs. lowest categories of dietary lycopene consumption and the risk of prostate cancer (PCa) after sensitivity analysis and removing one Chinese study. The association was indicated as relative risk (RR) with the corresponding 95% confidence interval (CI). The RR estimate of each study is marked with a solid black square. The size of the square represents the weight that the corresponding study exerts in the meta-analysis. The CIs of pooled estimates are displayed as a horizontal line through the diamond. RR <1 indicates decreased risk of PCa.
TABLE 3 (Continued).
Detailed Outcomes on Plasma/Serum Lycopene Concentration and RRs of Prostate Cancer
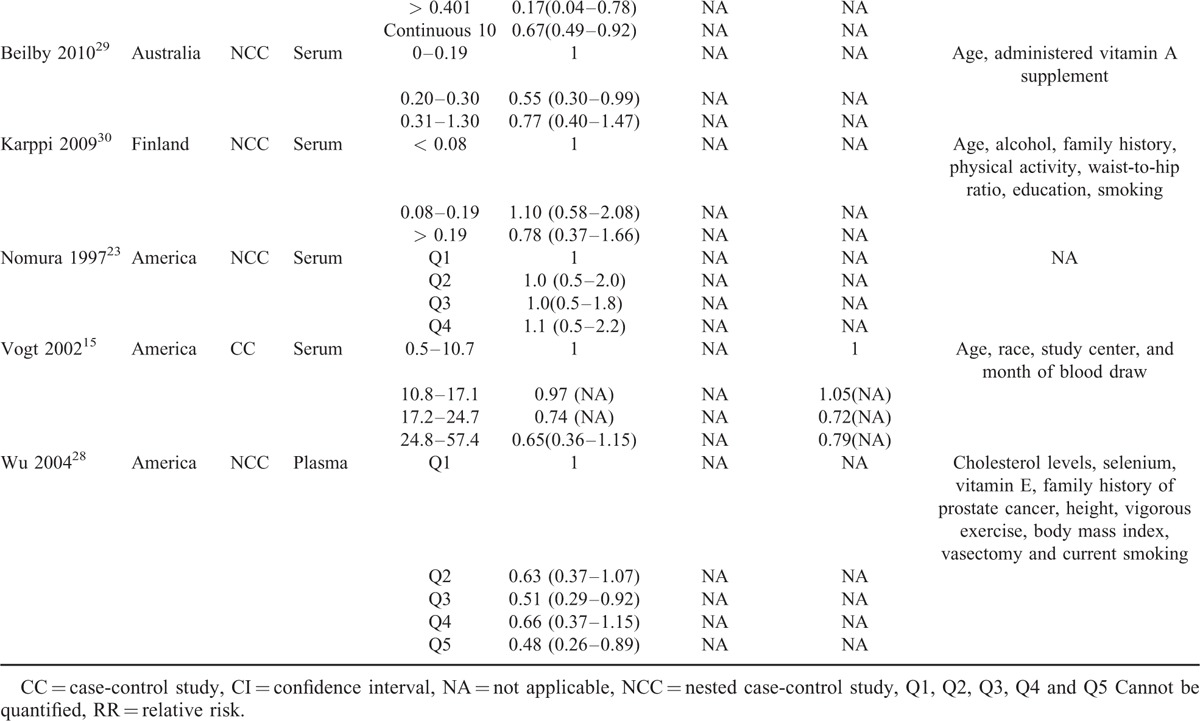
TABLE 5.
Study Subgroup Pooled Risk Estimates for Lycopene Intake and Prostate Cancer
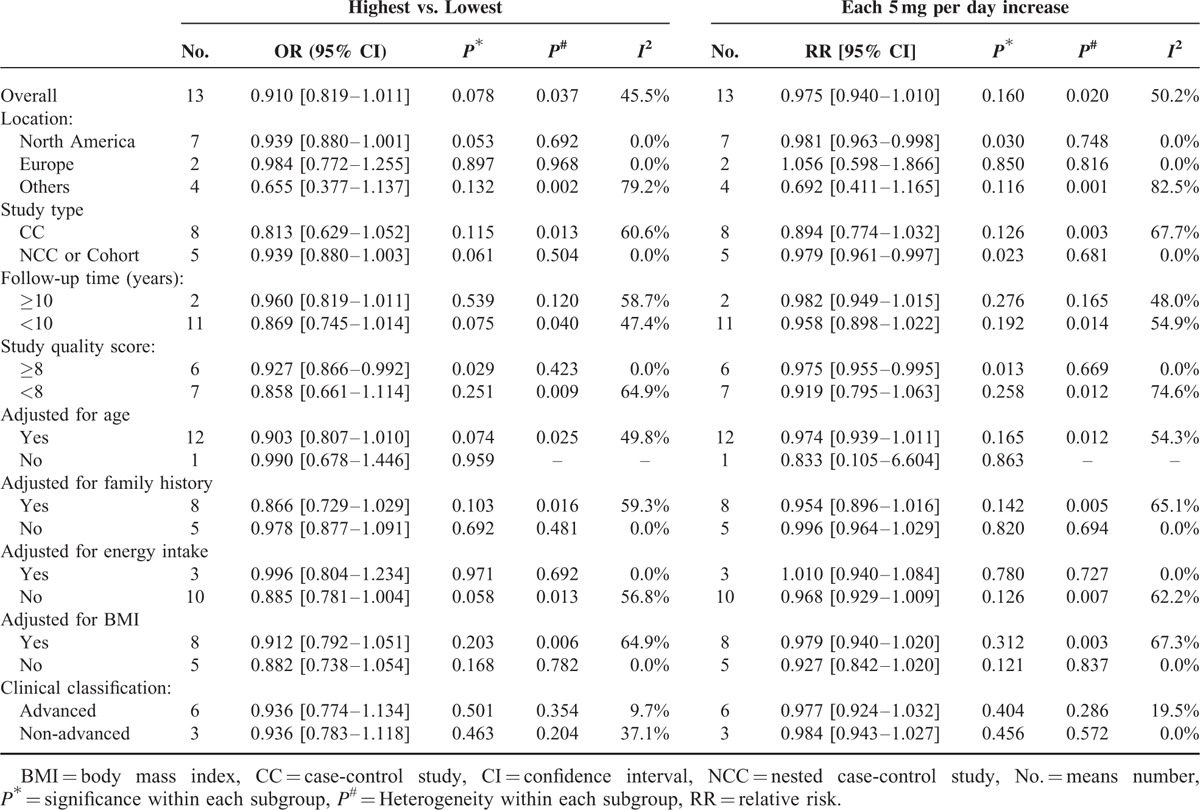
Dose–response meta-analysis further showed each 5 mg/day increase of lycopene intake decreased the risk of PCa with RR 0.975 (95% CI 0.940 to 1.010, P = 0.160) for all studies, 0.894 (95% CI 0.774 to 1.032, P = 0.126) for CC studies and 0.979 (95% CI 0.961 to 0.997, P = 0.023) for NCC or cohort studies (Figure 4). The heterogeneity test showed moderate heterogeneity (I2 = 50.2%, P = 0.020) among all studies. Again, as shown in Figure 5, there was no longer any evidence of significant heterogeneity for each 5 mg/day increase of lycopene intake on decreasing risk of PCa (I2 changed from 50.2% to 0.0%) when excluded the Chinese study11 with pooled estimate (RR 0.979, 95% CI 0.962 to 0.996, P = 0.017) for all studies quite similar to the pooled estimate (RR 0.979, 95% CI 0.961 to 0.997, P = 0.023) for NCC or cohort studies or consistent with the pooled estimate (RR 0.975, 95% CI 0.995 to 0.995, P = 0.013) of high-quality studies (study quality score ≥ 8). Figure 5 also demonstrated that PCa incidence almost lowered by 2.1%. The linear test showed there was a linear relationship between each 5 mg/day increase of lycopene intake on decreasing PCa risk (chi-square = 6.29, P = 0.012) without any heterogeneity (P = 0.109). Accordingly, the nonlinear test showed there was no nonlinear relationship (chi-square = 0.00, P = 0.953). Compared with reference dose (0.1 mg), the approximate RRs of each dose of lycopene intake were as follows: 0.99 (95% CI 0.96 to 1.01) for 3 mg, 0.97 (95% CI 0.93 to 1.01) for 6 mg, 0.96 (95% CI 0.92 to 1.00) for 9 mg, 0.95 (95% CI 0.90 to 0.99) for 12 mg, 0.94 (95% CI 0.89 to 0.99) for 15 mg, 0.92 (95% CI 0.86 to 0.98) for 18 mg and 0.91 (95% CI 0.84 to 0.99) for 21 mg, which were summarized in Figure 6 presenting the trend of simulative dose–response effect and demonstrated that higher lycopene consumption (9 to 21 mg/d) was inversely associated with a reduced risk of PCa.
FIGURE 4.
Forest plot for dose–response association of each 5 mg/day increase of lycopene intake with the risk of prostate cancer (PCa). The association was indicated as relative risk (RR) with the corresponding 95% confidence interval (CI). The RR estimate of each study is marked with a solid black square. The size of the square represents the weight that the corresponding study exerts in the meta-analysis. The CIs of pooled estimates are displayed as a horizontal line through the diamond. RR <1 indicates decreased risk of PCa.
FIGURE 5.
Forest plot for dose–response association of each 5 mg/day increase of lycopene intake with the risk of prostate cancer (PCa) after sensitivity analysis and removing one Chinese study. The association was indicated as relative risk (RR) with the corresponding 95% confidence interval (CI). The RR estimate of each study is marked with a solid black square. The size of the square represents the weight that the corresponding study exerts in the meta-analysis. The CIs of pooled estimates are displayed as a horizontal line through the diamond. RR <1 indicates decreased risk of PCa.
FIGURE 6.
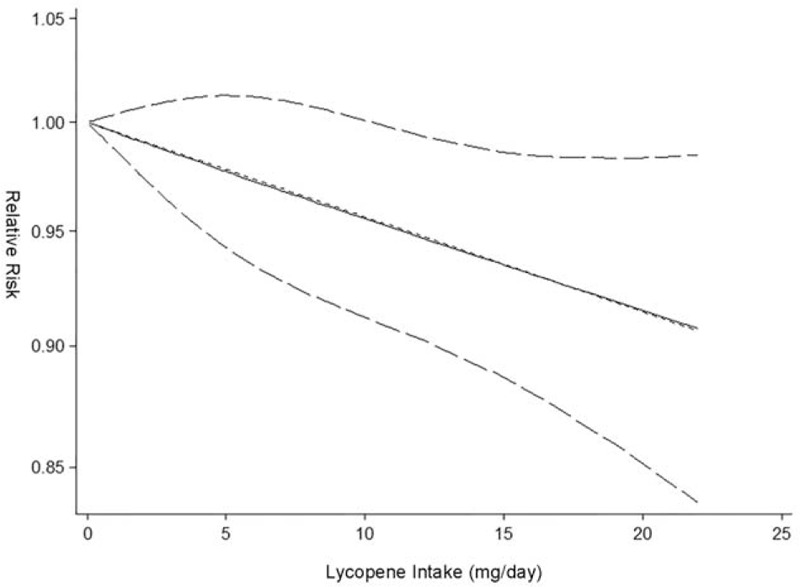
Dose–response analysis of lycopene consumption and risk of prostate cancer. The solid black line and 2 dotted black lines are the restricted cubic spline for the published relative risks (RR) and 95% confidence intervals (CIs); the short dash straight line is the linear fitting curve used for linear and nonlinear analysis.
Circulating Lycopene Concentrations and Risk of PCa
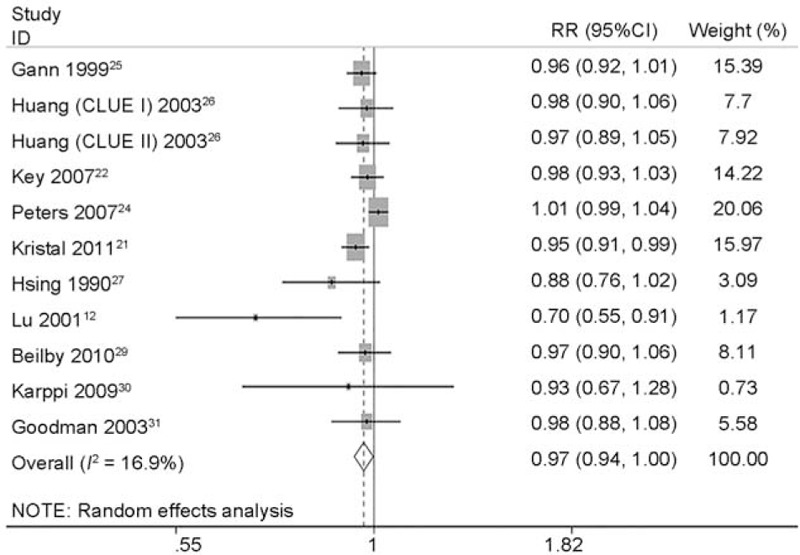
Totally, 14 studies12,15,21–31 (2 CC studies12,15 and 12 NCC or cohort studies)21–31 reported the association between circulating concentrations and risk of PCa. Figure 7 describes the pooled RR and relevant 95% CI of highest vs. lowest categories was 0.821 (95% CI 0.711 to 0.949, P = 0.008) for all studies, 0.399 (95% CI 0.112 to 1.412, P = 0.154) for case-control studies and 0.850 (95% CI 0.748 to 0.965, P = 0.012) for NCC or cohort studies. A heterogeneity test showed little heterogeneity (I2 = 16.9%, P = 0.269) among all studies, middle heterogeneity (I2 = 63.2%, P = 0.099) among CC studies and little heterogeneity (I2 = 0.0%, P = 0.490) among NCC or cohort studies (Table 6). Sensitivity analyses showed the overall evaluation was robust by removing each study.
FIGURE 7.
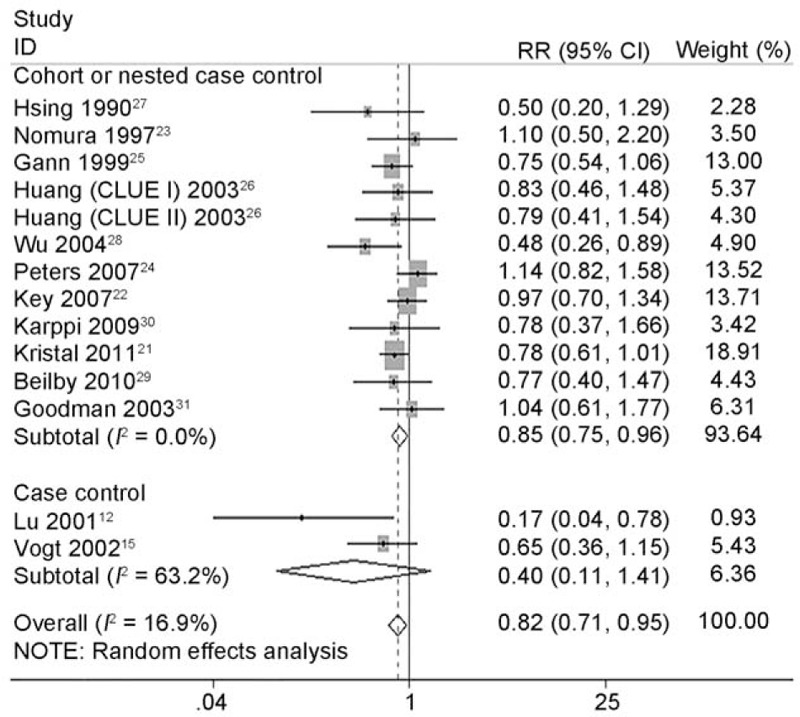
Forest plot for dose–response association of highest vs. lowest categories of circulating lycopene concentrations and the risk of prostate cancer (PCa). The association was indicated as relative risk (RR) with the corresponding 95% confidence interval (CI). The RR estimate of each study is marked with a solid black square. The size of the square represents the weight that the corresponding study exerts in the meta-analysis. The CIs of pooled estimates are displayed as a horizontal line through the diamond. RR <1 indicates decreased risk of PCa.
TABLE 4.
Quality Assessment of Studies Included in Meta-Analyses, Using the Newcastle-Ottawa Scale for Assessing Cohort Studies
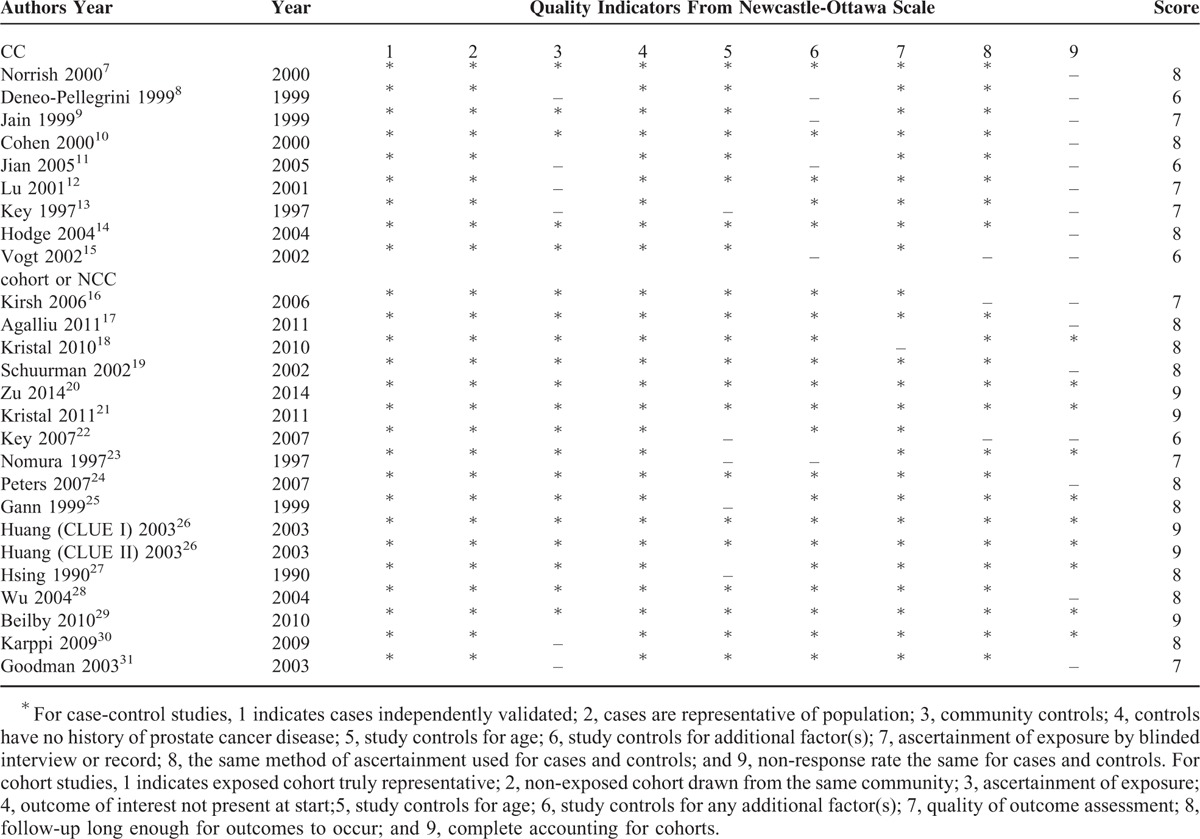
TABLE 6.
Study Subgroup Pooled Risk Estimates for Plasma/Serum Lycopene Concentration and Prostate Cancer

As depicted in Figure 8, dose–response meta-analysis of 11 studies included in 10 articles12,21,22,24–27,29–31 further showed the RR and relevant 95% CI of each 10 μg/dL increase of circulating concentrations was 0.970 (95% CI 0.943 to 0.997, P = 0.030) with a middle heterogeneity (I2 = 43.7%, P = 0.059). Consistent with lycopene intake, higher circulating concentrations significantly reduced the risk of PCa by 3.0%. The nonlinear test showed a nonlinear relationship (chi-square = 3.88, P = 0.049) between circulating concentrations and the risk of PCa without any heterogeneity (P = 0.260). Compared with reference dose (2.15 μg/dL), Figure 9 showed the approximate RRs of each dose of circulating concentration were as follows: 0.95 96 (95% CI 0.93 to 0.99) for 10 μg/dL, 0.92 (95% CI 0.86 to 0.97) for 20 μg/dL, 0.88 (95% CI 0.80 to 0.96) for 30 μg/dL, 0.86 (95% CI 0.77 to 0.95) for 40 μg/dL, 0.85 (95% CI 0.76 to 0.94), 0.85 (95% CI 0.76 to 0.94) for 60 μg/dL, 0.86 (95% CI 0.77 to 0.94) for 70 μg/dL, 0.87 (95% CI 0.76 to 0.99) for 80 μg/dL, 0.88 (95% CI 0.76 to 1.01) for 90 μg/dL, 0.88 (95% CI 0.75 to 1.05) for 100 μg/dL and 0.89 (95% CI 0.74 to 1.08) for 110 μg/dL. It was observed a range from 2.15 to 85 μg/dL circulating concentrations which could decrease PCa incidence.
FIGURE 8.
Forest plot for dose–response association of each 10 μg/dL increase of circulating lycopene concentrations with the risk of prostate cancer (PCa). The association was indicated as relative risk (RR) with the corresponding 95% confidence interval (CI). The RR estimate of each study is marked with a solid black square. The size of the square represents the weight that the corresponding study exerts in the meta-analysis. The CIs of pooled estimates are displayed as a horizontal line through the diamond. RR <1 indicates decreased risk of PCa.
FIGURE 9.

Dose–response analysis of circulating lycopene concentrations and risk of prostate cancer. The solid black line and 2 dotted black lines are the restricted cubic spline for the published relative risks (RRs) and 95% confidence intervals (CIs); the short dash straight line is the linear fitting curve used for linear and nonlinear analysis.
Subgroup Analyses
As shown in Table 5, subgroup analyses found lycopene intake and the risk of PCa did not differ substantially according to location, study type, duration of follow-up, clinical classification, adjustment for various important confounders such as age, family history, energy intake, BMI. However, it became statistically different with the overall pooled estimate 0.927 (95% CI 0.866 to 0.992, P = 0.029) when stratifying by study quality. We also found an inverse association between each 5 mg/day increase of lycopene intake and decreased risk of PCa only for high-quality studies (RR 0.975, 95% CI 0.955 to 0.995, P = 0.013). Similarly, Table 6 shows subgroup analyses of circulating concentrations and risk of PCa. There was no significant difference when stratified by location, clinical classification, and adjustment for family history or energy intake. But significant difference was found when classified by study quality, study type, follow-up duration, and adjustment for age or BMI. The inverse associations between circulating concentrations and decreased risk of PCa were indicated for high-quality studies (RR 0.805, 95% CI 0.692 to 0.936, P = 0.005), NCC or cohort studies (RR 0.850, 95% CI 0.748 to 0.965, P = 0.012), studies in which follow-up duration ≥ 10 years (RR 0.801, 95% CI 0.681 to 0.942, P = 0.007), studies adjusted by age (RR 0.828, 95% CI 0.696 to 0.984, P = 0.032) and studies adjusted by BMI (RR 0.792, 95% CI 0.679 to 0.925, P = 0.003).
Publication Bias
For dose–response meta-analysis of each 5 mg/day increase of lycopene intake and the risk of PCa, Begg's rank correlation test (P = 0.200) and Egger's linear regression test (P = 0.220) indicated no publication bias. For dose–response meta-analysis of each 10 μg/dL increase of circulating concentrations and the risk of PCa, Begg's rank correlation test (P = 0.350) also indicated no publication bias whereas Egger's linear regression test (P = 0.026) indicated publication bias existed. Trim and fill methods were used to recalculate our pooled risk estimate and found the imputed risk estimate was 0.970 (95% CI 0.943 to 0.997) in the random model and 0.980 (95% CI 0.963 to 0.997) in the fixed model, which is identical to our original risk estimate. No missing studies were imputed in the contour enhanced funnel plot.
DISCUSSION
To our knowledge, this is the first dose–response meta-analysis to systematically and quantitatively evaluate the association of lycopene intake or circulating concentrations and PCa risk. Our novel data demonstrates lycopene could significantly reduce the incidence of PCa with a linear and nonlinear dose–response effect for its intake and circulating concentration, respectively.
Although we did not find an inverse association between lycopene consumption and the risk of PCa incidence for all studies, there was a trend for higher lycopene levels to reduce the incidence of PCa with a P value of 0.078. After removing one Chinese study11 in sensitivity analyses or recalculating only high-quality studies in subgroup analysis, it indeed significantly lowered PCa risk. Our dose–response meta-analysis further demonstrated that higher lycopene consumption (9 to 21 mg/d) was linearly associated with a reduced risk of PCa by 2.1%. A randomized controlled trial (RCT) with 40 participants conducted by Mohanty et al59 found that 8 mg/d lycopene intake for 1 year was not inversely associated with PCa risk (RR 0.33, 95% CI 0.08 to 1.46). The ideal daily intake of lycopene is unknown, although it has been suggested that a daily intake of 6 mg may be sufficient.60
Moreover, the association did not differ substantially between subgroups stratified by location, study type, duration of follow-up, or clinical classification. For various important confounders such as age, family history, energy intake, and BMI, there was no statistical difference if they were adjusted. The heterogeneity could contribute to the insignificance. When one Chinese study was excluded or just high-quality studies were analyzed, lycopene intake was observed to significantly decrease the risk of PCa.
As variations of lycopene content in food, long-term dietary intake of lycopene cannot be accurately estimated via food–frequency questionnaire, diet records, or diet history, circulating concentrations might provide a more accurate estimation of intake. Indeed, little heterogeneity was found for all studies on circulating lycopene levels and PCa risk. Consistently, higher circulating lycopene levels significantly reduced the risk of PCa. Interestingly, our dose–response meta-analysis further proved higher circulating concentrations had a nonlinear association with the decreased PCa incidence by 3.0% for each 10 μg/dL rise of its circulating levels with a threshold around 2.17 to 110 μg/dL. The concentration of circulating lycopene between 2.17 and 85 μg/dL was linearly inversed with PCa risk whereas there was no linear association >85 μg/dL. The value effect for doses > 85 μg/dL was hampered because there were only 3 different doses >85 μg/dL (87.02, 94.20, and 108.40) in the current analysis. After these 3 doses removed, a linear inverse association existed within the threshold 2.17 to 85 μg/dL (chi-square = 6.06, P = 0.014) without any heterogeneity (P = 0.177), completely consistent with the curve of lycopene consumption described above. In addition, more evidence for the efficacy of circulating concentrations of lycopene on preventing PCa was found for high-quality studies including NCC or cohort studies, studies following-up >10 years and studies adjusted by age or BMI. Thus, age and BMI were assumed as independent risk factors for PCa, which is consistent to a clinical investigation conducted by Jose et al61 and a recent dose-response meta-analysis conducted by Hu et al.62 Jose et al depicted that prevalence of PCa was estimated to increase on average from 16% in men aged 50–59 years to 69% in men aged 90–99 years. Hu et al observed a 5 kg/m2 increase in BMI was associated with a 15% higher risk of PCa detection (OR, 1.15; 95% CI, 0.98–1.34). As there was only 6 (advanced) and 3 (nonadvanced) studies reported RR of lycopene and PCa, the null effect of lycopene on PCa progression could resulted from the limited studies.
The current review of 26 studies with 563,299 participants found both lycopene supplementation and circulating concentrations exhibited a preventive effect on PCa. Also, the meta-analysis of 21 observational studies from 1950 s to 2003 by Etminan et al32 demonstrated both the highest category of lycopene intake (RR 0.89, 95% CI 0.81 to 0.98) and circulating concentrations (RR 0.74, 95% CI 0.59 to 0.92) were associated with a significant lower risk of PCa, although no dose-effect was analyzed. In contrast, a recent meta-analysis of 17 studies published in 2013 by Chen et al33 reported the highest category of lycopene intake or circulating concentrations did not prevent PCa risk (OR 0.93, 95% CI 0.86 to 1.01 and OR 0.97, 95% CI 0.88 to 1.08, respectively). This study did not include the case control studies nor perform dose–response analysis. However, Chen et al still concluded that tomatoes do play a modest role in the prevention of PCa and suggested further research would be needed. Indeed, a 24-years follow-up high-quality NCC study20 including 51,529 US healthy men was published in 2014 and suggested reduced odds of PCa for those with highest lycopene intake when compared to those with lowest lycopene intake (HR 0.91, 95% CI 0.84 to 1.00). Current review incorporated this latest study, which further improved our meta-analysis.
As a powerful antioxidant agent with potential anticancer properties,6 lycopene has many biochemical actions of which antiproliferative insulin-like growth factor-1 inhibition, differentiation and apoptosis, connexin and gap junctional intercellular communication are identified as the most relevant in preventing carcinogenesis. Additionally, Zu et al20 evaluated tumor biomarkers and found that high lycopene intake can suppress the neoangiogenesis in the tumor based on the vessel size and shape by regulating vascular endothelial growth factor.63 Elgass et al64 reported lycopene inhibited angiogenesis in vitro by using human umbilical vein endothelial cells. Chen et al65 showed the mechanism for antiangiogenic activity of lycopene may involve PI3K-Akt and ERK/p38 signaling pathways.
Strengths and Limitations
Generating dose–response curves along with comparisons of high and low lycopene intake or circulating concentrations strengthened the quality of this meta-analysis. The pooled estimates for adjusted models were used to reduce the heterogeneity. Sensitivity analyses and subgroup analyses were conducted to examine the sources of heterogeneity and evaluate robustness. However, several limitations should also be concentrated. Errors in measurement were inevitable for lycopene intake being assessed by food frequency questionnaires in different countries. In addition, the association between lycopene and PCa risk could be impacted for only several studies adjusted for family history. Furthermore, different classifications of lycopene from fruit and vegetables were used across studies.
CONCLUSIONS
In summary, our dose–response meta-analysis indicates a significant linear dose–response association between lycopene intake and PCa risk, but a significant nonlinear dose–response association between circulating concentrations and PCa risk. Further high-quality research data are required to substantiate these conclusions in populations with high lycopene intake and circulating concentrations.
Acknowledgments
We thank Yi Guo who is an epidemiologist at school of public health in Wuhan University for his help to guide and ensure all analysis.
The authors thank Dr. Kelvin P. Davies, Professor and director of Department of Urology & Institute of Smooth Muscle Biology, Albert Einstein College of Medicine, for manuscript revision.
Footnotes
Abbreviations: BMI = body mass index, CC = case-control, CI = confidence interval, HR = Hazard Ratio, MOOSE = Meta-analysis of Observational Studies in Epidemiology, NCC = nested case-control, OR = odd risk, PCa = prostate cancer, RO = risk ratio, RR = relative risk.
PC and WZ contributed equally to this study.
XHZ is supported by National Natural Science Foundation of China (N.81270843 and N.81160086).
All authors have fulfilled all conditions required for authorship. PC, WHZ, XHW and XHZ conceived and designed the study. XW, KKZ, DSN, ZL, and QM performed the electronic search, selected studies, extracted data and performed quality assessment. PC, WHZ and XHZ analyzed data and conducted meta-analysis. PC, XHZ, XW and WHZ supervised the research, edited and drafted revisions to the article.
The authors have no conflicts of interest to disclose.
REFERENCES
- 1.Ferlay J, Soerjomataram I, Dikshit R, et al. Cancer incidence and mortality worldwide: sources, methods and major patterns in GLOBOCAN 2012. Int J Cancer 2015; 136:E359–E386. [DOI] [PubMed] [Google Scholar]
- 2.Ambrosini GL, Fritschi L, de Klerk NH, et al. Dietary patterns identified using factor analysis and prostate cancer risk: a case control study in Western Australia. Ann Epidemiol 2008; 18:364–370. [DOI] [PubMed] [Google Scholar]
- 3.Chen W, Zheng R, Zeng H, et al. Annual report on status of cancer in China, 2011. Chin J Cancer Res 2015; 27:2–12. [DOI] [PMC free article] [PubMed] [Google Scholar]
- 4.Han S, Zhang S, Chen W, et al. Analysis of the status and trends of prostate cancer incidence in China. Chin Clin Oncol 2013; 18:330–334. [Google Scholar]
- 5.Kavanaugh CJ, Trumbo PR, Ellwood KC, et al. Food and Drug Administration's evidence-based review for qualified health claims: tomatoes, lycopene, and cancer. J Natl Cancer Inst 2007; 99:1074–1085. [DOI] [PubMed] [Google Scholar]
- 6.Rackley JD, Clark PE, Hall MC. Complementary and alternative medicine for advanced prostate cancer. Urol Clin North Am 2006; 33:237–246. [DOI] [PubMed] [Google Scholar]
- 7.Norrish AE, Jackson RT, Sharpe SJ, et al. Prostate cancer and dietary carotenoids. Am J Epidemiol 2000; 151:119–123. [DOI] [PubMed] [Google Scholar]
- 8.Deneo-Pellegrini H, De Stefani E, Ronco A, et al. Foods, nutrients and prostate cancer: a case-control study in Uruguay. Br J Cancer 1999; 80:591–597. [DOI] [PMC free article] [PubMed] [Google Scholar]
- 9.Jain MG, Hislop GT, Howe GR, et al. Plant foods, antioxidants, and prostate cancer risk: findings from case-control studies in Canada. Nutr Cancer 1999; 34:173–184. [DOI] [PubMed] [Google Scholar]
- 10.Cohen JH, Kristal AR, Stanford JL. Fruit and vegetable intakes and prostate cancer risk. J Natl Cancer Inst 2000; 92:61–68. [DOI] [PubMed] [Google Scholar]
- 11.Jian L, Du CJ, Lee AH, et al. Do dietary lycopene and other carotenoids protect against prostate cancer? Int J Cancer 2005; 113:1010–1014. [DOI] [PubMed] [Google Scholar]
- 12.Lu QY, Hung JC, Heber D, et al. Inverse associations between plasma lycopene and other carotenoids and prostate cancer. Cancer Epidemiol Biomarkers Prev 2001; 10:749–756. [PubMed] [Google Scholar]
- 13.Key TJ, Silcocks PB, Davey GK, et al. A case-control study of diet and prostate cancer. Br J Cancer 1997; 76:678–687. [DOI] [PMC free article] [PubMed] [Google Scholar]
- 14.Hodge AM, English DR, McCredie MR, et al. Foods, nutrients and prostate cancer. Cancer Causes Control 2004; 15:11–20. [DOI] [PubMed] [Google Scholar]
- 15.Vogt TM, Mayne ST, Graubard BI, et al. Serum lycopene, other serum carotenoids, and risk of prostate cancer in US Blacks and Whites. Am J Epidemiol 2002; 155:1023–1032. [DOI] [PubMed] [Google Scholar]
- 16.Kirsh VA, Mayne ST, Peters U, et al. A prospective study of lycopene and tomato product intake and risk of prostate cancer. Cancer Epidemiol Biomarkers Prev 2006; 15:92–98. [DOI] [PubMed] [Google Scholar]
- 17.Agalliu I, Kirsh VA, Kreiger N, et al. Oxidative balance score and risk of prostate cancer: results from a case-cohort study. Cancer Epidemiol 2011; 35:353–361. [DOI] [PubMed] [Google Scholar]
- 18.Kristal AR, Arnold KB, Neuhouser ML, et al. Diet, supplement use, and prostate cancer risk: results from the prostate cancer prevention trial. Am J Epidemiol 2010; 172:566–577. [DOI] [PMC free article] [PubMed] [Google Scholar]
- 19.Schuurman AG, Goldbohm RA, Brants HA, et al. A prospective cohort study on intake of retinol, vitamins C and E, and carotenoids and prostate cancer risk (Netherlands). Cancer Causes Control 2002; 13:573–582. [DOI] [PubMed] [Google Scholar]
- 20.Zu K, Mucci L, Rosner BA, et al. Dietary lycopene, angiogenesis, and prostate cancer: a prospective study in the prostate-specific antigen era. J Natl Cancer Inst 2014; 106:djt430. [DOI] [PMC free article] [PubMed] [Google Scholar]
- 21.Kristal AR, Till C, Platz EA, et al. Serum lycopene concentration and prostate cancer risk: results from the Prostate Cancer Prevention Trial. Cancer Epidemiol Biomarkers Prev 2011; 20:638–646. [DOI] [PMC free article] [PubMed] [Google Scholar]
- 22.Key TJ, Appleby PN, Allen NE, et al. Plasma carotenoids, retinol, and tocopherols and the risk of prostate cancer in the European Prospective Investigation into Cancer and Nutrition study. Am J Clin Nutr 2007; 86:672–681. [DOI] [PubMed] [Google Scholar]
- 23.Nomura AM, Stemmermann GN, Lee J, et al. Serum micronutrients and prostate cancer in Japanese Americans in Hawaii. Cancer Epidemiol Biomarkers Prev 1997; 6:487–491. [PubMed] [Google Scholar]
- 24.Peters U, Leitzmann MF, Chatterjee N, et al. Serum lycopene, other carotenoids, and prostate cancer risk: a nested case-control study in the prostate, lung, colorectal, and ovarian cancer screening trial. Cancer Epidemiol Biomarkers Prev 2007; 16:962–968. [DOI] [PubMed] [Google Scholar]
- 25.Gann PH, Ma J, Giovannucci E, et al. Lower prostate cancer risk in men with elevated plasma lycopene levels: results of a prospective analysis. Cancer Res 1999; 59:1225–1230. [PubMed] [Google Scholar]
- 26.Huang HY, Alberg AJ, Norkus EP, et al. Prospective study of antioxidant micronutrients in the blood and the risk of developing prostate cancer. Am J Epidemiol 2003; 157:335–344. [DOI] [PubMed] [Google Scholar]
- 27.Hsing AW, Comstock GW, Abbey H, et al. Serologic precursors of cancer. Retinol, carotenoids, and tocopherol and risk of prostate cancer. J Natl Cancer Inst 1990; 82:941–946. [DOI] [PubMed] [Google Scholar]
- 28.Wu K, Erdman JW, Jr, Schwartz SJ, et al. Plasma and dietary carotenoids, and the risk of prostate cancer: a nested case-control study. Cancer Epidemiol Biomarkers Prev 2004; 13:260–269. [DOI] [PubMed] [Google Scholar]
- 29.Beilby J, Ambrosini GL, Rossi E, et al. Serum levels of folate, lycopene, beta-carotene, retinol and vitamin E and prostate cancer risk. Eur J Clin Nutr 2010; 64:1235–1238. [DOI] [PubMed] [Google Scholar]
- 30.Karppi J, Kurl S, Nurmi T, et al. Serum lycopene and the risk of cancer: the Kuopio Ischaemic Heart Disease Risk Factor (KIHD) study. Ann Epidemiol 2009; 19:512–518. [DOI] [PubMed] [Google Scholar]
- 31.Goodman GE, Schaffer S, Omenn GS, et al. The association between lung and prostate cancer risk, and serum micronutrients: results and lessons learned from beta-carotene and retinol efficacy trial. Cancer Epidemiol Biomarkers Prev 2003; 12:518–526. [PubMed] [Google Scholar]
- 32.Etminan M, Takkouche B, Caamano-Isorna F. The role of tomato products and lycopene in the prevention of prostate cancer: a meta-analysis of observational studies. Cancer Epidemiol Biomarkers Prev 2004; 13:340–345. [PubMed] [Google Scholar]
- 33.Chen J, Song Y, Zhang L. Lycopene/tomato consumption and the risk of prostate cancer: a systematic review and meta-analysis of prospective studies. J Nutr Sci Vitaminol (Tokyo) 2013; 59:213–223. [DOI] [PubMed] [Google Scholar]
- 34.Stroup DF, Berlin JA, Morton SC, et al. Meta-analysis of observational studies in epidemiology: a proposal for reporting. Meta-analysis of Observational Studies in Epidemiology (MOOSE) group. JAMA 2000; 283:2008–2012. [DOI] [PubMed] [Google Scholar]
- 35.Orsini N, Li R, Wolk A, et al. Meta-analysis for linear and nonlinear dose-response relations: examples, an evaluation of approximations, and software. Am J Epidemiol 2012; 175:66–73. [DOI] [PMC free article] [PubMed] [Google Scholar]
- 36.Yoshimura I. The effect of measurement error on the dose-response curve. Environ Health Persp 1990; 87:173–178. [DOI] [PMC free article] [PubMed] [Google Scholar]
- 37.Wells GA, Shea B, O’Connell D, et al. The Newcastle-Ottawa Scale (NOS) for assessing the quality of nonrandomised studies in meta-analyses. 2011. www.ohri.ca/programs/clinical_epidemiology/oxford.asp. Accessed December 2014. [Google Scholar]
- 38.Greenland S, Longnecker MP. Methods for trend estimation from summarized dose-response data, with applications to meta-analysis. Am J Epidemiol 1992; 135:1301–1309. [DOI] [PubMed] [Google Scholar]
- 39.Jackson D, White IR, Thompson SG. Extending DerSimonian and Laird's methodology to perform multivariate random effects meta-analyses. Stat Med 2010; 29:1282–1297. [DOI] [PubMed] [Google Scholar]
- 40.Harrell FE, Jr, Lee KL, Pollock BG. Regression models in clinical studies: determining relationships between predictors and response. J Natl Cancer Inst 1988; 80:1198–1202. [DOI] [PubMed] [Google Scholar]
- 41.Orsini N, Bellocco R, Greenland S. Generalized least squares for trend estimation of summarized dose-response data. Stata J 2006; 6:40–57. [Google Scholar]
- 42.Higgins JP, Thompson SG. Quantifying heterogeneity in a meta-analysis. Stat Med 2002; 21:1539–1558. [DOI] [PubMed] [Google Scholar]
- 43.Peters JL, Sutton AJ, Jones DR, et al. Contour-enhanced meta-analysis funnel plots help distinguish publication bias from other causes of asymmetry. J Clin Epidemiol 2008; 61:991–996. [DOI] [PubMed] [Google Scholar]
- 44.Egger M, Davey Smith G, Schneider M, et al. Bias in meta-analysis detected by a simple, graphical test. BMJ 1997; 315:629–634. [DOI] [PMC free article] [PubMed] [Google Scholar]
- 45.Begg CB, Mazumdar M. Operating characteristics of a rank correlation test for publication bias. Biometrics 1994; 50:1088–1101. [PubMed] [Google Scholar]
- 46.Duval S, Tweedie R. Trim and fill: a simple funnel-plot-based method of testing and adjusting for publication bias in meta-analysis. Biometrics 2000; 56:455–463. [DOI] [PubMed] [Google Scholar]
- 47.Stram DO, Hankin JH, Wilkens LR, et al. Prostate cancer incidence and intake of fruits, vegetables and related micronutrients: the multiethnic cohort study∗ (United States). Cancer Causes Control 2006; 17:1193–1207. [DOI] [PubMed] [Google Scholar]
- 48.Park E, Stacewicz-Sapuntzakis M, Sharifi R, et al. Diet adherence dynamics and physiological responses to a tomato product whole-food intervention in African-American men. Br J Nutr 2013; 109:2219–2230. [DOI] [PubMed] [Google Scholar]
- 49.Talvas J, Caris-Veyrat C, Guy L, et al. Differential effects of lycopene consumed in tomato paste and lycopene in the form of a purified extract on target genes of cancer prostatic cells. Am J Clin Nutr 2010; 91:1716–1724. [DOI] [PubMed] [Google Scholar]
- 50.van Breemen RB, Sharifi R, Viana M, et al. Antioxidant effects of lycopene in African American men with prostate cancer or benign prostate hyperplasia: a randomized, controlled trial. Cancer Prev Res (Phila) 2011; 4:711–718. [DOI] [PMC free article] [PubMed] [Google Scholar]
- 51.Bowen P, Chen L, Stacewicz-Sapuntzakis M, et al. Tomato sauce supplementation and prostate cancer: lycopene accumulation and modulation of biomarkers of carcinogenesis. Exp Biol Med (Maywood) 2002; 227:886–893. [DOI] [PubMed] [Google Scholar]
- 52.Van Blarigan EL, Ma J, Kenfield SA, et al. Plasma antioxidants, genetic variation in SOD2, CAT, GPX1, GPX4, and prostate cancer survival. Cancer Epidemiol Biomarkers Prev 2014; 23:1037–1046. [DOI] [PMC free article] [PubMed] [Google Scholar]
- 53.Parsons JK, Newman V, Mohler JL, et al. The Men's Eating and Living (MEAL) study: a Cancer and Leukemia Group B pilot trial of dietary intervention for the treatment of prostate cancer. Urology 2008; 72:633–637. [DOI] [PubMed] [Google Scholar]
- 54.Parsons JK, Newman VA, Mohler JL, et al. Dietary modification in patients with prostate cancer on active surveillance: a randomized, multicentre feasibility study. BJU Int 2008; 101:1227–1231. [DOI] [PubMed] [Google Scholar]
- 55.Kucuk O, Sarkar FH, Djuric Z, et al. Effects of lycopene supplementation in patients with localized prostate cancer. Exp Biol Med (Maywood) 2002; 227:881–885. [DOI] [PubMed] [Google Scholar]
- 56.Clark PE, Hall MC, Borden LS, Jr, et al. Phase I-II prospective dose-escalating trial of lycopene in patients with biochemical relapse of prostate cancer after definitive local therapy. Urology 2006; 67:1257–1261. [DOI] [PubMed] [Google Scholar]
- 57.Giovannucci E, Ascherio A, Rimm EB, et al. Intake of carotenoids and retinol in relation to risk of prostate cancer. J Natl Cancer Inst 1995; 87:1767–1776. [DOI] [PubMed] [Google Scholar]
- 58.Giovannucci E, Rimm EB, Liu Y, et al. A prospective study of tomato products, lycopene, and prostate cancer risk. J Natl Cancer Inst 2002; 94:391–398. [DOI] [PubMed] [Google Scholar]
- 59.Mohanty NK, Saxena S, Singh UP, et al. Lycopene as a chemopreventive agent in the treatment of high-grade prostate intraepithelial neoplasia. Urol Oncol 2005; 23:383–385. [DOI] [PubMed] [Google Scholar]
- 60.Porrini M, Riso P. What are typical lycopene intakes? J Nutr 2005; 135:2042S–2045S. [DOI] [PubMed] [Google Scholar]
- 61.Leal J, Hamdy F, Wolstenholme J. Estimating age and ethnic variation in the histological prevalence of prostate cancer to inform the impact of screening policies. Int.J Urol 2014; 21:786–792. [DOI] [PubMed] [Google Scholar]
- 62.Hu MB, Xu H, Bai PD, et al. Obesity has multifaceted impact on biochemical recurrence of prostate cancer: a dose-response meta-analysis of 36,927 patients. Med Oncol 2014; 31:829. [DOI] [PubMed] [Google Scholar]
- 63.Yang CM, Yen YT, Huang CS, et al. Growth inhibitory efficacy of lycopene and beta-carotene against androgen-independent prostate tumor cells xenografted in nude mice. Mol Nutr Food Res 2011; 55:606–612. [DOI] [PubMed] [Google Scholar]
- 64.Elgass S, Cooper A, Chopra M. Lycopene inhibits angiogenesis in human umbilical vein endothelial cells and rat aortic rings. Br J Nutr 2012; 108:431–439. [DOI] [PubMed] [Google Scholar]
- 65.Chen ML, Lin YH, Yang CM, et al. Lycopene inhibits angiogenesis both in vitro and in vivo by inhibiting MMP-2/uPA system through VEGFR2-mediated PI3K-Akt and ERK/p38 signaling pathways. Mol Nutr Food Res 2012; 56:889–899. [DOI] [PubMed] [Google Scholar]