

Supplemental Digital Content is available in the text
Abstract
To evaluate the effects of the new resistant starch (RS) formula, PPB-R-203, on glucose homeostasis in healthy subjects and subjects with type 2 diabetes.
A cohort consisting of 40 healthy participants received test and control diets and was checked for up to 3 hours post-meal. A randomized, 2-regimen, cross-over, comparative study was conducted in 44 subjects with type 2 diabetes and glycemic control was assessed with a continuous glucose monitoring system.
In healthy participants, serum glucose values and incremental areas under the glucose curves (AUC) were significantly lower in the PPB-R-203 than the control group (P < 0.05). In patients with type 2 diabetes, mean blood glucose concentrations for subjects on the control regimen were higher than those for subjects on the PPB-R-203-based regimen (7.9 ± 1.7, 95% confidence interval [CI] 7.4–8.4 vs 7.4 ± 1.6, 95% CI 6.9–7.9 mmol/L, respectively; P = 0.023). AUCs for total blood glucose and hyperglycemia (glucose >10 mmol/L) were also reduced for subjects on the PPB-R-203-based regimen as compared with those on control regimen (total blood glucose: 16.2 ± 4.0, 95% CI 14.9–17.4 vs 18.7 ± 4.0, 95% CI 17.6–20.1, P < 0.001; hyperglycemia: 4.9 ± 5.7, 95% CI 3.1–6.6 vs 6.3 ± 6.4, 95% CI 4.3–8.3 mmol/L × day, P = 0.021). However, AUC measurements for hypoglycemia (glucose <3.9 mmol/l) were not statistically significant.
A PPB-R-203-based diet reduced postprandial hyperglycemia in patients with type 2 diabetes without increasing the risk of hypoglycemia or glucose excursion.
INTRODUCTION
Resistant starch (RS)—defined as starch and starch degradation products that escape digestion in the small intestine of healthy individuals1—has been shown to be beneficial for the control of blood glucose. Unfortunately, a diet that has relatively high carbohydrate (eg, 52% total energy) and fiber (eg, 28 g/1000 kcal) content may be difficult to achieve or maintain on a long-term basis in patients with type 2 diabetes. Toward increasing the intake of RS in patients with type 2 diabetes, potential strategies include incorporation of foods into the diet that are naturally high in RS, or the use of ingredients with high RS content.
The content of RS in foods can be increased by controlling various parameters during the manufacturing process, including modifications in moisture content, pH, temperature, duration of heating, and number of heating-cooling cycles. However, the low water-holding capacity of RS can cause difficulties in production, and RS foods need to be cooked in boiling water and then deformed in a disperse phase. A new RS formula, PPB-R-203 (a retrograded starch product), was developed to overcome these problems with the aim of increasing dietary RS.
There is evidence from case reports supporting beneficial effects for PPB-R-203-based meals in the management of diabetes and obesity after gastric bypass surgery.2,3 These case studies found that 24-hour glucose excursions and areas under the curve for post-meal glycemia were markedly reduced in subjects who received PPB-R-203-based meals. In a weight reduction program based on switching from the usual diet to PPB-R-203-based meals, improvements were observed in various parameters, including lower systolic and diastolic blood pressure, lower fasting and 2-hour post-meal glucose levels, lower total cholesterol and triglyceride levels, and lower alanine aminotransferase levels.4 However, the effects of PPB-R-203-based meals on glucose variation, compared with typical rice-based meals, have not so far been precisely characterized. To address this gap in knowledge, we performed a randomized, 2-regimen, cross-over, comparative study to evaluate the effects on blood glucose regulation and safety of the high RS formula, PPB-R-203, versus commercially available food, both in healthy individuals and those with type 2 diabetes in Taiwan.
MATERIAL AND METHODS
Materials
Two different meal formulations were used in this study, which consisted of the same ingredients except for the cereal component. The control meals contained a cereal component of white rice/noodles, and the study meals contained PPB-R-203-derived rice/noodles as the cereal component (prepared by Pharma Power Biotec, Taipei, Taiwan). The macronutrient ratios of the control and test meals were the same (carbohydrate: protein: fat = 55%: 20%: 25%). The control food, which was commercially available, was given to each subject according to the daily energy needs. Experienced nutritionists determined the macronutrient composition of meal formulations. The PPB-R-203 product is derived entirely from cereal ingredients via a manufacturing process to enrich RS content. A single portion of a PPB-R-203-derived product contains 20 g carbohydrate and 2.3 g dietary fiber. The starch components of PPB-R-203-based foods include retrograded starch (10%), amylose (20%), and amylopectin (70%). The taste and appearance are the same as the usual food without loss of water-holding capacity.
Subjects
Ninety-two subjects recruited into this study in 2009 to 2010 were divided into 3 groups: healthy individuals who received PPB-R-203, or standard 50 g glucose, in a cross-over study (8 subjects); healthy individuals who received PPB-R-203, or commercially available food, in a cross-over study (40 subjects); and 44 subjects with type 2 diabetes who received PPB-R-203, or commercially available food, in a cross-over study. Glycemic index and effects on glucose and insulin homeostasis were assessed in the first 2 groups. In the third group, the effects of the study diet on glycemic parameters were assessed by continuous glucose monitoring (CGM; with a Medtronic Minimed CGMS, Northridge, CA). The application of continuous glucose monitoring (CGM) for the food response is excellent and less studied. But the use of CGM device is still an invasive procedure and is ethically recommended in the patients with diabetes exclusively. Therefore, we designed these serial studies by performing the traditional blood testing for the measurements of glycemic index and effects on glucose and insulin homeostasis in the healthy participants and then CGM in the participants with type 2 diabetes. All study protocols were approved by the Institutional Review Board and registered on ClinicalTrials.gov (assigned trial identifiers: NCT01065402 and NCT01102452).
PP-R-203-Based Food in Healthy Adults: Glycemic Response
The healthy volunteers were required to meet the following inclusion criteria: aged 20 to 65 years, ambulatory and willing to cooperate with dietary and testing requirements. Exclusion criteria were: recent history of drug (marijuana, cocaine and amphetamine) and alcohol addiction; sensitivity to starch products; serious cardiovascular disorders including acute stroke, myocardial infarction, unstable angina and unstable heart failure; concurrent participation in another clinical study; ongoing influenza infection or autoimmune diseases or other metabolic disorders; pregnancy or lactation in women. A total of 8 healthy participants received PPB-R-203-based food containing 50 g of available carbohydrate, or glucose (50 g), in a randomized cross-over sequence separated by a washout period of at least 24 hours (Supplementary Figure 1, http://links.lww.com/MD/A383). The glycemic response was measured by blood sugar testing at 0, 15, 30, 45, 60, 90, and 120 minutes following food ingestion. Incremental areas under the postprandial glucose curves were calculated by the trapezoidal method as the areas under the curve (AUCs) above the baseline value (iAUC). The glycemic index was calculated from the iAUC after consumption of the test food divided by the iAUC after ingestion of 50 g glucose.
To compare the effects of PPB-R-203-based and commercially available food on glycemic parameters, a group consisting of 40 healthy volunteers received PPB-R-203-based food or commercially available food (equivalent in carbohydrate proportion), in a randomized cross-over sequence separated by a washout period of at least 24 hours (Supplementary Figure 2, http://links.lww.com/MD/A383). Glucose and insulin levels were measured at 0, 15, 30, 45, 60, 90, 120, and 180 minutes following food ingestion.
Randomized, 2-Regimen, Cross-Over, Comparative Study in Patients With Type 2 Diabetes
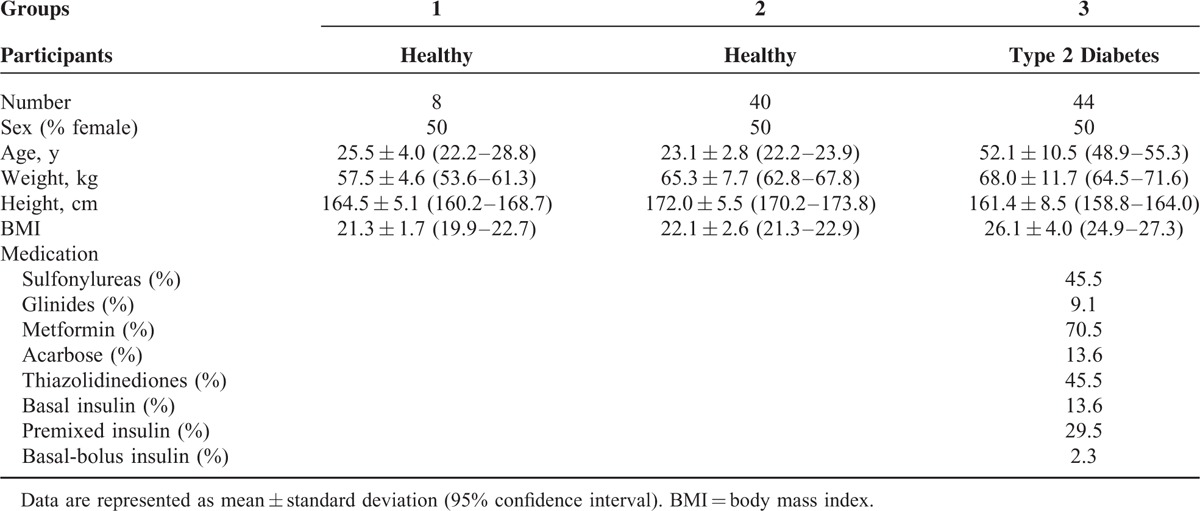
Forty-four patients with type 2 diabetes were enrolled in 2010 (Supplementary Figure 3, http://links.lww.com/MD/A383). Patients were required to meet the following inclusion criteria: aged 20 to 65 years, diagnosed with type 2 diabetes for >1 year, ambulatory and willing to cooperate with dietary and testing requirements. Exclusion criteria were: recent history of drug (marijuana, cocaine, and amphetamine) and alcohol addiction; sensitivity to starch products; serious cardiovascular disorders including acute stroke, myocardial infarction, unstable angina and unstable heart failure; concurrent participation in another clinical study; ongoing influenza infection or autoimmune diseases or other metabolic disorders; pregnancy or lactation in women. The medication for patients with type 2 diabetes included both oral and insulin drugs (70.5% metformin, 45.5% sulfonylureas, and 45.4% insulin use) (Table 1), which was similar as general practice.
TABLE 1.
Demographic and Clinical Findings for the Study Participants
Participants received PPB-R-203-based or commercially available food in a randomized cross-over sequence separated by washout period of at least 2 days. Each subject was admitted to the study center 1 day before the start of the trial. The study product was taken at the times 07:00, 12:00, and 18:00 for 2 days. Both the control and test products were equivalent in dietary and macronutrient composition, and were matched to daily energy needs (as determined by a certified dietician). Thus, the dietary regimens differed only in type of starch content. Continuous glucose monitoring (with a Medtronic Minimed CGMS, Northridge, CA) was used to record non-real-time blood glucose levels for each treatment period (subjects underwent 3 days of subcutaneous CGM with the Medtronic Minimed CGMS applied to the abdomen region). On study day 1, the sensor was inserted into the abdominal wall. Following initial calibration and after receiving instructions on how to operate the device, subjects were asked to continue as normal in their daily routines and tasks, as far as possible.
The Minimed Solutions CGMS software (MMT-7310 Version 3.0B, 3.0.116) was used to extract CGM data at the end of the study. Only data from days 2 and 3 were included in the analysis because of unstable sensing on day 1. Glucose variability was defined as the standard deviation of plasma glucose (SDPG)5 and the mean amplitude of glucose excursion (MAGE)6 determined from all glucose measurements taken over 2 days. AUCs for total glucose concentrations were calculated using the trapezoid rule (based on measurements taken over 2 days). The AUCs of glucose levels >10 mmol/L (AUC>10) and <3.9 mmol/L (AUC<3.9) were calculated for hyperglycemic and hypoglycemic periods, respectively. A hypoglycemic event was defined as a glucose concentration <3.9 mmol/L. Hypoglycemia recorded between the times 00:00 and 06:00 was defined as nocturnal. Other measures used to assess average glycemic control and blood glucose variability included: average blood glucose, number of hypoglycemic and hyperglycemic readings; the M value7, and low blood glucose index (LBGI) and high blood glucose index (HBGI).8–10
Statistics
Differences between groups (for the same continuous variable) were tested using Student paired t test. Differences between proportions were assessed using a χ2 test or Fisher exact test. Results are expressed as mean ± standard deviation (SD), 95% confidence interval, or as percentages. Statistical significance was defined for P values <0.05. Statistical analyses were conducted using SAS software (v9.3, SAS Institute, Cary, NC).
RESULTS
Glycemic Index of PPB-R-203 in Healthy Adults
The glycemic index of PPB-R-203 was calculated from the incremental area under the 2-hour postprandial blood glucose curve, using glucose (50 g) as the control (Figure 1). The glycemic index, based on 8 healthy volunteers with a mean age of 25.5 ± 4.0 (95% CI, 22.2–28.8) years and mean body mass index (BMI) of 21.3 ± 1.7 kg/m2 (95% CI, 19.9–22.7) (Table 1), was 37.5 ± 10.4 (Supplementary Table 1, http://links.lww.com/MD/A383).
FIGURE 1.
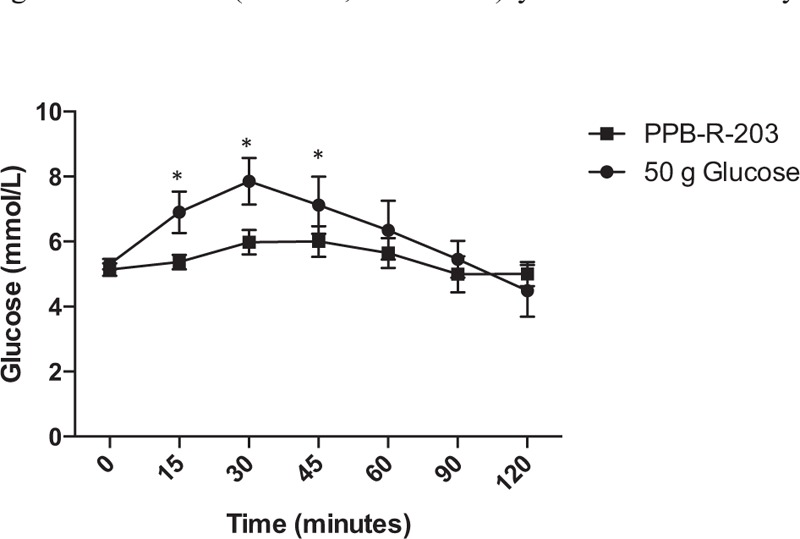
Glycemic response to PPB-R-203 compared with 50-g glucose in healthy participants. Data are represented as mean ± 95% confidence intervals. ∗Significant difference at matched time point (P < 0.05, based on Student t test).
Glycemic and Insulin Response to PPB-R-203-Based Food in Healthy Adults
Forty healthy subjects with a mean age of 23.1 ± 2.8 (95% CI, 22.2–23.9) years and mean BMI of 22.1 ± 2.6 kg/m2 (95% CI, 21.3–22.9) were recruited to study the effects of PPB-R-203-based versus commercially available food on glycemic and insulin excursions after meals. Plasma glucose concentrations (Figure 2 A) and insulin levels (Figure 2B) were significantly lower in subjects who received PPB-R-203-based meals, compared with those who received commercially available food. The incremental AUC for 2-hour glucose response was lower in PPB-R-203 than in control groups (Supplementary Figure 4, http://links.lww.com/MD/A383).
FIGURE 2.
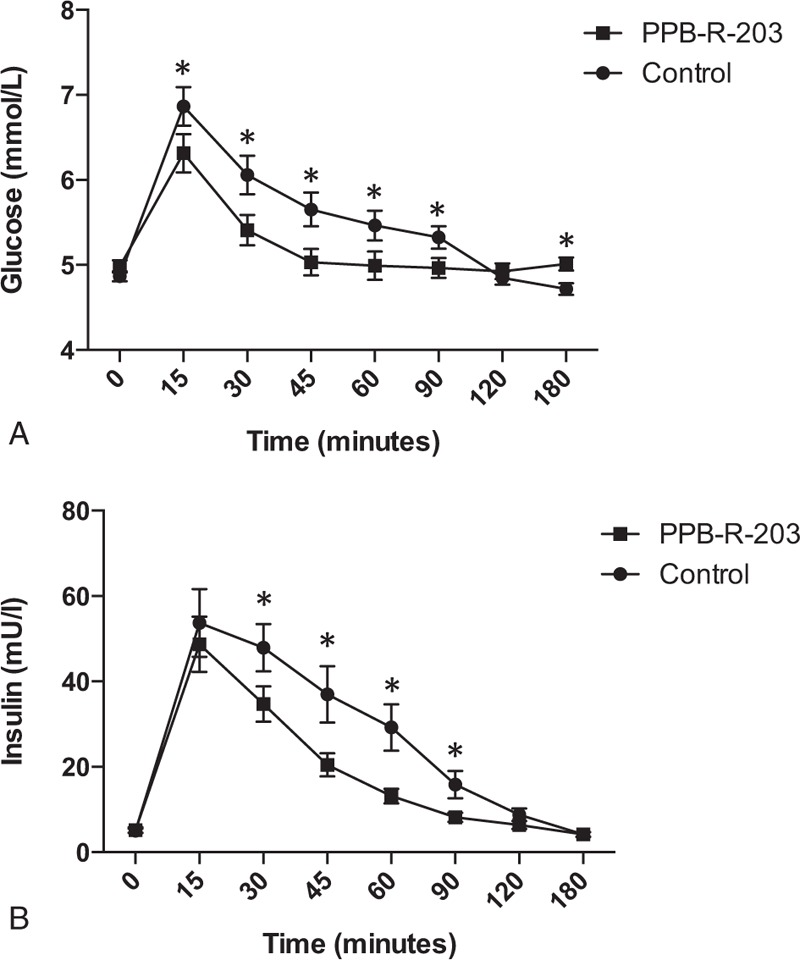
Glucose (A) and insulin (B) response to PPB-R-203-based or control meals. Data are represented as mean ± 95% confidence intervals. ∗Significant difference compared with control group at matched time point (P < 0.05, based on Student t test).
Effect of PPB-R-203-Based Food on Glucose Control and Insulin Regulation in Subjects With Type 2 Diabetes
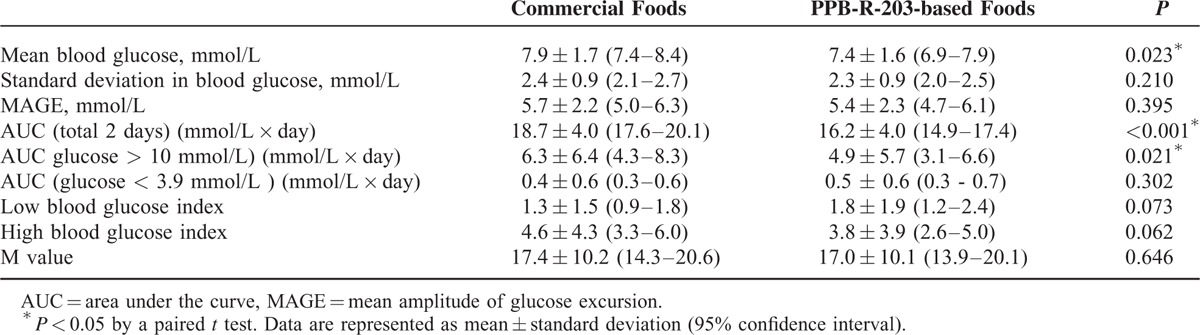
The mean age of the 44 patients with type 2 diabetes included in this study was 52.1 ± 10.5 (95% CI, 48.9–55.3) years and mean BMI was 26.1 ± 4.0 kg/m2 (95% CI, 24.9–27.3) (Table 1). CGM patterns with both dietary regimens are shown in Figure 3 for individual patients. Glucose levels and variability were lower after the PPB-R-203-based versus the commercially available regimen. The effects of PPB-R-203-based food on blood glucose and glycemic status are summarized in Table 2. The mean blood glucose level was significantly decreased after the PPB-R-203-based versus the commercially available regimen (7.4 ± 1.6, 95% CI 6.9–7.9 vs 7.9 ± 1.7, 95% CI 7.4–8.4 mmol/L, P = 0.023). The AUCs for total blood glucose and hyperglycemic states (blood glucose >10 mmol/L) were markedly reduced for the PPB-R-203-based versus the commercially available regimen (16.2 ± 4.0, 95% CI 14.9–17.4 vs 18.7 ± 4.0, 95% CI 17.6–20.1 mmol/L � x � day, P < 0.001 and 4.9 ± 5.7, 95% CI 3.1–6.6 vs 6.3 ± 6.4, 95% CI 4.3–8.3 mmol/L � x � day, P = 0.021, respectively). However, AUCs for hypoglycemia (blood sugar <3.9 mmol/L) did not significantly differ between regimens (0.4 ± 0.6, 95% CI 0.3–0.6 vs 0.5 ± 0.6, 95% CI 0.3–0.7 mmol/L × day for commercially available diet vs PPB-R-203-based diet, P = 0.302). Low and high blood glucose indices (LBGI and HBGI, respectively) that quantify risk of glycemic excursions were not significantly different between control and study periods. The glucose variability parameters—including MAGE and the M value—were both improved for the PPB-R-203-based versus control regimen, although not to a statistically significant extent.
FIGURE 3.
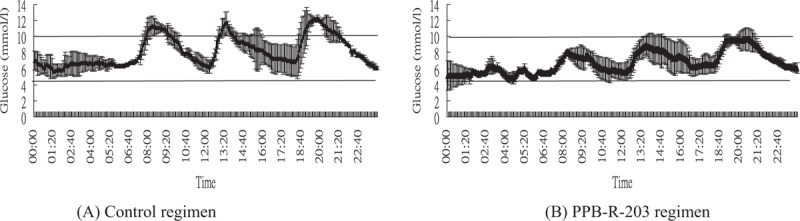
Time-course of blood glucose variations in individual subjects for the control diet (A) and PPB-R-203-based diet (B). Data are represented as mean ± 95% confidence intervals.
TABLE 2.
Glucose Variations Within the Same Patient for 2 Different Meal Regimens and Throughout All Test Periods (Days 2 and 3)
The mean 2-hour postprandial glucose levels for both PPB-R-203-based and control dietary regimens are shown in Figure 4. The mean glucose concentrations in the PPB-R-203-based group were decreased after each of the 3 daily meals compared with the control group, although not statistically significant for the total (ie, when the 3 meals were averaged), breakfast, lunch, and dinner (total: 8.1 ± 1.9 [95% CI, 7.5–8.7] vs 8.6 ± 2.0 [95% CI, 8.0–9.2] mmol/L, P = 0.060; breakfast: 8.3 ± 2.4 (95% CI, 7.7–9.1) vs 8.9 ± 2.2 (95% CI, 8.3–9.7) mmol/L, P = 0.059; lunch: 8.1 ± 2.0 (95% CI, 7.5–8.7) vs 8.6 ± 2.1 (95% CI, 8.0–9.3) mmol/L, P = 0.102; dinner: 7.9 ± 2.5 (95% CI, 7.1–8.6) vs 8.2 ± 2.4 (95% CI, 7.4–8.9) mmol/L, P = 0.254, respectively, for PPB-R-203 vs commercially available diet). No significant difference for glucose change was found in both test foods based on different medication.
FIGURE 4.
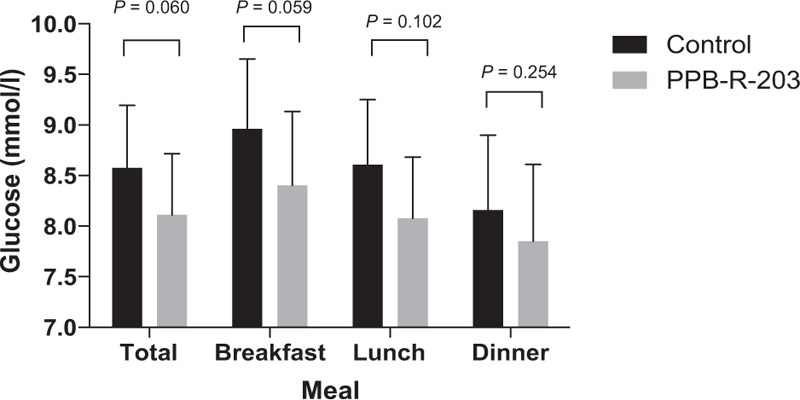
Mean postprandial blood glucose values observed within 2 hours for each of 3 meals. P by 2-tailed paired t test. Data are represented as mean ± 95% confidence intervals.
DISCUSSION
The series of studies from healthy subjects to patients with type 2 diabetes confirmed the beneficial effects of resistant starch formula-based diet on better blood glucose regulation. Reducing hyperinsulinemia in healthy subjects might be health beneficial as hyperinsulinemia associated with insulin resistance and related metabolic disorders.11–13 The diabetic patients with hyperinsulinemia are associated with insulin resistance and related metabolic disorders,14,15 although a short-term use of high-fiber diet might not contribute to improvement of insulin sensitivity.16 However, the characteristics of the resistant starch are the undigested or empty carbohydrates. The resistant starch in the test food could escape the digestion and cause the less glucose and responsive insulin levels than the control food.
Our data demonstrated that substitution of commercially available starch sources with the high RS formula, PPB-R-203, into the 3 daily meals, conferred advantages in patients with type 2 diabetes who used various therapies. Through the characteristics of low glycemic index, the mean glucose and hyperglycemic state were both ameliorated significantly. For glucose variations, there were not significant differences in both SDPG and MAGE. Even though the resistant starch could cause less postprandial blood glucose excursion, the baseline glucose variations of the patients with type 2 diabetes were not so prominent to show the differences.17 The hypoglycemic and hyperglycemic risks did not significantly differ between dietary regimens, although a trend toward reduced hyperglycemic score (based on assessment of the HBGI) favored a positive influence of PPB-R-203 on blood glucose control.
In most individuals, daily dietary fiber intake is usually lower than the recommended level, and maintaining satisfactory RS content in the diet has become an important challenge for the food manufacturing industry. Compared with traditional fibers, such as whole grains, a disadvantage of RS foods is that the sensory properties of the formed product may be affected. In particular, RS foods need to be cooked in boiling water, which may affect their shape and taste. PPB-R-203, a retrograded starch product, was developed to overcome these problems and was acceptable as a dietary component for patients enrolled in the present study. The findings of this randomized controlled trial support the clinical utility of the test diet based on PPB-R-203 for improved management of type 2 diabetes.
In addition to a reduction in mean glucose levels, the present study indicated the mean 2-hour postprandial glucose target of 9 mmol/L was achieved in all patients with type 2 diabetes, although no significant improvements were shown in patients who switched from a conventional to a PPB-R-203-based diet. The study design of hospital-based treatment and the defined meal amount would be the major point for the lower postprandial glucose in both groups. Practically, postprandial glucose control was often difficult in patients with type 2 diabetes in their usual daily life, especially in the morning, due to the high glycemic index of foods typically found in Taiwanese diets. This rise and fall of postprandial glucose levels are mediated by the first-phase insulin response, in which large amounts of endogenous insulin are released, usually within 10 min, in response to nutrient intake. However, in individuals with type 2 diabetes, the first-phase insulin response is severely diminished or absent, resulting in persistently elevated postprandial glucose levels for most of the day.14 To overcome these problems, the characteristic of undigested or empty glucose for substituting conventional starch sources with PPB-R-203-derived foods into the main daily meals can still improve the postprandial glucose in routine life.
The Diabetes Epidemiology Collaborative Analysis of Diagnostic Criteria in Europe (DECODE) and the Diabetes Epidemiology Collaborative Analysis of Diagnostic Criteria in Asia (DECODA) studies18,19 analyzed baseline and 2-hour post-challenge glucose data from prospective cohort studies that included large numbers of men and women of European and Asian origin. These analyses provided evidence supporting 2-hour postprandial plasma glucose levels as a better predictor of cardiovascular disease and all-cause mortality than fasting plasma glucose. The International Diabetes Federation (IDF) Guideline for the management of post-meal glucose in diabetes also advises that post-meal hyperglycemia is harmful and should be addressed.20 Indeed, acute glucose fluctuations during post-meal periods have been shown to have a more specific effect in triggering oxidative stress and endothelial dysfunction than sustained hyperglycemia in patients with type 2 diabetes.21 Moreover, there is evidence that an independent and cumulative effect of post-meal hypertriglyceridemia and hyperglycemia on intercellular adhesion molecule 1, vascular cell adhesion molecule 1, and E-selectin plasma levels plays an important role in the initiation of atherosclerosis.22,23
Meta-analyses of randomized controlled trials have shown that diets with a lower glycemic index result in HbA1c reductions of approximately 0.5%.24–26 Toward maintaining effective glycemic control, IDF guidelines recommend various strategies—both nonpharmacologic and pharmacologic—aimed at addressing post-meal plasma glucose levels. A post-meal glucose target of 9.0 mmol/L achieved within 1 to 2 hours after a meal has been suggested as long as hypoglycemia is avoided.20 Based on the present study, it was found that mean 2-hour post-prandial glucose levels could be adequately maintained below the suggested targets in patients with type 2 diabetes who received PPB-R-203-based meals. In further underlining the potential utility of PPB-R-203 in strategies to lower postprandial blood glucose, treat-to-target approaches through nonpharmacologic interventions have been shown to decrease the risk of developing micro- and macrovascular complications in patients with type 2 diabetes.
A limitation of the present study is the short duration of the dietary intervention in the patients with type 2 diabetes. However, although a 2-day duration for the dietary test regimen cannot be considered as a long-term intervention, it still allows sufficient time for changes in glucose metabolism to occur (examined through professional continuous glucose monitoring that enables a more detailed evaluation of glucose levels, eg, compared with self-monitoring at home). Moreover, as participants resided within the hospital study center for the duration of the interventions, closer monitoring of dietary compliance than in previous studies—for example, where patients were monitored by a dietician during visits that took place every 2 to 3 days or weekly—was possible.14,15
CONCLUSIONS
We demonstrated that a high-fiber and high-resistance starch diet, PPB-R-203-based staple food, could improve insulin resistance through the reduction of postprandial hyperinsulinemia. The characteristics of resistant starch in the digestion contributed to the main effects. The reduction of glucose metabolism in healthy people subsequently proves the role of glucose regulation. In the clinical study, PPB-R-203-based food improved postprandial hyperglycemia in patients with type 2 diabetes. The risk of hypoglycemia with PPB-R-203-based food was not increased compared with commercially available food, and glucose variability did not deteriorate. Whether these findings can be translated to long effect on glycemic control and reducing diabetic complications remains to be further studied.
Acknowledgments
The authors thank S.W. Liu from the National Taiwan University for invaluable statistical advice.
Footnotes
Abbreviations: AUC = area under the curve, BMI = body mass index, CGM = continuous glucose monitoring, DM = diabetes mellitus, MAGE = mean amplitude of glucose excursion, RS = resistant starch, SDPG = standard deviation of plasma glucose.
This study was sponsored by Pharma Power Biotec Co., Ltd., Taiwan. The funder had no input into any aspect of the design and management of this study.
Parts of this study were presented in abstract form at the 73rd Annual Scientific Sessions of the American Diabetes Association, Chicago, IL (June 21–25, 2013).
The authors report no conflicts of interest.
Supplemental digital content is available for this article. Direct URL citations appear in the printed text and are provided in the HTML and PDF versions of this article on the journal's Website (www.md-journal.com).
REFERENCES
- 1.Resistant Starch. Proceedings for the 2nd plenary meeting of EURESTA: European FLAIR Concerted Action No. 11 on physiological implications of the consumption of resistant starch in man. Crete, 29 May-2 June 1991. Eur J Clin Nutr 1992; 46 Suppl 2:S1–S148. [PubMed] [Google Scholar]
- 2.Wang CS, Peng WY, Huang TL, et al. Continuous glucose monitoring as a tool in education of the glucose control in patients after bariatric surgery–a case report. Infusystems Asia 2011; 6:30–32. [Google Scholar]
- 3.Chang DM, Chang CH, Chuang LM. Continuous glucose monitoring in finding subtle changes in glycemic regulation:effect of high fiber meal on glucose variability. Infusystems Asia 2011; 6:5–8. [Google Scholar]
- 4.Shih GM, Fan CM, Wang WK. Effect of a processed food of resistant starch on weight reduction. Taiwan J Diet 2010; 2:37–44. [Google Scholar]
- 5.Siegelaar SE, Holleman F, Hoekstra JB, et al. Glucose variability; does it matter? Endocr Rev 2010; 31:171–182.doi: 110.1210/er.2009-0021. Epub 2009 Dec 1214. [DOI] [PubMed] [Google Scholar]
- 6.Service FJ, Molnar GD, Rosevear JW, et al. Mean amplitude of glycemic excursions, a measure of diabetic instability. Diabetes 1970; 19:644–655. [DOI] [PubMed] [Google Scholar]
- 7.Schlichtkrull J, Munck O, Jersild M. The M-value, and index of blood-sugar control in diabetids. Acta Med Scand 1965; 177:95–102. [DOI] [PubMed] [Google Scholar]
- 8.Kovatchev BP, Otto E, Cox D, et al. Evaluation of a new measure of blood glucose variability in diabetes. Diabetes Care 2006; 29:2433–2438. [DOI] [PubMed] [Google Scholar]
- 9.Kovatchev BP, Cox DJ, Gonder-Frederick LA, et al. Assessment of risk for severe hypoglycemia among adults with IDDM: validation of the low blood glucose index. Diabetes Care 1998; 21:1870–1875. [DOI] [PubMed] [Google Scholar]
- 10.Kovatchev BP, Cox DJ, Gonder-Frederick L, et al. Methods for quantifying self-monitoring blood glucose profiles exemplified by an examination of blood glucose patterns in patients with type 1 and type 2 diabetes. Diabetes Technol Ther 2002; 4:295–303. [DOI] [PubMed] [Google Scholar]
- 11.Bakshi AA, Bavikar JS, Asegaonkar SB, et al. Evaluation of usefulness of serum insulin as sensitive predictor of cardiovascular dysfunction in obese individuals with normal lipid profile. J Clin Diagn Res 2014; 8:CC10–CC12.doi: 10.7860/JCDR/2014/9759.4980. Epub 2014 Oct 7820. [DOI] [PMC free article] [PubMed] [Google Scholar]
- 12.Bazotte RB, Silva LG, Schiavon FP. Insulin resistance in the liver: deficiency or excess of insulin? Cell Cycle 2014; 13:2494–2500.doi: 2410.4161/15384101.15382014.15947750. [DOI] [PMC free article] [PubMed] [Google Scholar]
- 13.Corkey BE. Banting lecture 2011: hyperinsulinemia: cause or consequence? Diabetes 2012; 61:4–13.doi: 10.2337/db2311-1483. [DOI] [PMC free article] [PubMed] [Google Scholar]
- 14.De Natale C, Annuzzi G, Bozzetto L, et al. Effects of a plant-based high-carbohydrate/high-fiber diet versus high-monounsaturated fat/low-carbohydrate diet on postprandial lipids in type 2 diabetic patients. Diabetes Care 2009; 32:2168–2173.doi: 2110.2337/dc2109-0266. Epub 2009 Sep 2169. [DOI] [PMC free article] [PubMed] [Google Scholar]
- 15.Riccardi G, Rivellese AA. Effects of dietary fiber and carbohydrate on glucose and lipoprotein metabolism in diabetic patients. Diabetes Care 1991; 14:1115–1125. [DOI] [PubMed] [Google Scholar]
- 16.Sacks FM, Carey VJ, Anderson CA, et al. Effects of high vs low glycemic index of dietary carbohydrate on cardiovascular disease risk factors and insulin sensitivity: the OmniCarb randomized clinical trial. Jama 2014; 312:2531–2541.doi: 2510.1001/jama.2014.16658. [DOI] [PMC free article] [PubMed] [Google Scholar]
- 17.Chen YC, Huang YY, Li HY, et al. Professional continuous glucose monitoring for the identification of type 1 diabetes mellitus among subjects with insulin therapy. Medicine (Baltimore) 2015; 94:e421.doi: 410.1097/MD.0000000000000421. [DOI] [PMC free article] [PubMed] [Google Scholar]
- 18.Group DS. Glucose tolerance and cardiovascular mortality: comparison of fasting and 2-hour diagnostic criteria. Arch Intern Med 2001; 161:397–405. [DOI] [PubMed] [Google Scholar]
- 19.Nakagami T, Qiao Q, Tuomilehto J, et al. Screen-detected diabetes, hypertension and hypercholesterolemia as predictors of cardiovascular mortality in five populations of Asian origin: the DECODA study. Eur J Cardiovasc Prev Rehabil 2006; 13:555–561. [DOI] [PubMed] [Google Scholar]
- 20.Colagiuri S. 2011 Guideline for Management of PostMeal Glucose in Diabetes. International Diabetes Federation 2011; ISBN 2-930229-81-0. [DOI] [PMC free article] [PubMed] [Google Scholar]
- 21.Ceriello A, Esposito K, Piconi L, et al. Oscillating glucose is more deleterious to endothelial function and oxidative stress than mean glucose in normal and type 2 diabetic patients. Diabetes 2008; 57:1349–1354.doi: 1310.2337/db1308-0063. Epub 2008 Feb 1325. [DOI] [PubMed] [Google Scholar]
- 22.Ross R. The pathogenesis of atherosclerosis: a perspective for the 1990s. Nature 1993; 362:801–809. [DOI] [PubMed] [Google Scholar]
- 23.Ceriello A, Falleti E, Motz E, et al. Hyperglycemia-induced circulating ICAM-1 increase in diabetes mellitus: the possible role of oxidative stress. Horm Metab Res 1998; 30:146–149. [DOI] [PubMed] [Google Scholar]
- 24.Thomas DE, Elliott EJ. The use of low-glycaemic index diets in diabetes control. Br J Nutr 2010; 104:797–802.doi: 710.1017/S0007114510001534. Epub 0007114510002010 Apr 0007114510001527. [DOI] [PubMed] [Google Scholar]
- 25.Thomas D, Elliott EJ. Low glycaemic index, or low glycaemic load, diets for diabetes mellitus. Cochrane Database Syst Rev 2009; 1–25.(1):CD006296. doi: 006210.001002/14651858.CD14006296.pub14651852. [DOI] [PMC free article] [PubMed] [Google Scholar]
- 26.Brand-Miller J, Hayne S, Petocz P, et al. Low-glycemic index diets in the management of diabetes: a meta-analysis of randomized controlled trials. Diabetes Care 2003; 26:2261–2267. [DOI] [PubMed] [Google Scholar]