Abstract
The aim of this study was to explore the significance of different ST-segment changes before and after percutaneous coronary intervention (PCI), in relation to cardiac magnetic resonance (CMR)-verified microvascular obstruction (MVO) along with intramyocardial hemorrhage (IMH) in ST-elevation myocardial infarction (STEMI) patients.
This study enrolled 108 STEMI patients who received primary PCI and had no contraindication of CMR investigation. Sum ST-segment elevation (STE), maximal STE on admission and sum ST-segment resolution (STR), and single-lead STR and residual STE at 60 minutes after primary PCI were assessed. MVO and IMH were determined by contrast-enhanced CMR.
Patients were classified into 3 groups: 30 patients with MVO(−)/IMH(−), 25 with MVO(+)/IMH(−), and 53 with MVO(+)/IMH(+). Sum STE (P = 0.001), maximal STE (P < 0.001), and residual STE (P = 0.025) were highest and single-lead STR was lowest (P = 0.044) in the MVO(+)/IMH(+) group. Receiver operator characteristics curve analysis revealed that maximal STE was the most powerful factor for distinguishing between MVO(+) and MVO(−) patients (optimal threshold = 0.5 mV, area under the curve, AUC = 0.718, P < 0.001), or IMH(+) and IMH(−) patients (optimal threshold = 0.5 mV, AUC = 0.697, P < 0.001). In multivariate analysis, maximal STE was identified as the most powerful independent predictor of MVO (odds ratio [OR] = 4.30, P < 0.001) and IMH (OR = 2.44, P = 0.001), whereas sum STE was the strongest correlate of both the number of MVO segments (r = 0.42, P < 0.001) and IMH segments (r = 0.43, P < 0.001).
The presence of MVO and IMH in infarcted tissue was relevant to ST-segment changes in STEMI patients. Maximal STE was a powerful independent predictor of the presence of MVO and IMH, whereas sum STE was a strong correlate of the number of MVO and IMH segments.
INTRODUCTION
Myocardial infarction (MI) is a critical cause accounting for both disability and death worldwide, no matter among the developed or the developing countries.1–4 Although it is necessary to perform recanalization of the epicardial vessel successfully, microvascular flow still strongly correlates with outcomes in patients with acute ST-elevation myocardial infarction (STEMI) after reperfusion therapy.5–7 Microvascular obstruction (MVO) and intramyocardial hemorrhage (IMH) are 2 important pathological changes presented in patients with STEMI after reperfusion therapy.8,9 Previous studies have found that the presence of MVO or IMH was associated with increased infarction size (IS), left ventricle (LV) volumes, lowered ejection fraction, and the poor prognosis at follow-up.10–14 Therefore, early detection or prediction of the presence of MVO and IMH has significant impact on clinical practice. Electrocardiography is commonly used in detecting ischemic or infarcted myocardium, which is available for most healthcare organizations. ST-segment changes are better indicators for myocardial rather than epicardial flow, thus help to enhance prognostic value of coronary angiography alone.15–18 Several studies have suggested that a simple serial electrocardiogram (ECG) analysis could be very helpful to identify MVO in patients with STEMI treated with PCI.19–22 However, the relationship between different parameters of ST-segment change and IMH still remains to be clarified and which parameter is the most practicable predictor for detecting cardiac magnetic resonance(CMR)-derived MVO or IMH is conflicting. The purpose of this study was therefore to prospectively explore the significance of different ST-segment change parameters early before and after PCI, in relation to MVO or IMH assessed by CMR in STEMI patients.
MATERIALS AND METHODS
Study Population
Patients were eligible for enrolment if they were between 18 and 75 years and had a STEMI treated with primary PCI within 12 hours from onset of symptoms to PCI time. STEMI is defined as chest pain of >30 minutes duration and ECG changes with ST-segment elevation (STE) of >2 mm in at least 2 precordial leads and >1 mm in the limb ones, and abnormal troponin levels or creatine kinase-MB (CKMB) at least twice the upper limit of normal.23 Exclusion criteria were as follows: abnormal ECG (ie, previous MI, atrial fibrillation, left bundle branch block, or other arrhythmia), pre-PCI TIMI2/3 flow, and contraindication of CMR investigation. As shown in Figure 1, 340 STEMI patients receiving reperfusion therapy were admitted in our cardiac center during the period from May 2012 to October 2013, among which a total of 232 patients were excluded from this analysis. Thus, the rest 108 patients formed the final study population. All patients were treated with standard therapeutic regimes based on guidelines. Informed consent was provided to each study subject and the study protocol was approved by the Institutional Review Board on Human Research.
FIGURE 1.
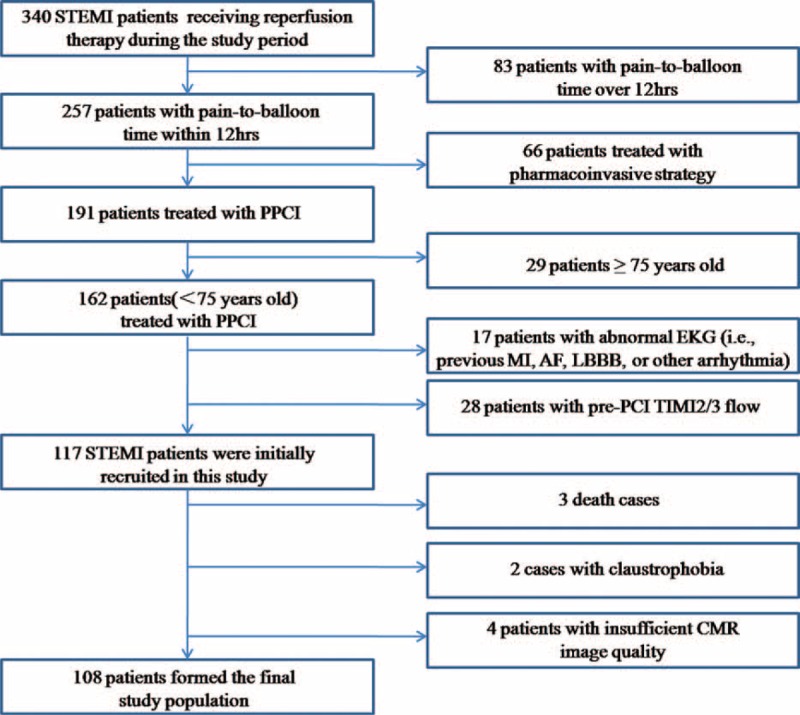
Flow chart of patient enrolment. AF = atrial fibrillation, CMR = cardiac magnetic resonance, LBBB = left bundle branch block, MI = myocardial infarction, PCI = percutaneous coronary intervention, PPCI = primary percutaneous coronary intervention, STEMI = ST-elevation myocardial infarction.
Electrocardiograph
Twelve-lead ECG recorded at 25 mm/s speed and 1.0 mV/10 mm calibration was taken both on admission and 60 minutes after infarct-related artery (IRA) recanalization. STE was measured 60 ms after the end of the QRS complex J point in leads I, aVL, and V1 to V6 for anterior MI, and leads II, III, aVF, V5, and V6 for nonanterior MI.22 Sum STE was calculated as the sum of STE in all the leads using previously validated algorithms ECG at the time of admission.17 Maximal STE was measured as the existing ST-segment deviation in the single ECG lead of maximum ST-segment deviation, which is present at admission.21,24 Residual STE was measured as the existing maximum ST-segment deviation that is present on ECG 60 minutes after PCI.22,24 Sum ST-segment resolution (STR) was calculated as the difference of the sum of STE between the first and the second ECG divided by the sum of STE on the first ECG and expressed as a percentage.20,24 Single lead STR was expressed as the percent reduction after PCI of ST-segment deviation in the single ECG lead with the most prominent ST-segment deviation at baseline and at 60 minutes after PCI.24
Coronary Angiography
Coronary angiography was performed using the standard Seldinger technique through a 6F guiding catheter. The final angiographic imaging after PCI was used to assess infarction-related regional myocardial perfusion after an intracoronary injection of 200 μg nitroglycerin. Epicardial coronary flow in the IRA was graded according to the TIMI flow grade and corrected TIMI frame count (CTFC). Myocardial microvascular flow was assessed according to the TIMI myocardial perfusion grades (TMPGs) and myocardial blush grades (MBGs) as previously described.5
CMR Protocol and Data Analysis
ECG-gated CMR imaging was performed on a 3.0-Tesla scanner (Achieva TX, Philips Healthcare, Best, The Netherlands) within median 5.0 days postreperfusion. All sequences were acquired in breathhold with a field of view of 350 × 350 mm2. An experienced reader who was blind to clinical data inspected CMR results with a validated software (QMass MR 7.5, Medis, Leiden, The Netherland).
Cine CMR was performed using a balanced steady-state free precession sequence in short-axis view to cover the whole LV without gap (repetition time/echo time, TR/TE 3.2/1.6 ms, 30 phases, voxel size 2.0 × 1.6 × 8 mm3). Acquired images were used to determine ventricular parameters. Black blood T2 short tau inversion-recovery (BB T2-STIR) images were acquired at apical, midventricle, and basal level of short-axis plane (TR/TE 2 R-R intervals/75 ms, voxel size 2.0 × 1.6 × 8 mm3). Myocardial edema was defined as high signal myocardium within the territory of culprit vessel (signal intensity >2 standard deviations above the mean signal in remote skeletal muscle) and IMH was recognized as hyposignal area within the edema. Right after a bolus intravenous administration of contrast agent (0.2 mmol/kg; Magnevist, Bayer HealthCare Pharmaceuticals Inc., Germany), first-pass perfusion was performed in the same slice locations and planes as the BB T2-STIR images. Late gadolinium enhancement CMR images were acquired with an inversion recovery segmented 3D gradient echo sequence 10 minutes after contrast injection at short-axis and 2-, 4-chamber views covering the whole LV (TR/TE 3.5/1.7 ms, temporal resolution 190 ms, voxel size 1.5 × 1.7×10 mm3 interpolated into 0.74 × 0.74 × 5 mm3). Infarction was determined as hyperenhanced myocardium (a signal intensity >5 standard deviations of normal myocardium). MVO was thereby defined as hypoenhanced area within infracted zone. IS was normalized to LV mass (%LV) (Figure 2). The number of MVO or IMH segments was calculated with 17 segments model, which was recommended by American Heart Association.25
FIGURE 2.
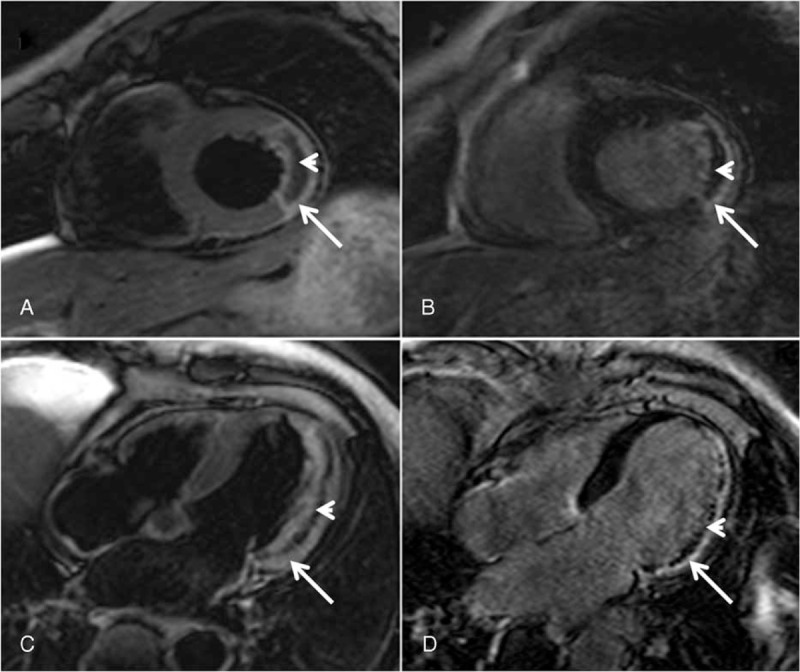
IMH and MVO detected by CMR. (a) Short axis view. (c) Four-chamber view: IMH defined as low-signal area (arrowhead) within high-signal edema myocardium (arrow) on BB T2-STIR images. (b) Short axis view. (d) Four-chamber view: MVO defined as hypoenhanced area (arrowhead) within hyperenhanced infarction zone (arrow) on late enhancement images. BB T2-STIR = black blood T2 short tau inversion-recovery, CMR = cardiac magnetic resonance, IMH = intramyocardial hemorrhage, MVO = microvascular obstruction.
Based on the presence of MVO and IMH, patients were classified into 3 groups: MVO(−)/IMH(−) group, MVO(+)/IMH(−) group, and MVO(+)/IMH(+) group.
Statistical Analysis
Summary statistics of continuous data with symmetric distribution were expressed as mean ± standard deviation. Categorical data were expressed as counts and/or percentages. Normally distributed variables were compared using 1-way analysis of variance as appropriate. Data not normally were compared using Kruskal–Wallis test for between-groups comparisons. Categorical variables were compared using χ2 or Fisher exact tests. The correlation between each ST-segment change parameter and the number of MVO/IMH segments was analyzed with Pearson correlation test. Receiver operator characteristics (ROC) curve analysis was performed to evaluate the ability of each ST-segment change parameter in predicting CMR-derived MVO or IMH. We evaluated the relative variables to MVO or IMH by univariate logistic regression model. Variables that achieved a significant level of P < 0.1 were selected for evaluation by a multivariate logistic regression model. Statistical tests were considered significant at P < 0.05. To obtain interobserver and intraobserver variability for ST-segment change parameters, 2 independent observers experienced in interpreting ST-segment change parameters evaluated the raw data from 50 randomly selected cases in a blinded fashion. The reliability of the measurements (for both interobserver and intraobserver variability) was evaluated by their reproducibility (intraclass coefficient of correlation, ICC), with values >0.8 considered excellent. Statistical analysis was performed using SPSS version 17.0 (SPSS, Inc., Chicago, IL). ROC curve analysis was done using MedCalc version 9.6.4.0 (MedCalc Software, Mariakerke, Belgium).
RESULTS
Baseline Characteristics
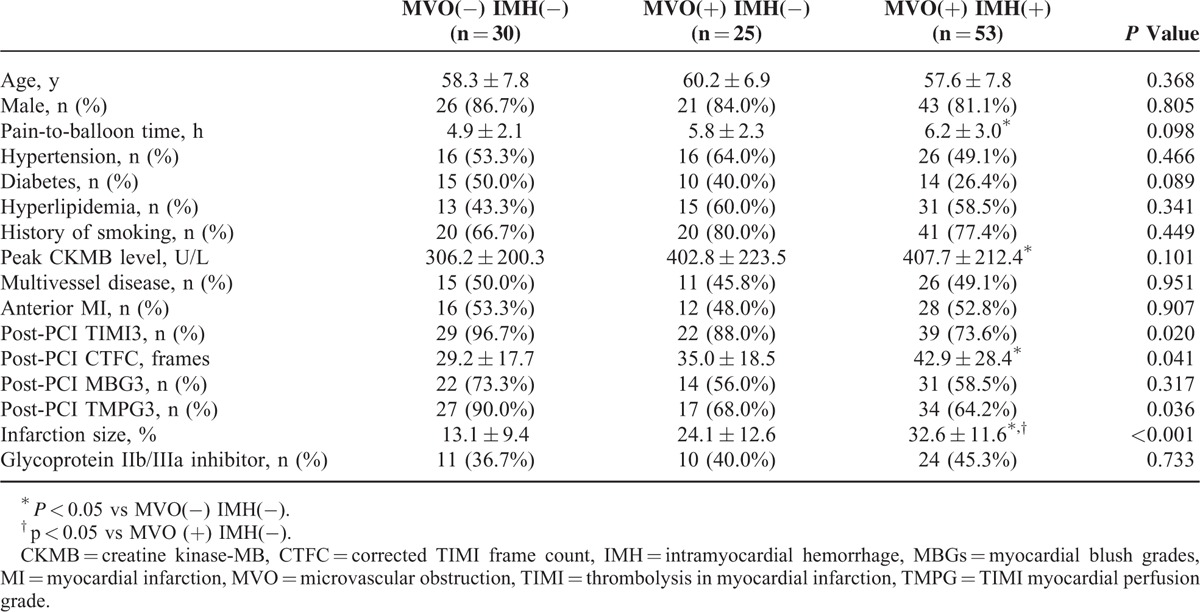
MVO was observed in 78 (72%) and IMH in 53 (49%) patients. IMH was only observed in patients with MVO. Patients were classified into 3 groups: 30 patients with MVO(−)/IMH(−), 25 with MVO(+)/IMH(−), and 53 with MVO(+)/IMH(+). The baseline characteristics of patients among 3 groups were showed in Table 1. There was no difference among these 3 groups in age, sex, history of hypertension, hypercholesterolemia, diabetes, and incidence of smoking, multivessel disease, anterior MI, and the use of glycoprotein IIb/IIIa inhibitor. MVO(+)/IMH(+)group had the lowest prevalence of post-PCI TIMI3 (73.6%, P = 0.020) and TMPG3 (64.2%, P = 0.036), the highest post-PCI CTFC (42.9 ± 28.4 frames, P = 0.041), and the largest IS (32.6 ± 11.6%, P < 0.001). Otherwise, MVO(+)/IMH(+) group seems to have significantly longer pain-to-balloon time (6.2 ± 3.0 vs 4.9 ± 2.1 hours, P = 0.032) and higher peak CKMB level (407.7 ± 212.4 vs 306.2 ± 200.3, P = 0.041) than MVO(−)/IMH(−) group patients.
TABLE 1.
Baseline Clinical Characteristics and Angiographic Data
Electrocardiography Findings
Electrocardiography findings showed that MVO(+)/IMH(+) group had the highest sum STE (2.02 ± 1.11 mV, P = 0.001), maximal STE (0.62 ± 0.33 mV, P < 0.001), residual STE (0.22 ± 0.18 mV, P = 0.025), and the lowest single-lead STR (66.4 ± 31.2 mV, P = 0.040) among these 3 groups (Table 2).
TABLE 2.
Electrocardiography Findings Among 3 Groups

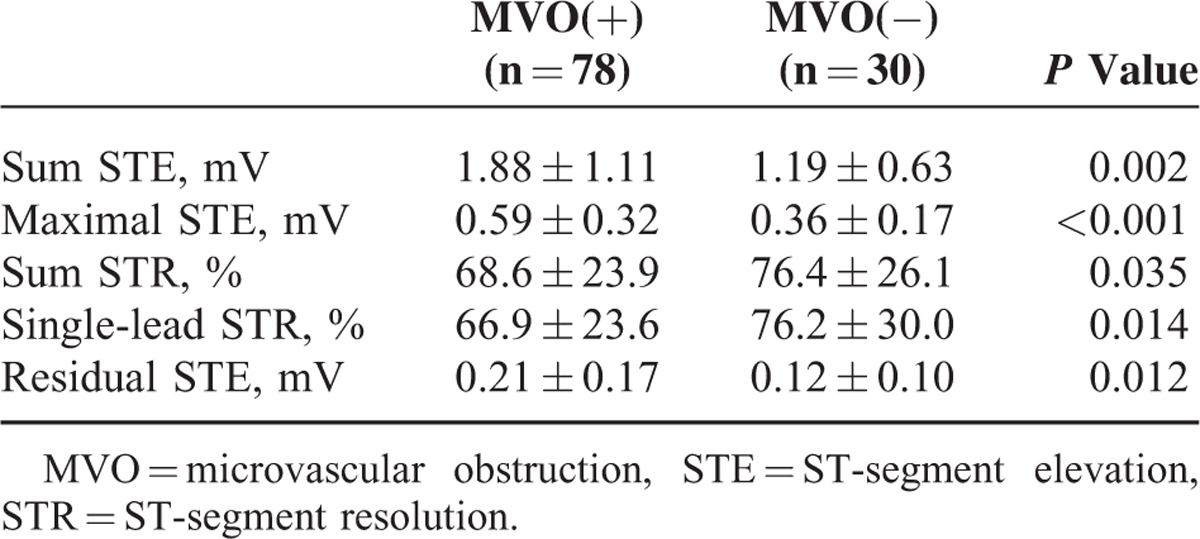
When MVO(+)/IMH(+) and MVO(+)/IMH(−) groups were combined, MVO(+) patients had higher sum STE (1.88 ± 1.11 vs 1.19 ± 0.63, P = 0.002), maximal STE (0.59 ± 0.32 vs 0.36 ± 0.17, P < 0.001), residual STE (0.21 ± 0.17 vs 0.12 ± 0.10, P = 0.012), and lower sum STR (68.6 ± 23.9 vs 76.4 ± 26.1%, P = 0.035) and single-lead STR (66.9 ± 23.6 vs 76.2 ± 30.0%, P = 0.014) compared with MVO(−) patients (Table 3).
TABLE 3.
Electrocardiography Findings Between MVO(+) and MVO(−) Group
Predictive Value of Different ST-Segment Change Parameters in MVO
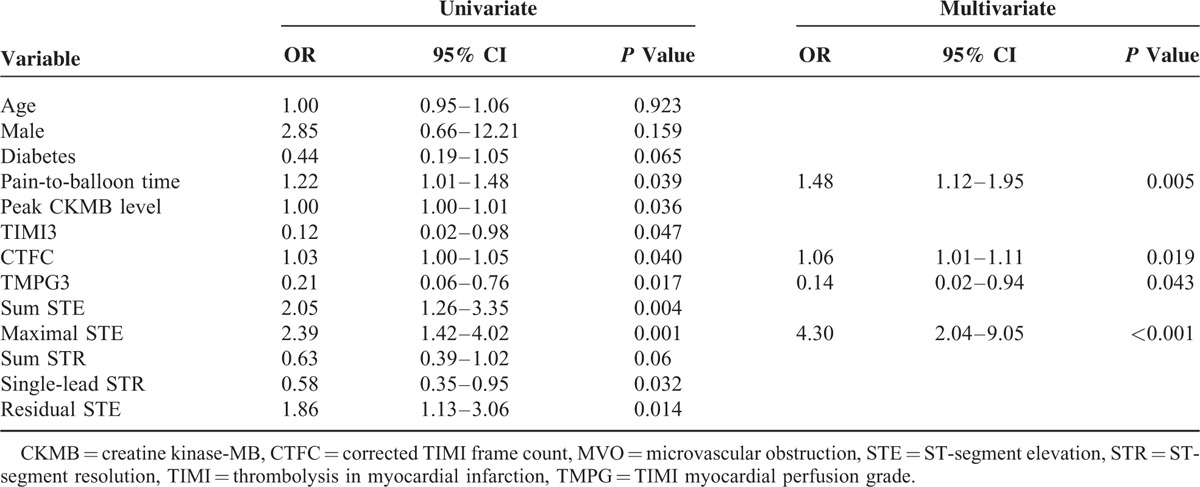
ROC analysis revealed that maximal STE (area under the curve, AUC = 0.718, P < 0.001) was the most powerful factor, with a threshold of 0.5 mV to differentiate MVO(+) from MVO(−) patients (Table 4). A multivariate logistic regression model for predicting MVO in STEMI patients was performed. The variables included were age, sex, diabetes, pain-to-balloon time, peak CKMB, final TIMI3, final CTFC, final TMPG3, sum STE, maximal STE, sum STR, single-lead STR, and residual STE. In the multivariate logistic regression analysis, the maximal STE (odds ratio [OR] 4.30, 95% confidence interval [CI] 2.04–9.05, P < 0.001), CTFC (OR 1.06, 95% CI 1.01–1.11, P = 0.019), TMPG3 (OR 0.14, 95% CI 0.02–0.94, P = 0.043), and pain-to-balloon time (OR 1.48, 95% CI 1.12–1.95, P = 0.005) were independent predictors of MVO on CMR imaging (Table 5).
TABLE 4.
ROC Curve Analysis for Determining ST-Segment Changes’ Threshold to Differentiate Between MVO(+) and MVO(−)

TABLE 5.
Univariate and Multivariate Logistic Regression Analysis for the Prediction of MVO
Correlation of Different ST-Segment Change Parameters With MVO Segments
ST-segment change parameters correlated with the number of MVO segments. Sum STE was the strongest correlate of the number of MVO segments (r = 0.42, P < 0.001) (Figure 3).
FIGURE 3.
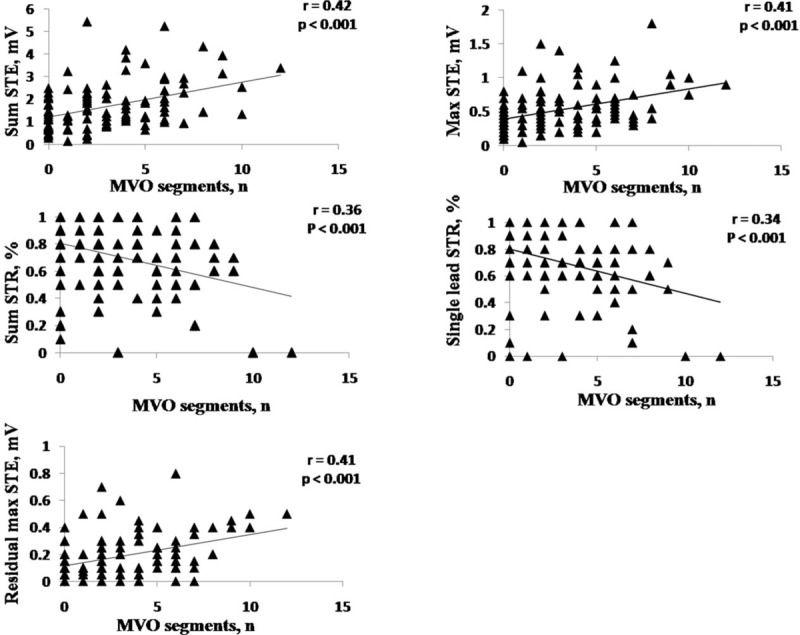
Linear correlation between different ST-segment change parameters and MVO segments. MVO = microvascular obstruction, STE = ST-segment elevation, STR = ST-segment resolution.
Predictive Value of Different ST-Segment Change Parameters in IMH
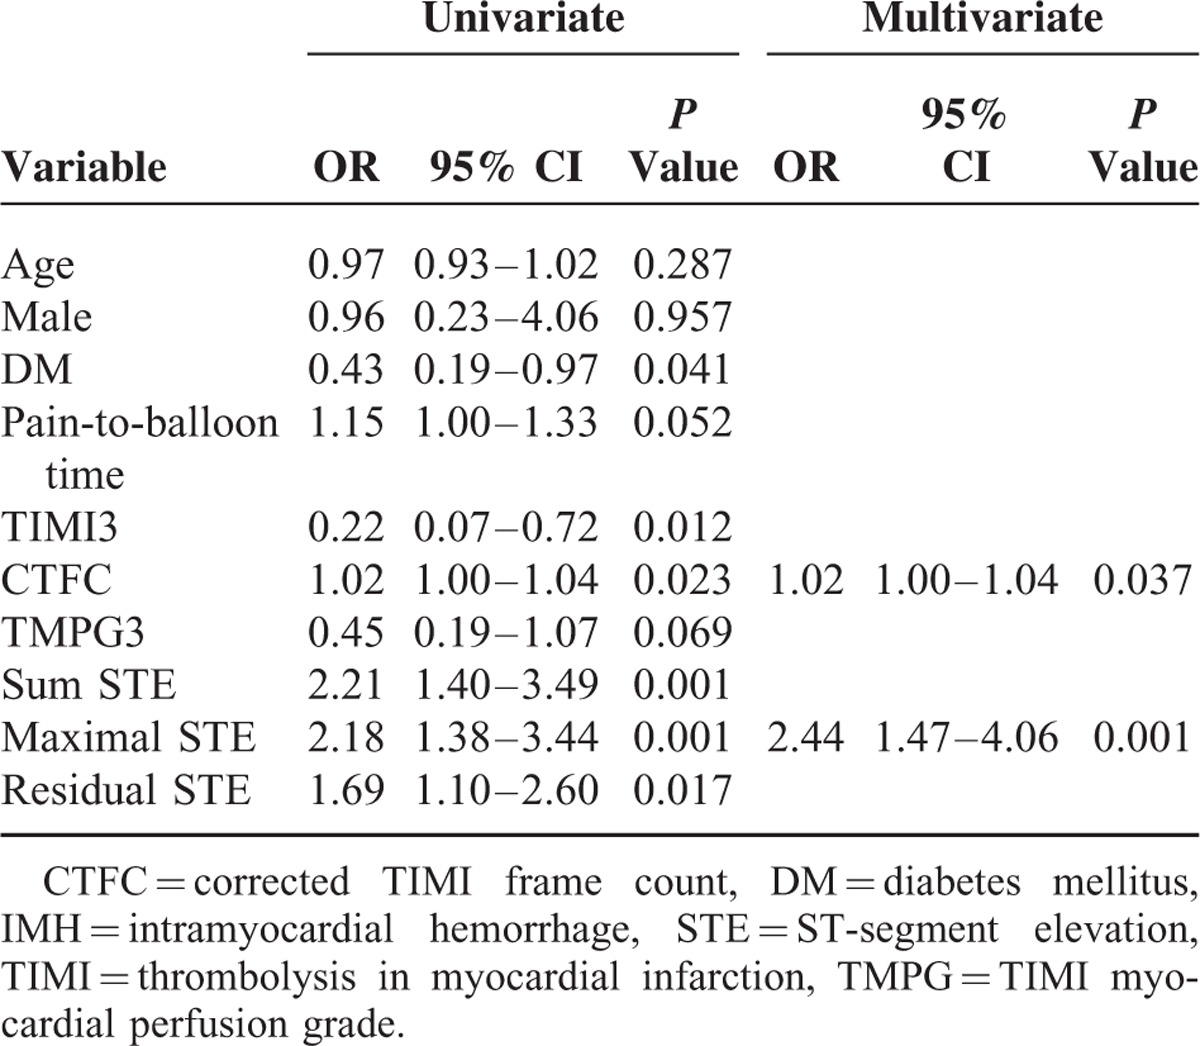
ROC analysis revealed that maximal STE (AUC = 0.697, P < 0.001) was the most powerful factor, with a threshold of 0.5 mV to differentiate IMH(+) from IMH(−) patients, whereas sum STE (AUC = 0.696, P < 0.001) was a little bit weaker than maximal STE (Table 6). In the multivariate logistic regression analysis, the variables included were age, sex, diabetes, pain-to-balloon time, final TIMI3, final CTFC, final TMPG3, sum STE, maximal STE, and residual STE. The maximal STE (OR 2.44, 95% CI 1.47–4.06, P = 0.001) and CTFC (OR 1.02, 95% CI 1.00–1.04, P = 0.037) were independent predictors of IMH on CMR imaging (Table 7).
TABLE 6.
ROC Curve Analysis for Determining ST-Segment Changes’ Threshold to Differentiate Between IMH(+) and IMH(−)

TABLE 7.
Univariate and Multivariate Logistic Regression Analysis for the Prediction of IMH
Correlation of Different ST-Segment Change Parameters With IMH Segments
ST-segment change parameters correlated with the number of IMH segments. Sum STE was the strongest correlate of the number of IMH segments (r = 0.43, P < 0.001) (Figure 4).
FIGURE 4.
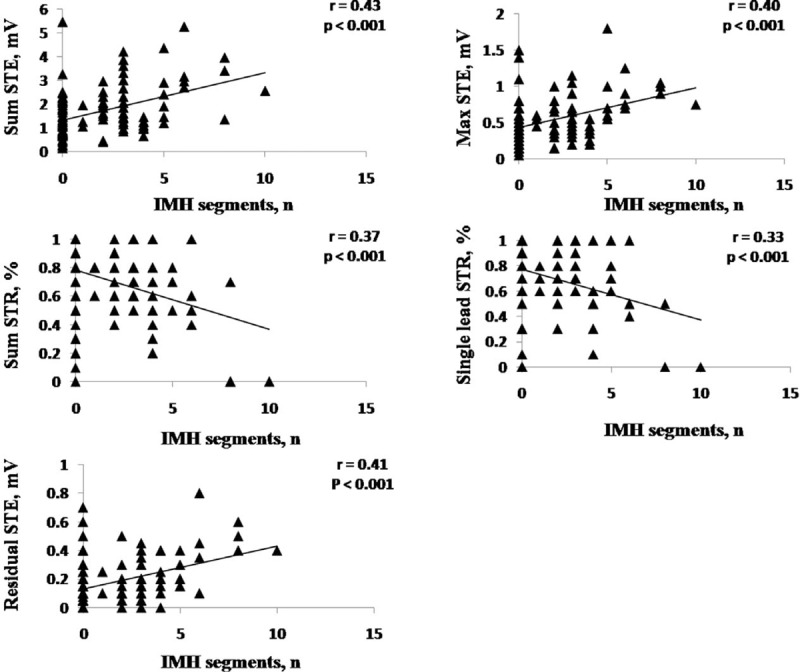
Linear correlation between different ST-segment change parameters and IMH segments. IMH = intramyocardial hemorrhage, STE = ST-segment elevation, STR = ST-segment resolution.
Interobserver and Intraobserver Variability
The intraobserver and interobserver variability for sum STE was (ICC = 0.98, 95% CI 0.97–0.99) and (ICC = 0.95, 95% CI 0.91–0.97), respectively; for maximal STE, (ICC = 0.97, 95% CI 0.93–0.99) and (ICC = 0.94, 95% CI 0.88–0.97), respectively; for sum STR (ICC = 0.98, 95% CI 0.96–0.99) and (ICC = 0.97, 95% CI 0.95–0.99), respectively; for single-lead STR (ICC = 0.95, 95% CI 0.90–0.98) and (ICC = 0.95, 95% CI 0.90–0.98), and for residual maximal STE (ICC = 0.95, 95% CI 0.90–0.98) and (ICC = 0.93, 95% CI 0.86–0.96), respectively.
DISCUSSION
The key conclusions of this study can be formulated as follows. First, MVO and IMH were frequently observed in reperfused STEMI. Second, patients with MVO and IMH had lower prevalence of post-PCI TIMI3 and TMPG3, and worse ST-segment change parameters. Third, the maximal STE was a powerful independent predictor of MVO or IMH on CMR imaging, with a common optimal cutoff value of 0.5 mV but different sensitivity and specificity to identify the presence of MVO or IMH, respectively. Fourth, sum STE was a strong correlate of the number of MVO and IMH segments.
MVO refers to the small vessel changes that impede adequate tissue perfusion despite a revascularized and patent epicardial coronary artery.8–14 Reperfusion may also cause IMH by extravasation of erythrocytes through severely damaged endothelial walls. Our study found that MVO was observed in 72% patients and IMH in 49% patients with successfully revascularized STEMI. The fact that all included patients had initial TIMI 0/1 flow could illustrate why our MVO and IMH rates were relatively high when compared with those reported previously.21,26 Previous studies found that the presence of MVO or IMH was associated with adverse clinical outcomes.10–14 In this study, MVO(+)/IMH(+) group had the largest CMR-derived IS among all the 3 groups and higher peak CKMB level than MVO(−)/IMH(−) group. These findings were consistent with the previous studies that IMH was a sign of more severe microvascular injury.10–14 In this study, CMR-derived MVO and IMH also correlated with angiography parameters assessing epicardial and myocardial perfusion, such as TIMI flow, CTFC and TMPG, except MBG. Some studies showed that MBG might underestimate CMR-derived MVO after revascularization in MI, and angiographic MBG was not sufficient to accurately assess myocardial reperfusion injury after MI in clinical trials.27
In previously reported studies, ST-segment change parameters were useful in predicting the patency of the IRA, microcirculatory level, IS, etc. In this study, although these commonly used ST-segment change parameters all got their worst value in MVO(+)/IMH(+)group, maximal STE yielded the largest AUC for predicting MVO and IMH. Of note, in a multivariate analysis adjusted for clinical and angiographic parameters, only the maximal STE was an independent predictor of the presence of MVO and IMH, whereas other ST change parameters lost their predictive value in the multivariate analysis model. Multiple factors can affect the amplitude of acute ischemic ST deviation. Profound ST-segment elevation or depression in multiple leads usually indicates very severe ischemia. The presence of MVO or IMH is qualitative index, which represents the severity of local myocardial injury, whereas maximal STE represents the existing maximum ST-segment deviation that is present on admission ECG, which is a parameter measured in a single lead. That might be the reason why maximal STE was an independent predictor of the presence of MVO and IMH in this study.
In addition, sum STE is calculated as the sum of STE in all leads, so it depended on both the STE of each lead and the number of leads with STE. The study by Rodríguez-Palomares et al16 showed that the number of leads with STE and sum STE on admission were correlated most with the area at risk. Our results showed that sum STE was the strongest correlate of the number of MVO or IMH segments, which was a semiquantitative value to quantify microvascular injury, in correlation analysis. Residual STE had shown superiority28,29 or at least equivalence30 at detecting early and late cardiac mortality when compared with the sum STR. In line with the previous studies, our results showed that residual STE was a predictor of CMR-derived MVO or IMH and performed better than STR.
Previous studies showed that poor STR is a good predictor of poor microvascular flow recovery and inferior clinical outcomes.15,16 This was also confirmed by our findings that patients with CMR-MVO had worsened STR than those without MVO. In the meanwhile, we found that STE (ie, maximal STE and sum STE) was also correlated with MVO. This can be explained that STE represents the degree (by maximal STE) and the extent (by sum STE) of ischemia. Regardless of PCI, initial severity of ischemia is another determinant of the degree of reperfusion injury and subsequent microcirculatory dysfunction.19,21,24
Of note and of implications for clinical practice is that maximal STE and sum STE constitute simple indexes that yield better diagnostic accuracy for predicting MVO or IMH. Moreover, the information on the status of the microcirculation after PCI conveyed by maximal STE and sum STE is already available at patient admission. In the present study, we have proposed an optimal threshold value of maximal STE >0.5 mV for predicting the presence of MVO or IMH in STEMI patients. This threshold might be a tool for identifying post-PCI microvascular dysfunction in patients with STEMI, as well as an evidence for initiating customized pharmacological therapy to optimize myocardial metabolism of these patients as early (ie, after ECG measurement) as possible.
The interobserver and intraobserver variability for ST-segment change parameters were systematically studied here. With a fixed ST-segment measurement point (60 ms after the end of the QRS complex J point) to measure ST-segment deviation, the reproducibility was excellent for all these 5 parameters.
Several limitations of the current analysis need to be mentioned. First, this was an observational study, and individual differences and bias should be taken into consideration when interpreting the results. Second, we were not able to measure the absolute percentage of MVO and IMH in LV volume because of the limitation of present software; therefore, the number of MVO or IMH segments, the semiquantitative parameter, was adopted to make correlation analysis with ST-segment change parameters.
CONCLUSIONS
In STEMI patients, the presence of MVO and IMH in infarcted tissue was related to ST-segment changes. Maximal STE was a powerful independent predictor of presence of MVO and IMH, whereas sum STE was a strong correlate of the number of MVO and IMH segments.
ACKNOWLEDGMENTS
Blood samples were obtained from Renji Hospital Biobank, School of Medicine, Shanghai Jiaotong University, Shanghai, China.
Footnotes
Abbreviations: AUC = area under the curve, BB T2-STIR = black blood T2 short tau inversion-recovery, CMR = cardiac magnetic resonance, CTFC = corrected TIMI frame count, ICC = intraclass coefficient of correlation, IMH = intramyocardial hemorrhage, IRA = infarct-related artery, IS = infarction size, LV = left ventricle, MBGs = myocardial blush grades, MI = myocardial infarction, MVO = microvascular obstruction, ROCs = receiver operator characteristics, STE = ST-segment elevation, STEMI = ST-elevation myocardial infarction, STR = ST-segment resolution, TMPGs = TIMI myocardial perfusion grades, TR/TE = repetition time/echo time.
SD and ZL contributed equally to this work.
This work was supported by the National Natural Science Foundation of China (81270282, 81330006, and 81400261), Shanghai Leading Talents Program (LJ10007), Program for New Century Excellent Talents in University from Ministry of Education of China (NCET-12–0352), Shanghai Shuguang Program (12SG22), Program of Shanghai Committee of Science and Technology (15411963600 and 14JC1404500), Shanghai Emerging Technology Program (SHDC12013119), and Shanghai Jiao Tong University School of Medicine (14XJ10019).
The authors have no conflicts of interest to disclose.
REFERENCES
- 1.Pu J, Mintz GS, Brilakis ES, et al. In vivo characterization of coronary plaques: novel findings from comparing greyscale and virtual histology intravascular ultrasound and near-infrared spectroscopy. Eur Heart J 2012; 33:372–383. [DOI] [PubMed] [Google Scholar]
- 2.Pu J, Mintz GS, Biro S, et al. Insights into echo-attenuated plaques, echolucent plaques, and plaques with spotty calcification: novel findings from comparisons among intravascular ultrasound, near-infrared spectroscopy, and pathological histology in 2294 human coronary artery segments. J Am Coll Cardiol 2014; 63:2220–2233. [DOI] [PubMed] [Google Scholar]
- 3.Huang B, Wang X, Yang Y, et al. Association of admission glycaemia with high grade atrioventricular block in ST-segment elevation myocardial infarction undergoing reperfusion therapy: an observational study. Medicine 2015; 94:e1167. [DOI] [PMC free article] [PubMed] [Google Scholar]
- 4.Su D, Yan B, Guo L, et al. Intra-aortic balloon pump may grant no benefit to improve the mortality of patients with acute myocardial infarction in short, long term: an updated meta-analysis. Medicine 2015; 94:e876. [DOI] [PMC free article] [PubMed] [Google Scholar]
- 5.Ding S, Pu J, Qiao ZQ, et al. TIMI myocardial perfusion frame count: a new method to assess myocardial perfusion, its predictive value for short-term prognosis. Catheter Cardiovasc Interv 2010; 75:722–732. [DOI] [PubMed] [Google Scholar]
- 6.Pu J, Shan P, Ding S, et al. Gender differences in epicardial and tissue-level reperfusion in patients undergoing primary angioplasty for acute myocardial infarction. Atherosclerosis 2011; 215:203–208. [DOI] [PubMed] [Google Scholar]
- 7.Ding S, Xu L, Yang F, et al. Association between tissue characteristics of coronary plaque and distal embolization after coronary intervention in acute coronary syndrome patients: insights from a meta-analysis of virtual histology-intravascular ultrasound studies. PLoS One 2014; 9:e106583. [DOI] [PMC free article] [PubMed] [Google Scholar]
- 8.Beek AM, Nijveldt R, van Rossum AC. Intramyocardial hemorrhage and microvascular obstruction after primary percutaneous coronary intervention. Int J Cardiovasc Imaging 2010; 26:49–55. [DOI] [PMC free article] [PubMed] [Google Scholar]
- 9.Robbers LF, Eerenberg ES, Teunissen PF, et al. Magnetic resonance imaging-defined areas of microvascular obstruction after acute myocardial infarction represent microvascular destruction and haemorrhage. Eur Heart J 2013; 34:2346–2353. [DOI] [PubMed] [Google Scholar]
- 10.Kidambi A, Mather AN, Motwani M, et al. The effect of microvascular obstruction and intramyocardial hemorrhage on contractile recovery in reperfused myocardial infarction: insights from cardiovascular magnetic resonance. J Cardiovasc Magn Reson 2013; 15:58. [DOI] [PMC free article] [PubMed] [Google Scholar]
- 11.Hamirani YS, Wong A, Kramer CM, et al. Effect of microvascular obstruction and intramyocardial hemorrhage by CMR on LV remodeling and outcomes after myocardial infarction: a systematic review and meta-analysis. JACC Cardiovasc Imaging 2014; 7:940–952. [DOI] [PMC free article] [PubMed] [Google Scholar]
- 12.Symons R, Masci PG, Goetschalckx K, et al. Effect of infarct severity on regional and global left ventricular remodeling in patients with successfully reperfused ST segment elevation myocardial infarction. Radiology 2015; 274:93–102. [DOI] [PubMed] [Google Scholar]
- 13.Kandler D, Lücke C, Grothoff M, et al. The relation between hypointense core, microvascular obstruction and intramyocardial haemorrhage in acute reperfused myocardial infarction assessed by cardiac magnetic resonance imaging. Eur Radiol 2014; 24:3277–3288. [DOI] [PMC free article] [PubMed] [Google Scholar]
- 14.Husser O, Monmeneu JV, Sanchis J, et al. Cardiovascular magnetic resonance-derived intramyocardial hemorrhage after STEMI: Influence on long-term prognosis, adverse left ventricular remodeling and relationship with microvascular obstruction. Int J Cardiol 2013; 167:2047–2054. [DOI] [PubMed] [Google Scholar]
- 15.Dizon JM, Brener SJ, Maehara A, et al. Relationship between ST-segment resolution and anterior infarct size after primary percutaneous coronary intervention: analysis from the INFUSE-AMI trial. Eur Heart J Acute Cardiovasc Care 2014; 3:78–83. [DOI] [PMC free article] [PubMed] [Google Scholar]
- 16.Rodríguez-Palomares JF, Figueras-Bellot J, Descalzo M, et al. Relation of ST-segment elevation before and after percutaneous transluminal coronary angioplasty to left ventricular area at risk, myocardial infarct size, and systolic function. Am J Cardiol 2014; 113:593–600. [DOI] [PubMed] [Google Scholar]
- 17.Horszczaruk GJ, Kwasiborski P, Rdzanek A, et al. TIMI myocardial perfusion grade and ST-segment resolution in the assessment of coronary reperfusion after primary angioplasty. Kardiol Pol 2014; 72:27–33. [DOI] [PubMed] [Google Scholar]
- 18.Wong CK, Gao W, Stewart RA, et al. The prognostic meaning of the full spectrum of aVR ST-segment changes in acute myocardial infarction. Eur Heart J 2012; 33:384–392. [DOI] [PubMed] [Google Scholar]
- 19.Husser O, Bodí V, Sanchis J, et al. The sum of ST-segment elevation is the best predictor of microvascular obstruction in patients treated successfully by primary percutaneous coronary intervention. Cardiovascular magnetic resonance study. Rev Esp Cardiol 2010; 63:1145–1154. [DOI] [PubMed] [Google Scholar]
- 20.Kim JS, Ko YG, Yoon SJ, et al. Correlation of serial cardiac magnetic resonance imaging parameters with early resolution of ST-segment elevation after primary percutaneous coronary intervention. Circ J 2008; 72:1621–1626. [DOI] [PubMed] [Google Scholar]
- 21.Weaver JC, Ramsay DD, Rees D, et al. Dynamic changes in ST segment resolution after myocardial infarction and the association with microvascular injury on cardiac magnetic resonance imaging. Heart Lung Circ 2011; 20:111–118. [DOI] [PubMed] [Google Scholar]
- 22.Nijveldt R, van der Vleuten PA, Hirsch A, et al. Early electrocardiographic findings and MR imaging-verified microvascular injury and myocardial infarct size. JACC Cardiovasc Imaging 2009; 2:1187–1194. [DOI] [PubMed] [Google Scholar]
- 23.Thygesen K, Alpert JS, White HD, et al. Universal definition of myocardial infarction. Circulation 2007; 116:2634–2653. [DOI] [PubMed] [Google Scholar]
- 24.Schröder R. Prognostic impact of early ST-segment resolution in acute ST-elevation myocardial infarction. Circulation 2004; 110:e506–510. [DOI] [PubMed] [Google Scholar]
- 25.Cerqueira MD, Weissman NJ, Dilsizian V, et al. Standardized myocardial segmentation and nomenclature for tomographic imaging of the heart. A statement for healthcare professionals from the Cardiac Imaging Committee of the Council on Clinical Cardiology of the American Heart Association. Circulation 2002; 105:539–542. [DOI] [PubMed] [Google Scholar]
- 26.Bogaert J, Kalantzi M, Rademakers FE, et al. Determinants and impact of microvascular obstruction in successfully reperfused ST-segment elevation myocardial infarction. Assessment by magnetic resonance imaging. Eur Radiol 2007; 17:2572–2580. [DOI] [PubMed] [Google Scholar]
- 27.Vicente J, Mewton N, Croisille P, et al. Comparison of the angiographic myocardial blush grade with delayed-enhanced cardiac magnetic resonance for the assessment of microvascular obstruction in acute myocardial infarctions. Catheter Cardiovasc Interv 2013; 74:1000–1007. [DOI] [PubMed] [Google Scholar]
- 28.Brodie BR, Stuckey TD, Hansen C, et al. Relation between electrocardiographic ST-segment resolution and early and late outcomes after primary percutaneous coronary intervention for acute myocardial infarction. Am J Cardiol 2005; 95:343–348. [DOI] [PubMed] [Google Scholar]
- 29.McLaughlin MG, Stone GW, Aymong E, et al. Controlled Abciximab and Device Investigation to Lower Late Angioplasty Complications trial. Prognostic utility of comparative methods for assessment of ST-segment resolution after primary angioplasty for acute myocardial infarction: the Controlled Abciximab and Device Investigation to Lower Late Angioplasty Complications (CADILLAC) trial. J Am Coll Cardiol 2004; 44:1215–1223. [DOI] [PubMed] [Google Scholar]
- 30.Buller CE, Fu Y, Mahaffey KW, et al. ST-segment recovery and outcome after primary percutaneous coronary intervention for ST-elevation myocardial infarction: insights from the Assessment of Pexelizumab in Acute Myocardial Infarction (APEX-AMI) trial. Circulation 2008; 118:1335–1346. [DOI] [PubMed] [Google Scholar]


