

Supplemental Digital Content is available in the text
Abstract
Peroxisome proliferator-activated receptor α (PPARα) is an important regulator of glucose and lipid metabolism, and is predominantly expressed in the liver. We aimed to evaluate the effect of donor hepatic PPARα gene polymorphisms on the development of metabolic disorders following liver transplantation (LT).
A total of 176 patients undergoing primary LT were included in this Review Board-approved study. Genomic DNA was extracted from fresh frozen donor liver tissues (biopsy specimens for pathological testing at surgery). Eight single nucleotide polymorphisms in the PPARα gene were chosen from either the HapMap CHB database or previous reports.
The distribution of metabolic disorders differed significantly between the wild-type and variant genotypes of both the rs5767743 and rs5767700 loci (P < 0.05 for all). After an adjustment for other factors (body mass index and tacrolimus blood concentration), the rs5767743 genetic variant was found to be an independent protective factor (P = 0.005, odds ratio = 0.416 per C allele, 95% confidence interval = 0.225–0.768). When compared with the wild-type genotype, the variant genotypes rs5767743 and rs5767700 correlated with significantly increased PPARα and CYP3A4 mRNA expression and lower tacrolimus trough concentration/dose ratios (P < 0.05 for all).
Donor PPARα gene polymorphisms influence the susceptibility to metabolic disorders following LT and may also be associated with a fasten tacrolimus metabolism because of elevated CYP3A4 expression.
INTRODUCTION
Metabolic disorder is one of the most universal and serious complications following liver transplantation (LT). More than one-third of liver transplant recipients may have metabolic disorder (ie, diabetes mellitus, dyslipidemia, hypertension, and obesity) and the prevalence will elevate along with increased life expectancy.1 There is an increasing interest in investigating metabolic disorder because its primary clinical outcome has been identified as cardiovascular disease, which is the third (following hepatic and malignancy) leading cause of late death following LT.2,3 Identifying recipients at potential risk of developing metabolic disorder is therefore essential and beneficial for preventing cardiovascular disease and improving recipients’ long-term outcome and standard of living.
To date, various kinds of clinical parameters have been described as risk factors for developing metabolic disorder, including old age, obesity, hepatitis C infection, renal dysfunction, and immunosuppressive medication. In addition to clinical parameters, genetic factors also play important roles in the development of human diseases.4 The peroxisome proliferator-activated receptors (PPARs), which compose a subfamily of nuclear hormone receptors, have long been considered to be key regulators of metabolic status.5,6 Particularly in the liver, PPARs regulate a whole spectrum of physiological functions, including lipid and glucose metabolism, cholesterol and bile acid homeostasis, insulin sensitivity, inflammatory responses, and regenerative mechanisms.7
The donor liver is a vital organ for metabolism in liver transplant recipients. Our previous studies demonstrated that genetic variants in the donor liver were associated with the development of new-onset diabetes8 and changes in the pharmacokinetics of tacrolimus9 following LT. In this study, we aim to evaluate the effect of donor PPAR gene polymorphisms on the development of a metabolic disorder following LT. The PPARα isoform was chosen because it is predominantly expressed in the liver, whereas the other 2 isoforms are not.5 Moreover, PPARα gene polymorphisms were recently found to be a novel genetic determinant of hepatic cytochrome P450 3A4 (CYP3A4) expression,10 which is the main cytochrome P450 isoform in human liver that is also involved in the metabolism of many drugs, including tacrolimus.11 Therefore, our secondary purpose was to assess whether genetic variants in the donor PPARα gene were involved in the regulation of hepatic CYP3A4 expression and subsequently associated with the tacrolimus response.
PATIENTS AND METHODS
Patients
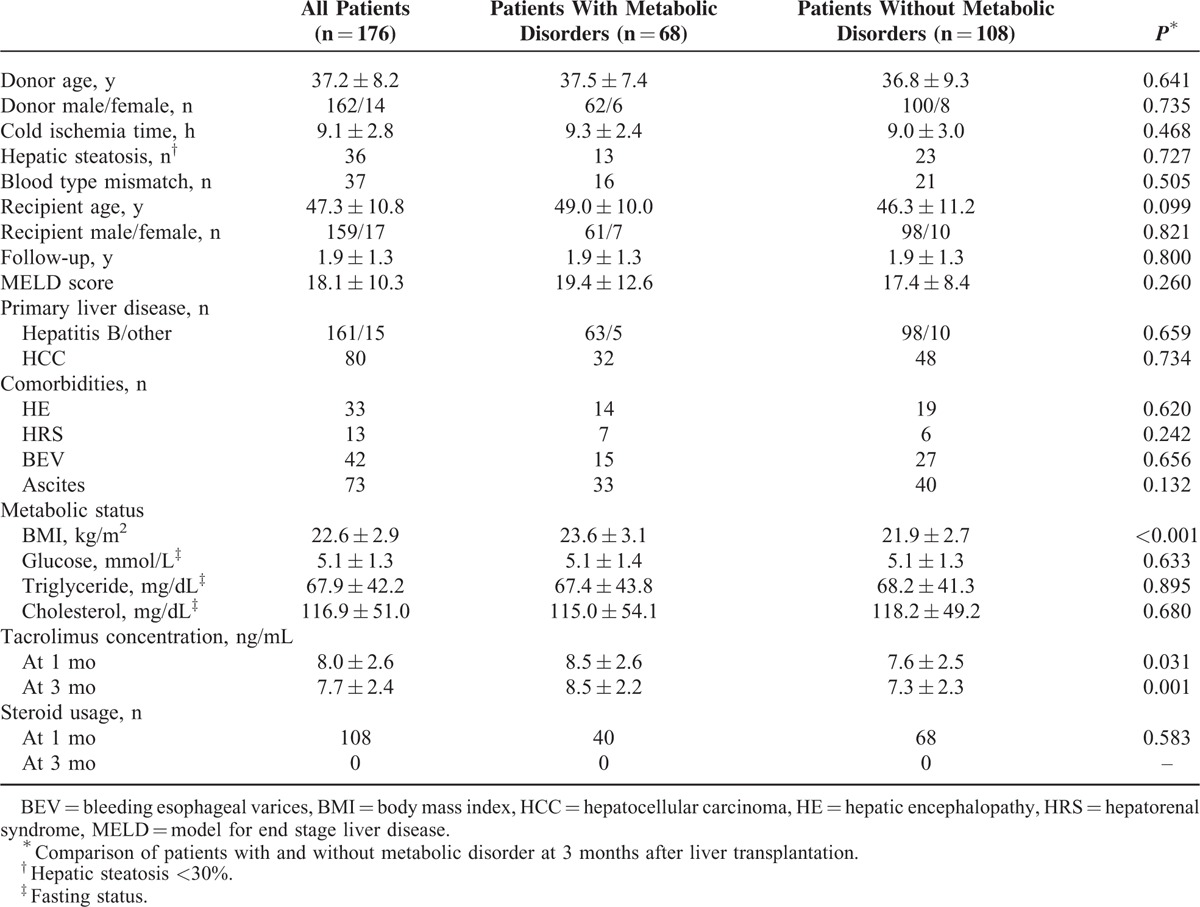
All of the patients undergoing primary LT between January 2010 and October 2012 at the First Affiliated Hospital, Zhejiang University School of Medicine, China, were enrolled. We excluded patients with a history of glucose or lipid disorder, those receiving a donor with moderate hepatic steatosis (>30%), or those with <3-month follow-up time. Patients who developed acute rejection and required a high-dose immunosuppressant treatment were also excluded. A total of 176 patients were included, and their main characteristics are shown in Table 1.
TABLE 1.
Patient Characteristics
This study was approved by the Institutional Review Board of our hospital, the current regulation of the Chinese Government, and the Declaration of Helsinki. All authors had access to the study data and had reviewed and approved the final manuscript. Written informed consents were obtained. No donor organs were obtained from executed prisoners.
Information from both donors and recipients were recorded. The pretransplant data, including age, sex, body mass index (BMI), primary liver disease, comorbidities, and biochemistry parameters were collected 24 hours before transplantation. All of the patients received triple immunosuppressant therapy, which incorporates tacrolimus, mycophenolate, and a steroid, according to the standard protocol.8 Tacrolimus trough levels were detected using Microparticle Enzyme Innumoassay on the IMx analysers as reported previously.9
Definition
The presence of a metabolic disorder was defined by either diabetes, hypertriglyceridemia, or hypercholesterolemia. Diabetes was defined as a fasting glucose level of at least 7 mmol/L, confirmed on at least 2 occasions, or the need for antidiabetic drugs.8 Hypertriglyceridemia was defined as serum triglycerides ≥150 mg/dL or the need for a pharmacologic treatment.12 Hypercholesterolemia was defined as serum cholesterol ≥200 mg/dL or the need for a pharmacologic treatment.12
Genotyping
Genomic DNA was extracted from fresh frozen donor liver tissues (biopsy specimens for pathological testing at surgery) using Maxwell 16 Tissue DNA Purification Kit (Promega, Madison, WI). Single nucleotide polymorphisms (SNPs) in PPARα gene were chosen from HapMap CHB database with a minor allele frequency (MAF) of >0.2 and r2 of >0.8. Six tag SNPs (rs5767700, rs4253681, rs135549, rs12330015, rs5767743, and rs129600) were selected (see Table, Supplemental Digital Content 1, http://links.lww.com/MD/A391, which describes the characteristics of selected SNPs). Another 2 (rs1800206 and rs4253728) were also chosen because they were reported to be associated with hypertriglyceridemia and CYP3A4, respectively.10,13 SNPs were detected using Applied Biosystems SNaPShot technology, and polymerase chain reaction (PCR) sequencing (only for rs5767700), as described previously.8
Quantitative PCR
Quantitative PCR was performed using Real-Time PCR System 9500 (Applied Biosystems, Carlsbad, CA) and SDS 2.1 software (Applied Biosystems). All reactions were measured in triplicates in a final volume of 20 μL. The PCR primer and Tagman probe are shown (see Table, Supplemental Digital Content 2, http://links.lww.com/MD/A391, which shows the PCR primers). Cycling conditions were chosen according to the manufacturer's protocols. Briefly, qRT-PCR started with the incubation of samples at 95°C for 2 minutes, and repeated for 40 cycles with incubation at 95°C for 10 seconds followed by at 60°C for 30 seconds. The cycle number at which the real-time PCR reaction reached an arbitrarily determined cycle threshold (CT) was recorded for both the mRNA and glyceraldehyde-3-phosphate dehydrogenase (GAPDH), and the relative amount of mRNA to GAPDH was described as 2−ΔΔCT, where ΔCTx = (CT mRNAx − CT GAPDHx) and ΔΔCTx = (ΔCTx − ΔCT mean).
Statistical Analysis
The quantitative variables were expressed as mean ± standard deviation or median and compared by Student t test or Mann–Whitney U test. The categorical variables were presented as values (percentage) and compared by Pearson χ2 test. The risk factors for metabolic disorders were evaluated by logistic regression analysis. The correlation was analyzed using Pearson linear regression. Variables with statistical significance in univariate analysis were transferred to a stepwise forward multivariate regression analysis. Haploview software and SNPStats web tool (http://bioinfo.iconcologia.net/snpstats/start.htm) were used to analyze the Hardy–Weinberg equilibrium and linkage disequilibrium. SPSS version 13.0 (SPSS Inc, Chicago, IL) was used to complete other statistical analysis. A P value of <0.05 was considered to be statistically significant.
RESULTS
Association Between Donor PPARα Gene Polymorphisms and Metabolic Disorder in Liver Transplant Recipients
The genotype distribution was in accordance with the Hardy–Weinberg equilibrium (Supplemental Table 1, http://links.lww.com/MD/A391). Two SNPs (rs1800206 and rs4253728) were excluded from further analysis because of an extremely low MAF. Strong linkage disequilibrium (r2 > 0.8) was not found.
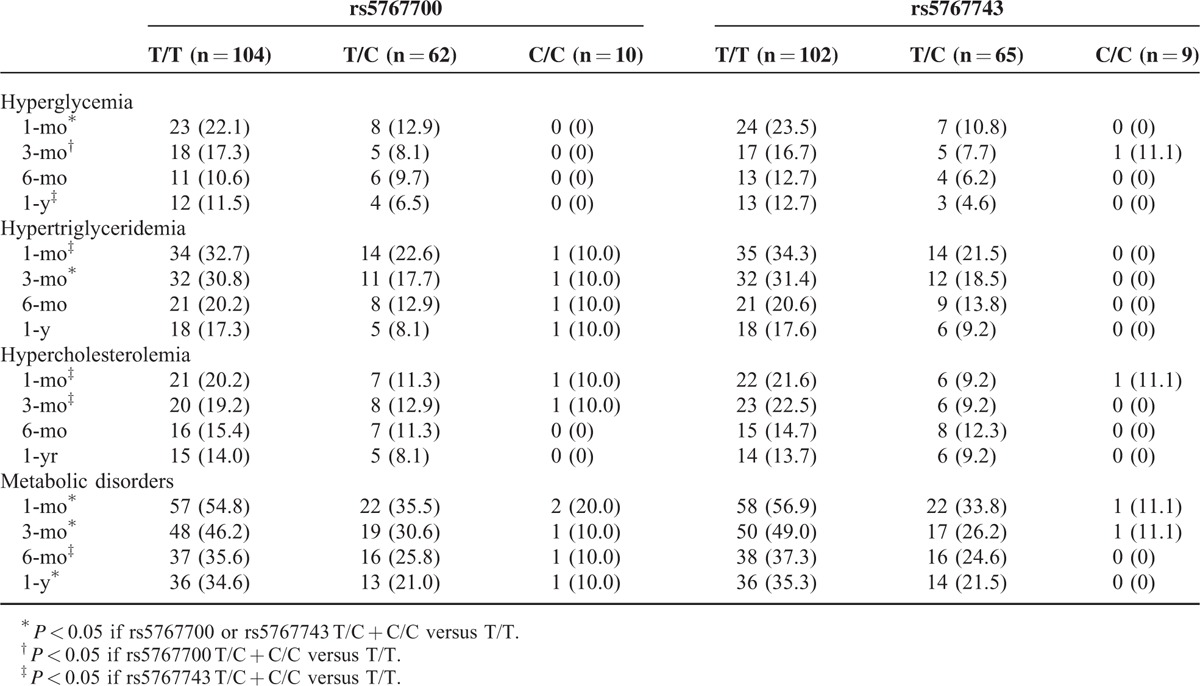
A metabolic disorder developed in 46.0%, 40.5%, 30.7%, and 28.4% of the study population at 1, 3, 6 months and 1 year after LT, respectively. The distribution of the metabolic disorders differed significantly between the wild-type and variant genotypes in both the rs5767700 and rs5767743 loci (Table 2) but not others (see Table, Supplemental Digital Content 3, http://links.lww.com/MD/A391, which shows the incidence of post-transplant metabolic disorders in different genotypes). In logistic regression analysis, rs5767743 was significantly associated with a metabolic disorder at 1 month (P = 0.001, odds ratio [OR] = 0.364, 95% confidence interval [CI] = 0.207–0.640), 3 months (P = 0.001, OR = 0.366, 95% CI = 0.202–0.663), 6 months (P = 0.011, OR = 0.445, 95% CI = 0.239–0.828), and 1 year (P = 0.008, OR = 0.417, 95% CI = 0.218–0.799) after LT; rs5767700 was significantly associated with a metabolic disorder at 1 month (P = 0.004, OR = 0.454, 95% CI = 0.265–0.776), 3 months (P = 0.007, OR = 0.462, 95% CI = 0.263–0.811), and 1 year (P = 0.024, OR = 0.487, 95% CI = 0.261–0.908) following LT. In addition, the incidence of hepatic steatosis did not differ significantly between wild-type and variant genotypes of PPARα gene polymorphisms.
TABLE 2.
The Incidence of Post-Transplant Metabolic Disorders in Different Genotypes
Risk Factors of Metabolic Disorders Following LT
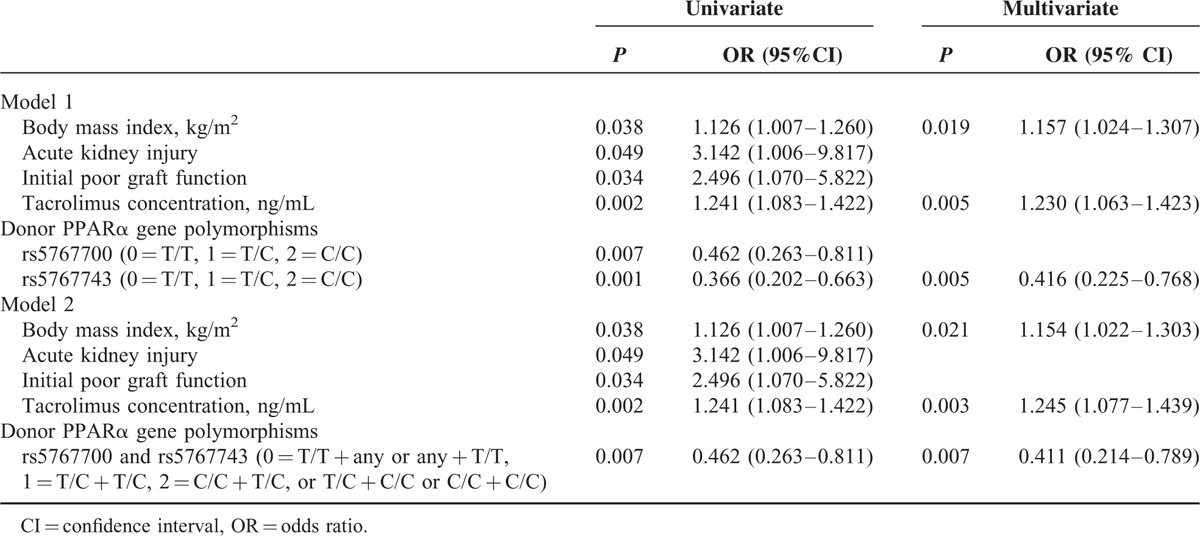
To exclude the remarkable impact of surgical stress on metabolic status during early post-transplant period, we took the presence of a metabolic disorder at 3 months as the final event in the risk factors analysis. Along with the donor's genetic factors, the possible clinical risk factors including pretransplant (ie, age, sex, cold ischemia time, BMI, model for end-stage liver disease score, fasting plasma glucose, serum triglyceride, and cholesterol) and post-transplant parameters (blood tacrolimus concentration, tacrolimus dose, acute kidney injury, and initial poor graft function) were put into logistic analysis. In univariate analysis, BMI, acute kidney injury, initial poor graft function, blood tacrolimus concentration, donor PPARα gene rs5767700, and rs5767743 polymorphisms were found to be significantly associated with metabolic disorders and subsequently entered into multivariate analysis. Finally, the BMI, blood tacrolimus concentration, and donor PPARα rs5767743 polymorphisms were identified as the independent influencing factors of metabolic disorders following LT (Table 3). Furthermore, because the 2 loci were partially linked (r2 = 0.40), a haplotype was established (see Table, Supplemental Digital Content 4, http://links.lww.com/MD/A391, which presents the association between haplotype and metabolic disorders following LT), and the combination of the 2 SNPs showed the independent predictive efficiency on the development of metabolic disorders (Table 3).
TABLE 3.
Risk Factors of the Metabolic Disorders (at 3 Months) Following Liver Transplantation
The association between the blood tacrolimus concentration and the development of a metabolic disorder was further analyzed. There were significant differences in the blood tacrolimus concentrations at 1 month (8.5 ± 2.6 vs 7.7 ± 2.5 ng/mL, P = 0.031) and 3 months (8.3 ± 2.2 vs 7.3 ± 2.4 ng/mL, P = 0.001) between the patients with and without a metabolic disorder. The blood tacrolimus concentration was significantly correlated with a metabolic disorder at 1 and 3 months after LT (P = 0.017, r = 0.180; P = 0.001, r = 0.241, respectively).
Effect of Donor PPARα Gene Polymorphisms on Tacrolimus Response and CYP3A4 Expression
The blood concentration (range: 1.87–22.02 ng/mL) differed dramatically among individuals at 1 week following LT (Figure 1) and the tacrolimus dose was adjusted accordingly. Both the tacrolimus trough concentration/dose (C/D) ratio and blood concentration were significantly lower in the rs5767700 C/C and T/C variant genotypes compared with the T/T wild-type genotype at 1 week, 1 month, and 3 months following LT (Figure 1). The rs5767743 genotypes showed similar effects compared with the rs5767700 genotypes in regards to the tacrolimus response.
FIGURE 1.
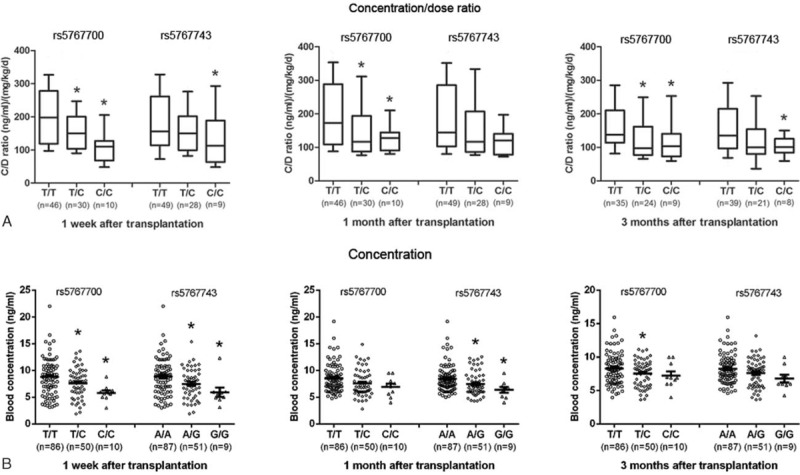
The tacrolimus trough concentration/dose ratio (A) and blood concentration (B) were different among the different genotypes of rs5767700 and rs5767743. ∗P < 0.05 versus the T/T genotype using Student t test with a multiple test correction (Bonferroni). The data are showed as box-and-whisker plot (A) and scatter dot plot (B).
Moreover, the effect of the donor PPARα gene polymorphisms on gene expression was evaluated. The PPARα and CYP3A4-1 mRNA expression increased in an allele-dependent manner in the rs5767700 and rs5766743 variant genotypes (Figure 2).
FIGURE 2.
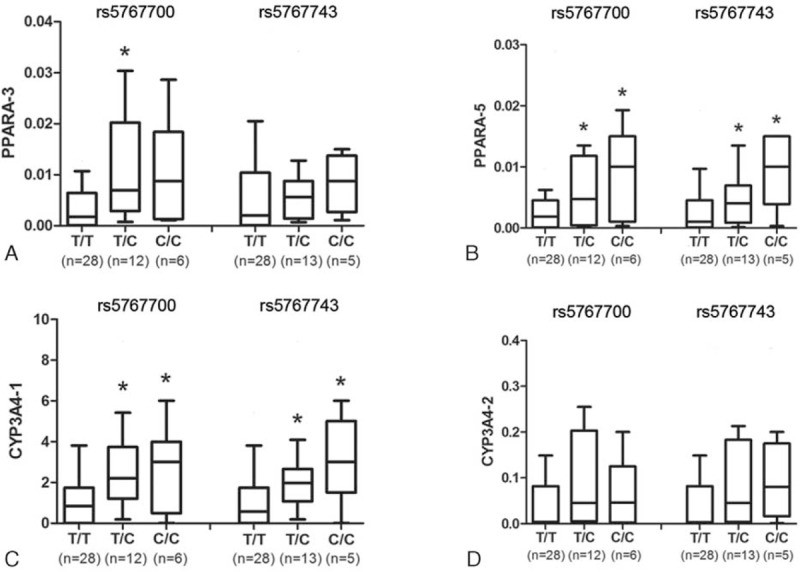
Hepatic PPARα (Splice pattern: PPARα-3 [A] and PPARα-5 [B]) and CYP3A4 (Splice pattern: CYP3A4-1 [C] and CYP3A4-2 [D]) mRNA expressions differed among different genotypes of rs5767700 and rs5767743. ∗P < 0.05 versus the T/T genotype using Mann–Whitney U test with multiple test correction (Bonferroni). The data are showed as box-and-whisker plot.
DISCUSSION
Several PPARα-coding polymorphisms have been reported previously. For instance, genetic variant in rs1800206 was found to be associated with increased serum fasting cholesterol and triglyceride levels,14 and high insulin resistance.15 Genetic variants in rs1800234 and rs4253778 were related with low lipid levels, and had protective roles in hyperlipidemia, obesity, and cardiovascular diseases.16 However, ethnological diversity greatly limited the verification of these findings in the Han Chinese population. Because of extremely low MAF, these loci were excluded. Instead, another 6 loci with MAFs of >0.2 and r2 values of >0.8 were included. Among these loci, 2 polymorphisms, both of which are C to T substitutions at intron 5 of the PPARα gene (rs5767700, Position: 46612672 and rs5767743, Position: 46621994), were revealed to be associated with the development of a metabolic disorder. The donor genetic variants of these 2 loci showed a significant reduction in the incidence of diabetes and hyperlipidemia in liver transplant recipients. Furthermore, the C to T variant in the donor PPARα gene rs5767743 locus was demonstrated to be an independent protective factor against a metabolic disorder following LT and presented an equal predictive efficiency when combined with the 2 SNPs. This suggests that rs5767743 may have a closer association with the development of a metabolic disorder following LT than rs5767700.
To investigate the possible mechanism, we compared the expressions of hepatic PPARα mRNA among different genotypes and found that both splicing patterns of PPARα gene, encoding the same protein, had higher expression levels in the variant genotypes than the wild-type genotype. Because an induction of hepatic PPARα gene expression level could improve hyperlipidemia and hepatic steatosis,5,6 we speculated that genetic variants in the hepatic rs5767743 and rs5767700 loci may increase the PPARα gene expression level and subsequently ameliorate the development of a metabolic disorder, although a detailed mechanism still needs to be explored.
Another important finding was that genetic variants in the donor rs5767743 and rs5767700 loci could not only elevate the PPARα mRNA expression, but could also upregulate the expression of hepatic CYP3A4. This result is consistent with previous reports that a potent PPARα agonist (WY14643) could lead to a 3-fold induction of CYP3A4 in human hepatocytes, whereas the antagonist MK886 or PPARα silencing resulted in a remarkable suppression.17 Consequently, the hepatic tacrolimus metabolism was accelerated, and the tacrolimus trough C/D ratio was decreased. It is important to note that the tacrolimus dose requirements differ sharply among individuals, and it would take >1 month to adjust the blood concentration within a reference range. Tacrolimus is a concentration-critical drug, and its high blood concentration has been considered to be an independent risk factor for new-onset diabetes8 and hyperlipidemia18 in Chinese liver transplant recipients. To avoid drug toxicity during the “adjustment” time, we did not increase the drug dose when the blood concentration was within the reference range.
BMI is an independent influencing factor for the development of a metabolic disorder following LT. In Western countries, overweight and obesity are severe social problems, and increase the likelihood of various diseases, including diabetes, hyperlipidemia, and cardiovascular disease.19 A number of studies have shown that high pretransplant BMI significantly increased the risk of metabolic disorders following LT.1,3 However, as we reported in the previous study,8 liver transplant candidates are more likely to be malnutrition rather than obesity in China. BMI is much lower in Chinese patients compared with those from Western countries. In this study, no patient was obese (BMI > 30 kg/m2), neither pretransplant nor post-transplant. Therefore, whether overweight contributes to the development of a metabolic disorder in Chinese liver transplant recipients still needs to be investigated.
There were some limitations in this study. First, the study sample was relatively small. Considering the rarity of adequate donor liver tissues, this study has provided considerable donor genetic data. Second, there was a low incidence of post-transplant hypertension and obesity, so these factors were excluded. Third, patients receiving donors with moderate hepatic steatosis (>30%) were excluded to minimize the influence of fatty liver itself in the recipients’ metabolic disorders and better elucidate the effect of genetic factors. But this is a bias when analyzing the association between PPARα gene polymorphisms and hepatic steatosis. Whether these genetic variants were associated with metabolic status in normal people needs to be further explored.
In conclusion, the present study is the first study to provide evidence that donor liver PPARα genetic variants are independently associated with the development of a metabolic disorder in liver transplant recipients. The genetic variants in 2 loci (rs5767700 and rs5767743) could be novel genetic determinants of CYP3A4 expression and had an impact on the tacrolimus response. Therefore, the detection of donor PPARα gene polymorphisms may help to evaluate the risk of developing a metabolic disorder and the tacrolimus dose requirement following LT. In addition, hepatic PPARα expression is reported to be associated with ischemia-reperfusion injury.20 Therefore, strategies based on hepatic PPARα regulation have the potential to improve the prognosis of patients undergoing LT21 and to expand the organ donor pool, which is in great shortage.
Acknowledgments
The authors thank Wiley English Language Editing Service for a English polish.
Footnotes
Abbreviations: BMI = body mass index, C/D = concentration/dose, CT = cycle threshold, CYP3A4 = cytochrome P450 3A4, LT = liver transplantation, MAF = minor allele frequency, PPAR = peroxisome proliferator-activated receptor, SNP = single nucleotide polymorphism.
This work was supported by the National Natural Science Foundation of China (81470892), National High Technology Research and Development Program of China (863 Program 2012AA020204), and The “New-Century 151 Talent Program” of Zhejiang Province (the 1st level).
The authors have no conflicts of interest to disclose.
Supplemental digital content is available for this article. Direct URL citations appear in the printed text and are provided in the HTML and PDF versions of this article on the journal's Website (www.md-journal.com).
REFERENCES
- 1.Laish I, Braun M, Mor E, et al. Metabolic syndrome in liver transplant recipients: prevalence, risk factors, and association with cardiovascular events. Liver Transpl 2011; 17:15–22. [DOI] [PubMed] [Google Scholar]
- 2.Watt KD, Pedersen RA, Kremers WK, et al. Evolution of causes and risk factors for mortality post-liver transplant: results of the NIDDK long-term follow-up study. Am J Transplant 2010; 10:1420–1427. [DOI] [PMC free article] [PubMed] [Google Scholar]
- 3.Laryea M, Watt KD, Molinari M, et al. Metabolic syndrome in liver transplant recipients: prevalence and association with major vascular events. Liver Transpl 2007; 13:1109–1114. [DOI] [PubMed] [Google Scholar]
- 4.Hu M, Yang YL, Ng CF, et al. Effects of phenotypic and genotypic factors on the lipid responses to niacin in chinese patients with dyslipidemia. Medicine (Baltimore) 2015; 94:e881. [DOI] [PMC free article] [PubMed] [Google Scholar]
- 5.Monsalve FA, Pyarasani RD, Delgado-Lopez F, et al. Peroxisome proliferator-activated receptor targets for the treatment of metabolic diseases. Mediators Inflamm 2013; 2013:549627. [DOI] [PMC free article] [PubMed] [Google Scholar]
- 6.Moseley RH. Therapy for nonalcoholic fatty liver disease. J Clin Gastroenterol 2008; 42:332–335. [DOI] [PubMed] [Google Scholar]
- 7.Peyrou M, Ramadori P, Bourgoin L, et al. PPARs in liver diseases and cancer: epigenetic regulation by microRNAs. PPAR Res 2012; 2012:757803. [DOI] [PMC free article] [PubMed] [Google Scholar]
- 8.Ling Q, Xie H, Lu D, et al. Association between donor and recipient TCF7L2 gene polymorphisms and the risk of new-onset diabetes mellitus after liver transplantation in a Han Chinese population. J Hepatol 2013; 58:271–277. [DOI] [PubMed] [Google Scholar]
- 9.Yu S, Wu L, Jin J, et al. Influence of CYP3A5 gene polymorphisms of donor rather than recipient to tacrolimus individual dose requirement in liver transplantation. Transplantation 2006; 81:46–51. [DOI] [PubMed] [Google Scholar]
- 10.Klein K, Thomas M, Winter S, et al. PPARA: a novel genetic determinant of CYP3A4 in vitro, in vivo. Clin Pharmacol Ther 2012; 91:1044–1052. [DOI] [PubMed] [Google Scholar]
- 11.Elens L, van Gelder T, Hesselink DA, et al. CYP3A4∗22: promising newly identified CYP3A4 variant allele for personalizing pharmacotherapy. Pharmacogenomics 2013; 14:47–62. [DOI] [PubMed] [Google Scholar]
- 12.Ling Q, Wang K, Lu D, et al. Major influence of renal function on hyperlipidemia after living donor liver transplantation. World J Gastroenterol 2012; 18:7033–7039. [DOI] [PMC free article] [PubMed] [Google Scholar]
- 13.Gu SJ, Liu MM, Guo ZR, et al. Gene-gene interactions among PPARalpha/delta/gamma polymorphisms for hypertriglyceridemia in Chinese Han population. Gene 2013; 515:272–276. [DOI] [PubMed] [Google Scholar]
- 14.Sparso T, Hussain MS, Andersen G, et al. Relationships between the functional PPARalpha Leu162Val polymorphism, obesity, type 2 diabetes, dyslipidaemia, related quantitative traits in studies of 5799 middle-aged white people. Mol Genet Metab 2007; 90:205–209. [DOI] [PubMed] [Google Scholar]
- 15.Dongiovanni P, Rametta R, Fracanzani AL, et al. Lack of association between peroxisome proliferator-activated receptors alpha and gamma2 polymorphisms and progressive liver damage in patients with non-alcoholic fatty liver disease: a case control study. BMC Gastroenterol 2010; 10:102. [DOI] [PMC free article] [PubMed] [Google Scholar]
- 16.Chen S, Li Y, Li S, et al. A Val227Ala substitution in the peroxisome proliferator activated receptor alpha (PPAR alpha) gene associated with non-alcoholic fatty liver disease and decreased waist circumference and waist-to-hip ratio. J Gastroenterol Hepatol 2008; 23:1415–1418. [DOI] [PubMed] [Google Scholar]
- 17.Zanger UM, Schwab M. Cytochrome P450 enzymes in drug metabolism: regulation of gene expression, enzyme activities, and impact of genetic variation. Pharmacol Ther 2013; 138:103–141. [DOI] [PubMed] [Google Scholar]
- 18.Li HY, Li B, Wei YG, et al. Higher tacrolimus blood concentration is related to hyperlipidemia in living donor liver transplantation recipients. Dig Dis Sci 2012; 57:204–209. [DOI] [PubMed] [Google Scholar]
- 19.Forouhi NG, Wareham NJ. Epidemiology of diabetes. Medicine (Abingdon) 2014; 42:698–702. [DOI] [PMC free article] [PubMed] [Google Scholar]
- 20.Gao Z, Li YH. Antioxidant stress and anti-inflammation of PPARalpha on warm hepatic ischemia-reperfusion injury. PPAR Res 2012; 2012:738785. [DOI] [PMC free article] [PubMed] [Google Scholar]
- 21.Nakagawa K, Tanaka N, Morita M, et al. PPARalpha is down-regulated following liver transplantation in mice. J Hepatol 2012; 56:586–594. [DOI] [PMC free article] [PubMed] [Google Scholar]