Abstract
Esophageal varix and its hemorrhage are serious complications of liver cirrhosis. Recent studies have focused on noninvasive prediction of esophageal varices. We attempted to evaluate the association of liver and spleen stiffness (LS and SS) as measured by acoustic radiation force impulse imaging, with the presence and severity of esophageal varices and variceal hemorrhage in cirrhotic patients.
We measured LS and SS, along with endoscopic examination of esophageal varices for a total of 125 cirrhotic patients at a single referral hospital in this prospective observational study. The diagnostic utility of noninvasive methods for identifying varices and their bleeding risk was compared, including LS, SS, spleen length, Child-Pugh score, and various serum fibrosis indices.
Esophageal varices were present in 77 patients (61.6%). SS was significantly higher in patients with varices than in those without varices (3.58 ± 0.47 vs 3.02 ± 0.49; P < 0.001). A tendency toward increasing SS levels was observed with increasing severity of varices (no varix, 3.02 ± 0.49; F1, 3.39 ± 0.51; F2, 3.60 ± 0.42; F3, 3.85 ± 0.37; P < 0.001). SS was significantly higher in patients who experienced variceal hemorrhage than in those who did not (3.80 ± 0.36 vs 3.20 ± 0.51; P = 0.002). An optimal cut-off value of SS for high-risk varices (≥F2) or variceal hemorrhage was 3.40 m/s.
SS was significantly correlated with the presence, severity, and bleeding risk of esophageal varices. Prompt endoscopic evaluation of variceal status and prophylactic measures based on the SS may be warranted for cirrhotic patients.
INTRODUCTION
Esophageal varix is one of the serious complications of liver cirrhosis resulting from portal hypertension.1 Given the high prevalence of varices and the significant mortality rate associated with variceal hemorrhage, early diagnosis of clinically significant portal hypertension (≥10 mm Hg) and varices is of paramount importance in the management of compensated cirrhosis and in the prevention of liver-related morbidity and mortality. Recent guidelines recommend a screening upper gastrointestinal endoscopy in all cirrhotic patients and call for primary prophylaxis against variceal hemorrhage if indicated.2 In addition, measurement of hepatic venous pressure gradient (HVPG) is a standard method to evaluate portal hypertension.1,3 However, both methods are invasive and measurement of HVPG with satisfactory quality is available only in specialized institutions. Therefore, noninvasive and accurate methods for predicting the presence and severity of varices are further needed.
Portal hypertension-related splenomegaly is frequently accompanied by patients with cirrhosis due to portal venous congestion and hyperplasia of splenic tissue, and its usefulness for diagnosis of portal hypertension has been studied.4 However, the direct relationship between the size of the spleen and the severity of portal hypertension is still under debate.5–7 Recent studies have focused on ultrasound-based measurement of liver or spleen stiffness (LS or SS); LS reflects the degree of hepatic fibrosis and resultant portal hypertension, and SS is reflective of portal hypertension-related changes in the spleen, including splenomegaly.8 Studies using transient elastography to measure LS have reported acceptable diagnostic performance in grading hepatic fibrosis and in detecting clinically significant portal hypertension.8,9 Measurement of SS using transient elastography has also accurately predicted both the presence of varices and the degree of portal hypertension.10,11
Because measurement of LS or SS using transient elastography harbors inherent limitations in obesity or presence of ascites,12 acoustic radiation force impulse (ARFI) imaging has been proposed as an alternative technique for assessing tissue elasticity.13 Transient elastography is a blind technique without B-mode imaging capability for localization, whereas ARFI elastography can directly visualize liver and spleen parenchyma. We aimed to evaluate the diagnostic utility of LS and SS measurement using ARFI elastography by investigating their associations with the presence and severity of varices and variceal hemorrhage in cirrhotic patients.
PATIENTS AND METHODS
Study Population
Between March 2011 and February 2012, a total of 132 patients with liver cirrhosis were screened for the present study, and underwent ARFI elastography for measurement of LS and SS, and upper gastrointestinal endoscopy for the presence and severity of esophageal varices. The diagnosis of liver cirrhosis was based on either histology or a combination of physical, laboratory, and radiological findings. Radiological evidences for the diagnosis of cirrhosis included nodular surface or coarse texture of the liver, atrophied right lobe and enlarged caudate or left lobe, increased diameter of the portal vein and presence of collateral veins.14–16 Patients with ongoing gastrointestinal hemorrhage were not considered as eligible, and other exclusion criteria were active alcohol abuse, portal vein thrombosis, intrahepatic malignancy, and previous or current treatment for portal hypertension (beta-blocker therapy, transjugular intrahepatic portosystemic shunt, and balloon-occluded retrograde transvenous obliteration). Of the 132 eligible subjects, SS was not measurable in 6 patients due to previous splenectomy or measurement failure, and laboratory data for calculating liver fibrosis indices were insufficient in 1 patient. Excluding these 7 patients, 125 patients were finally enrolled in the prospective cohort study, and their clinical and radiologic data were reviewed. Written informed consent was obtained from all enrolled patients. The current study was approved by our institutional review board.
Endoscopic Examination
All patients underwent upper gastrointestinal endoscopy to assess the presence and severity of esophageal varices. Varices were graded by 1 of 3 experienced endoscopists (YJJ, WK, and HYK, with 14, 13, and 10 years of experience, respectively) according to size as follows: small (F1)—small, straight varices; medium (F2)—enlarged, tortuous varices occupying less than one-third of the lumen; or large (F3)—large, coil-shaped varices occupying more than one-third of the lumen.2 Whenever grades of varices were not obvious, final grading was made with consensus among the 3 endoscopists. Previous variceal hemorrhage was diagnosed when gastrointestinal bleeding, including hematemesis, hematochezia, or melena, were confirmed as originating from varices by endoscopic examination according to the medical records.
LS and SS Measurement
For all patients, ultrasonographic examination was performed by 2 independent radiologists (JYL and HW with 16 and 10 years of experience as a sonographer, respectively) who was blinded to clinical data, using a Siemens Acuson S2000™ ultrasound system (Siemens Medical Solutions, Mountain View, CA). Prior to performing ARFI elastography, the gross morphology of the liver, gall bladder, and spleen was evaluated in the supine position using conventional B-mode imaging for each patient after an overnight fast. During real-time B-mode imaging, LS was measured in the right lobe using the 9th to 10th rib intercostal approach, with the right arm in maximum abduction. SS was measured using the intercostal approach in the left upper quadrant, with the left arm in maximum abduction. A 10 × 5-mm region of interest (ROI) box was placed on the liver and spleen parenchyma without large blood vessels or abnormal lesions at a depth from 3 to 5.5 cm below liver and spleen capsule.17–19 For each patient, 10 repetitive measurements were performed in the liver and spleen, respectively, during breath holding for a few seconds per each measurement. The mean value of the 10 measurements was calculated and represented as an LS or SS value. LS or SS was expressed as shear wave velocity (meters per second, m/s). Spleen length was measured as maximum bipolar diameter on ultrasound scanning. For assessing the reproducibility of ARFI elastography, a preliminary study was performed on 50 patients with cirrhosis (25 in Child-Pugh class A and 25 in Child-Pugh class B or C). Consequently, intraobserver agreement of 0.935 at 4-week intervals and interobserver agreement of 0.932 were achieved by calculating an intraclass correlation coefficient.
Noninvasive Fibrosis Indices
A 12-h overnight fasting blood sample was taken on the day of ARFI imaging to measure the serum levels of alanine aminotransferase (ALT), aspartate aminotransferase (AST), albumin, and total bilirubin, together with prothrombin time and platelet count. The platelet-to-spleen ratio (PSR) is significantly correlated with the degree of hepatic fibrosis and has been suggested as a surrogate marker for predicting the presence and severity of esophageal varices.20 The PSR is calculated as the platelet count (×109/L)/spleen length (mm). In addition, the AST-to-platelet ratio index (APRI) has been known as a useful marker for diagnosing esophageal varices and high-risk varices in compensated, cirrhotic patients.21 The APRI is calculated as follows: (AST level [IU/L]/[the upper limit of normal range]/platelet count [×109/L]) × 100.
Statistical Analysis
Categorical data were analyzed using the Chi-squared test, and continuous data were compared using the Student's t test. A 1-way analysis of variance (ANOVA) was performed to compare the mean difference between the 3 groups. Diagnostic performance of ARFI elastography to determine the severity of varices and to predict variceal hemorrhage was assessed using receiving operating characteristic (ROC) curves. ROC curves were constructed, and the area under the ROC curve (AUROC) was calculated using the trapezoidal rule. Comparisons between the AUROC were performed using the DeLong test. Optimal cut-off values were chosen to maximize the sum of sensitivity and specificity. Sensitivity, specificity, positive predictive value (PPV), and negative predictive value (NPV) were calculated using the cut-off values obtained from ROC curves. Confidence intervals (CI) of 95% were calculated for each predictive test and used to compare AUROC curves. Logistic regression analyses were performed to determine risk factors associated with the presence of varices, including sex, age, SS, LS, spleen length, platelet count, total bilirubin, prothrombin time, albumin, and AST. Logistic regression analyses were also conducted to assess potential risk factors for variceal hemorrhage, such as sex, age, SS, LS, spleen length, total bilirubin, and albumin. Multiple logistic regression analyses included age, sex, and other variables that were found to be significant in the univariate analysis (P < 0.05). For the multivariate analysis, the stepwise selection method was used to select variables to be maintained in the final model. All statistical analyses were performed using SPSS version 20 (SPSS Inc., Chicago, IL). P value < 0.05 were considered statistically significant.
RESULTS
Baseline Characteristics of the Study Population
The baseline clinical, biochemical, endoscopic, and radiological findings of the study population are summarized in Table 1. The primary etiologies of underlying chronic liver disease were viral (60.8%) and alcoholic (32.8%) in origin. The large majority of patients were Child-Pugh class A (67.2%) or B (25.6%). The mean LS and SS values were 2.51 ± 0.80 and 3.37 ± 0.55 m/s, respectively. Endoscopic examination revealed the presence of varices in 77 (61.6%) patients, with variceal grade F1, F2, and F3 found in 25 (20.0%), 37 (29.6%), and 15 (12.0%) patients, respectively.
TABLE 1.
Baseline Characteristics of Study Population With Liver Cirrhosis (n = 125)
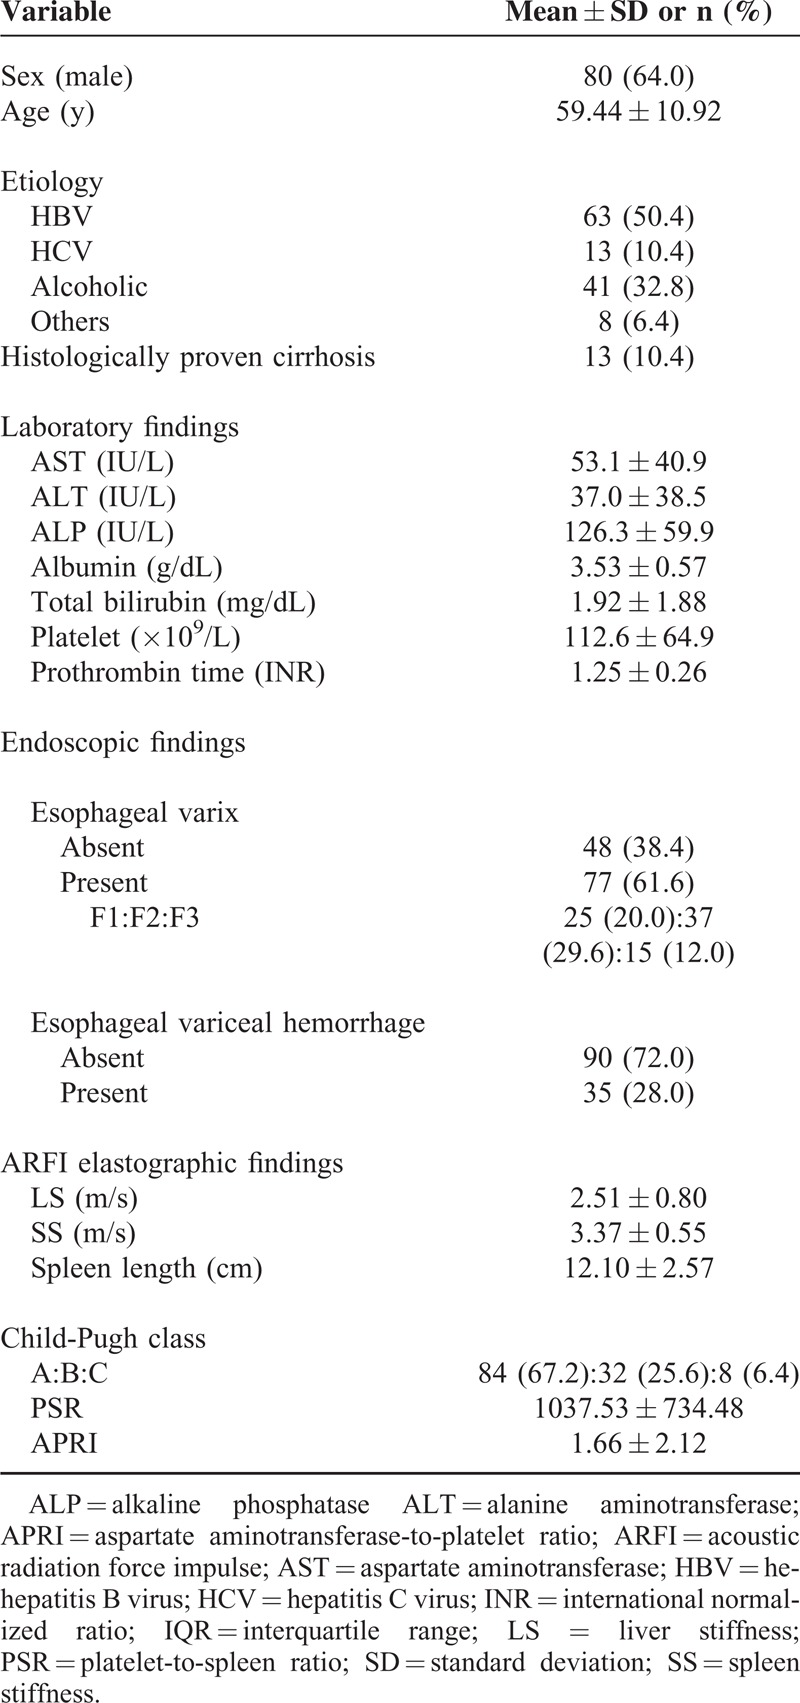
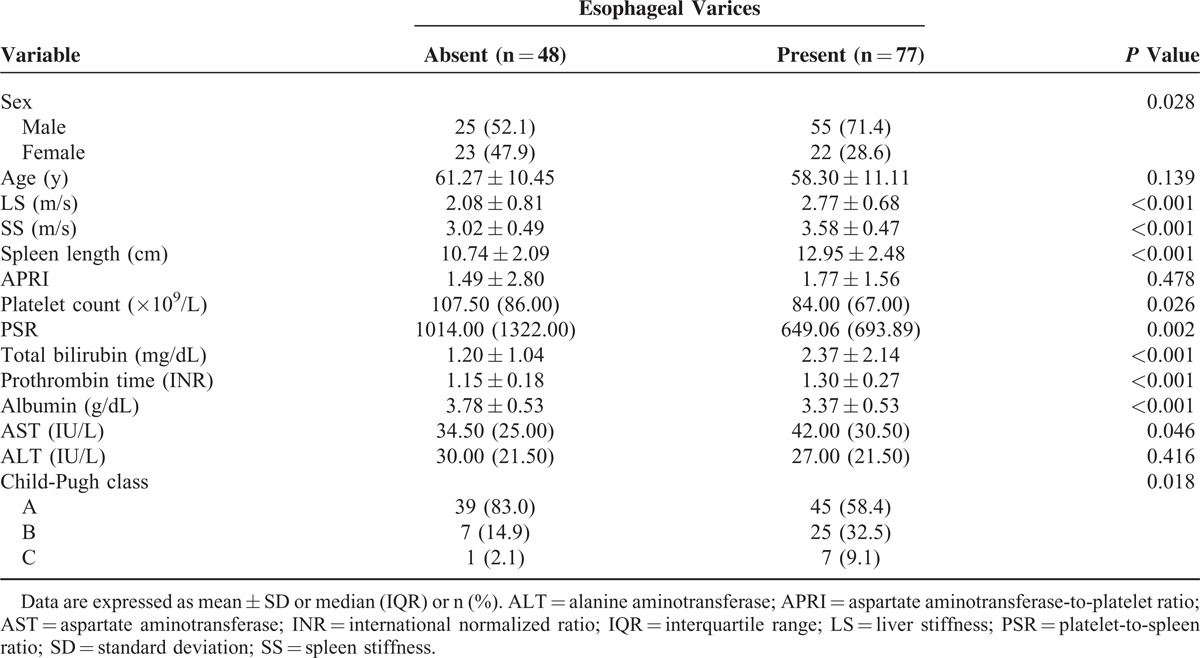
Table 2 provides a summary comparison of clinical characteristics between cirrhotic patients with varices and those without varices. Patients with varices had significantly lower platelet counts (P = 0.026), PSRs (P = 0.002), and albumin levels (P < 0.001). They also had higher Child-Pugh scores (P = 0.018), higher bilirubin levels (P < 0.001), and prolonged prothrombin times (P < 0.001). LS and SS values were significantly higher in patients with varices than in those without varices (P < 0.001). Spleen length was also greater in patients with varices than in those without varices (P < 0.001). No significant differences were observed in APRI.
TABLE 2.
Comparison of Clinical Characteristics Between Cirrhotic Patients With and Without Esophageal Varices
SS, LS, Spleen Length, and Child-Pugh Score According to the Severity of Esophageal Varices
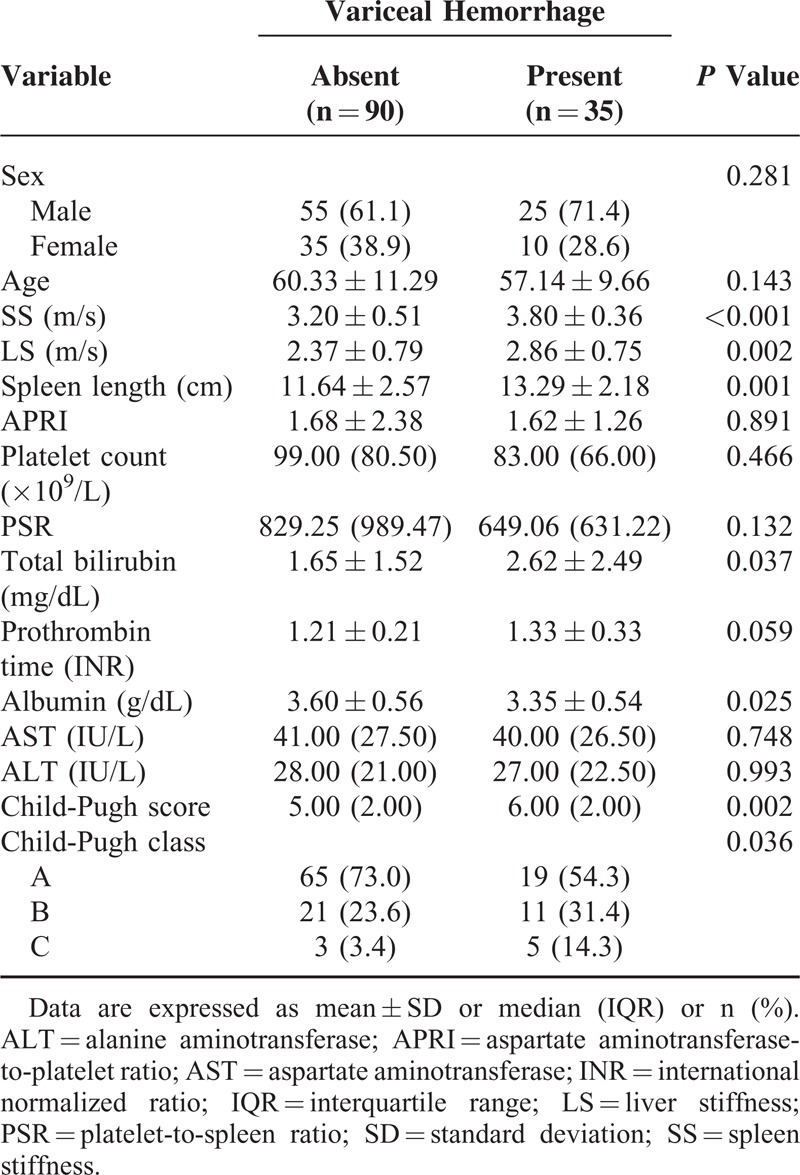
Significant differences in SS, LS, spleen length, and Child-Pugh score were observed among patients without varices and the patient groups with different grades of varices (P < 0.001, Table 3). Patients who experienced variceal hemorrhage had significantly higher serum bilirubin levels, higher Child-Pugh scores, and lower serum albumin levels than those without variceal hemorrhage (P < 0.05, Table 4). Patients with previous variceal hemorrhage also exhibited significantly higher SS levels (P < 0.001), higher LS levels (P = 0.002), and greater spleen lengths (P = 0.001) than those without hemorrhage (Table 4).
TABLE 3.
Comparison of Mean Values of Spleen Stiffness, Liver Stiffness, Spleen Length, and Child-Pugh Score According to the Degree of Esophageal Varices

TABLE 4.
Comparison of Clinical Characteristics Between Patients With and Without Esophageal Variceal Hemorrhage
Diagnostic Performance of SS, LS, Spleen Length, and Child-Pugh Score for Detecting Esophageal Varices and Variceal Hemorrhage
The AUROCs of SS, LS, spleen length, and Child-Pugh score for predicting the presence of varices (F1–3) were 0.785, 0.747, 0.757, and 0.729, respectively (Figure 1A). The AUROCs of SS, LS, spleen length, and Child-Pugh score for distinguishing medium to large varices (F2, F3) from small varices (F1) or the absence of varix were 0.762, 0.687, 0.755, and 0.683, respectively (Figure 1B). For detecting large varices (F3), the AUROCs of SS, LS, spleen length, and Child-Pugh score were 0.786, 0.616, 0.669, and 0.639, respectively (Figure 1C). SS showed a significantly higher AUROC (0.813; 95% CI, 0.738–0.889) for identifying previous variceal hemorrhage than LS and Child-Pugh score (Figure 2).
FIGURE 1.
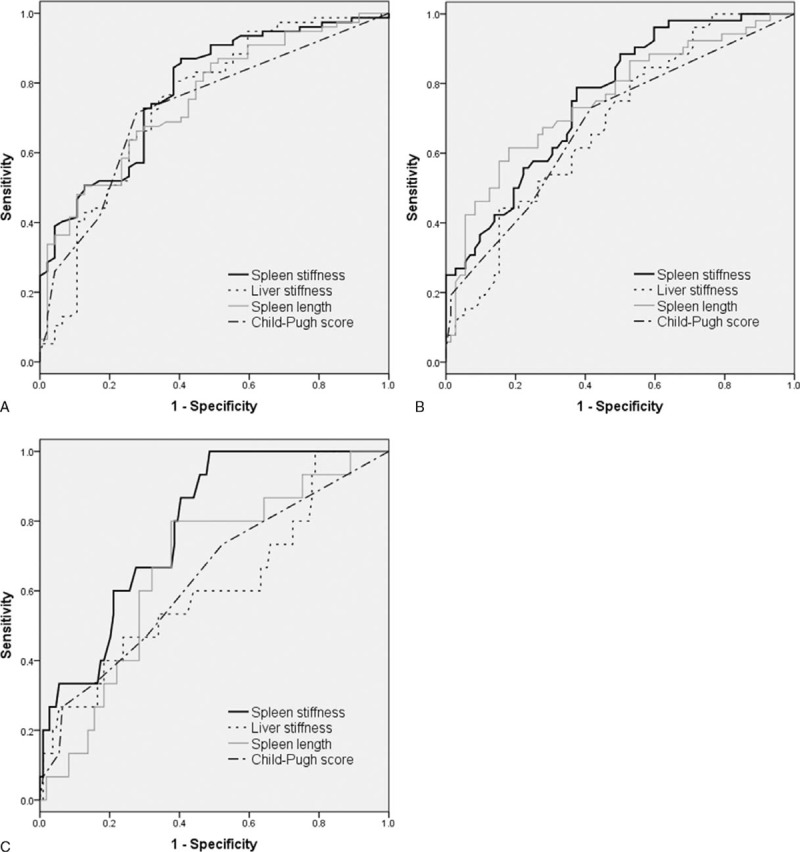
Comparative area under the receiver operating curve (AUROC) analyses of spleen stiffness (SS), liver stiffness (LS), spleen length, and Child-Pugh score in predicting the presence (A) and degree (B, C) of esophageal varices. (A) No varix vs F1–3. AUROC: SS, 0.785; LS, 0.747; spleen length, 0.757; Child-Pugh score, 0.729 (P values: SS vs LS, 0.382; SS vs spleen length, 0.577; SS vs Child-Pugh score, 0.336). (B) No varix, F1 vs F2, F3. AUROC: SS, 0.762; LS, 0.687; spleen length, 0.755; Child-Pugh score, 0.683 (P values: SS vs LS, 0.138; SS vs spleen length, 0.893; SS vs Child-Pugh score, 0.215). (C) No varix, F1, F2 vs F3. AUROC: SS, 0.786; LS, 0.616; spleen length, 0.669; Child-Pugh score, 0.639 (P values: SS vs LS, 0.103; SS vs spleen length, 0.079; SS vs Child-Pugh score, 0.128).
FIGURE 2.
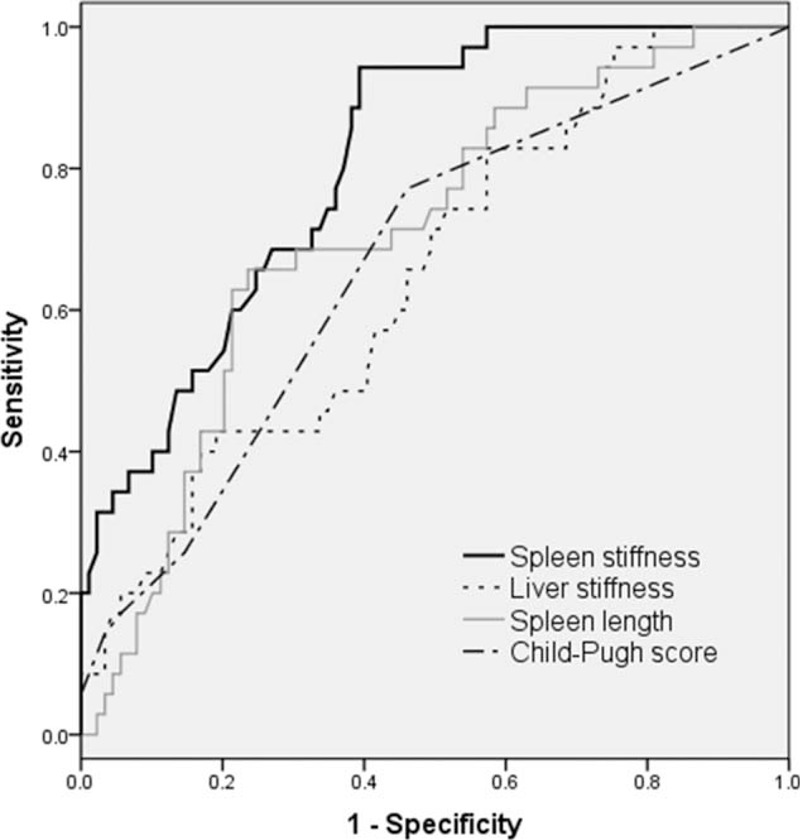
Comparative area under the receiver operating curve (AUROC) analyses of spleen stiffness, liver stiffness, spleen length, and Child-Pugh score in predicting esophageal variceal hemorrhage. AUROC: spleen stiffness (SS), 0.813; liver stiffness (LS), 0.654; spleen length, 0.710; Child-Pugh score, 0.665 (P values: SS vs LS, 0.006; SS vs spleen length, 0.066; SS vs Child-Pugh score, 0.023).
The optimal cut-off value of SS for detecting varices (F1–3) was 3.16 m/s; the sensitivity, specificity, PPV, and NPV were 87.0%, 60.4%, 77.9%, and 74.4%, respectively. The optimal cut-off value of SS for predicting the presence of medium to large varices (≥F2) was 3.40 m/s; the sensitivity, specificity, PPV, and NPV were 78.9%, 63.0%, 60.3%, and 80.7%, respectively. The optimal cut-off value of SS for previous variceal hemorrhage was also 3.40 m/s; the sensitivity, specificity, PPV, and NPV were 94.3%, 61.1%, 48.5%, and 96.5%, respectively (Table 5).
TABLE 5.
Optimal Cut-Off Values of Spleen Stiffness According to the Degree and Hemorrhage of Esophageal Varices

Predictors of the Presence of Esophageal Varices and Esophageal Variceal Hemorrhage
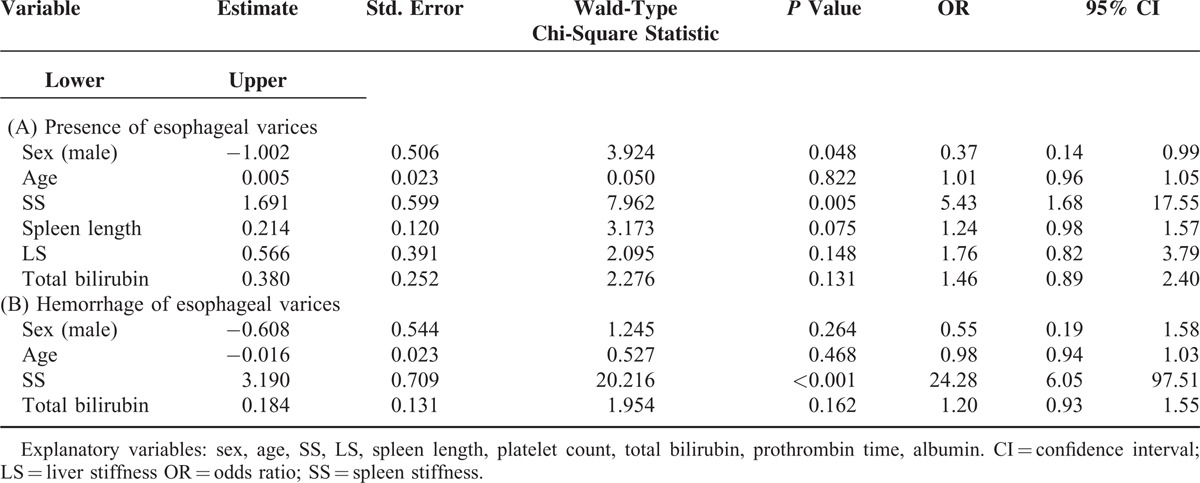
Table 6 shows that the results of multiple logistic regression analyses conducted to assess the association between the presence or hemorrhage of varices and the other explanatory variables. Male sex was negatively associated with the presence of varices (odds ratio [OR], 0.37; 95% CI, 0.14–0.99; P = 0.048), and SS was significantly associated with the presence of varices (OR, 5.43; 95% CI, 1.68–17.55; P = 0.005) (Table 6A). However, SS (OR, 24.28; 95% CI, 6.05–97.51; P < 0.001) was the only independent risk factor associated with variceal hemorrhage based on the multiple logistic regression analysis (Table 6B).
TABLE 6.
Multiple Logistic Regression Analysis of Factors Associated With the Presence (A) and Hemorrhage (B) of Esophageal Varices
DISCUSSION
The present study aimed to assess diagnostic performance of LS and SS measurement using ARFI elastography for the presence and bleeding risk of esophageal varices by evaluating their associations with endoscopic features of and previous hemorrhage from esophageal varices in cirrhotic patients. From multiple logistic regression and AUROC analyses, SS was found to be superior to LS, spleen length, and Child-Pugh score in predicting variceal hemorrhage.
Current standard practices for evaluating portal hypertension and detecting esophageal varices are HVPG measurement and upper gastrointestinal endoscopy, respectively.2,3 However, efforts to find noninvasive measures for diagnosing portal hypertension and varices have been made in an attempt to decrease the requirement for invasive procedures such as HVPG measurement or endoscopy. Although strong correlations have been observed between LS and HVPG in some studies,22–24 LS measurement was suboptimal for predicting cases of HVPG >12 mm Hg and performed even more poorly in predicting varices.22,25,26 Thus, LS is not considered as effective as HVPG with respect to overall diagnostic accuracy.8 In contrast, recent studies have demonstrated that SS measurement may be useful in predicting the presence and/or severity of varices in patient populations with various etiologies of portal hypertension including viral hepatitis-related cirrhosis10,27,28 and extrahepatic portal vein obstruction with presinusoidal portal hypertension.29
Recently, SS measured by ARFI elastography showed a significant correlation with severity of esophageal varices.27 We also conducted the present study using ARFI imaging instead of transient elastography because use of transient elastography can be limited in obese subjects or cirrhotic patients with ascites.12 SS measurement using ARFI elastography in hepatitis C-predominant patients was effective in detecting varices (optimal SS cut-off of 3.18 m/s with a 98.4% NPV, 98.5% sensitivity, and 75% accuracy) and in predicting the presence of high-risk varices (optimal SS cut-off of 3.30 m/s with a 99.4% NPV, 98.9% sensitivity, and 72.1% accuracy).27 These findings were consistent with our results in which hepatitis B was the main underlying cause of cirrhosis in more than half of the patients. In the present study, the AUROC for predicting the presence of varices was 0.785, with an optimal SS cut-off value of 3.16 m/s and an AUROC for predicting large, high-risk varices (≥F2) of 0.762, with 3.40 m/s as the SS cut-off value. Although a recent meta-analysis suggested that SS measurement might be suboptimal for the diagnosis of esophageal varices based on a pooled analysis of 12 studies with significant heterogeneity, subgroup analysis showed that the diagnostic performance of SS was better in studies from Asia than in those from Western countries possibly due to differences in body size and habitus.30 The present study added a positive result for the usefulness of SS measurement to detect esophageal varices in hepatitis B virus-predominant Asian population.
Previous studies have excluded patients with prior or ongoing variceal hemorrhage from study populations, most likely because those studies focused on investigating whether SS measurement could reduce the need for endoscopic examination by easily detecting esophageal varices associated with a high risk of bleeding.10,11,27 The present study also investigated the diagnostic utility of LS and SS for discriminating variceal bleeders from nonbleeders. According to the multiple logistic regression analysis, only SS was found to be indicative of variceal bleeders among all the investigated variables, including LS and spleen length (Table 6). The AUROC of SS for identifying variceal bleeders was 0.813, with a cut-off value of 3.40 m/s, which is almost equal to the optimal cut-off value for prediction of high-risk varices. In other words, SS levels above 3.40 m/s suggests an increased risk of variceal hemorrhage and should prompt physicians to check for varices and to determine whether to initiate pharmacological therapy or endoscopic intervention.
These findings support the hypothesis that endoscopic evaluation to determine pharmacological or endoscopic intervention is urgently required when the SS value reaches the threshold cut-off level in patients with compensated cirrhosis. This strategy is of particular practicality in terms of patient convenience, because regular surveillance ultrasonography for hepatocellular carcinoma (eg, every 6 months) is recommended for patients with cirrhosis and ARFI elastography can be performed simultaneously with routine B-mode imaging.
The main limitations of the current study include lack of comparison with transient elastography or external validation of the results and unavailability of HVPG measurement.
In conclusion, with certain caveats, SS measurement using ARFI elastography showed acceptable diagnostic performance in predicting the presence, severity, and bleeding risk of esophageal varices. Prompt endoscopic evaluation of varices is justifiable at SS levels of or above the cut-off values established in this study for high-risk varices and variceal hemorrhage. Taken together, these findings suggest that SS measurement using ARFI elastography may assist in the early detection of high-risk varices and in the alleviation of healthcare costs associated with variceal hemorrhage. Further validation in a large-scale, prospective, long-term study is warranted to establish whether there is a strong correlation between tissue strain analytics and hemodynamics of portal flow.
Footnotes
Abbreviations: ALT = alanine aminotransferase, ANOVA = analysis of variance, APRI = AST-to-platelet ratio index, ARFI = acoustic radiation force impulse, AST = aspartate aminotransferase, AUROC = area under the ROC curve, CI = confidence intervals, HVPG = hepatic venous pressure gradient, INR = international normalized ratio, LS = liver stiffness, NPV = negative predictive value, OR = odds ratio, PPV = positive predictive value, PSR = platelet-to-spleen ratio, ROC = receiving operating characteristic, ROI = region of interest, SS = spleen stiffness
HYK and EHJ have contributed equally to this work.
This work was supported by a clinical research grant-in-aid from the Seoul Metropolitan Government Seoul National University (SMG-SNU) Boramae Medical Center (03-2013-1) and the SK Telecom Research Fund (16-2013-66).
The authors have no conflicts of interest to disclose.
REFERENCES
- 1.Garcia-Tsao G, Bosch J. Management of varices and variceal hemorrhage in cirrhosis. New Engl J Med 2010; 362:823–832. [DOI] [PubMed] [Google Scholar]
- 2.de Franchis R. Baveno V Faculty. Revising consensus in portal hypertension: report of the Baveno V consensus workshop on methodology of diagnosis and therapy in portal hypertension. J Hepatol 2010; 53:762–768. [DOI] [PubMed] [Google Scholar]
- 3.Bosch J, Abraldes JG, Berzigotti A, et al. The clinical use of HVPG measurements in chronic liver disease. Nat Rev Gastroenterol Hepatol 2009; 6:573–582. [DOI] [PubMed] [Google Scholar]
- 4.Bolognesi M, Merkel C, Sacerdoti D, et al. Role of spleen enlargement in cirrhosis with portal hypertension. Dig Liver Dis 2002; 34:144–150. [DOI] [PubMed] [Google Scholar]
- 5.Shah SH, Hayes PC, Allan PL, et al. Measurement of spleen size and its relation to hypersplenism and portal hemodynamics in portal hypertension due to hepatic cirrhosis. Am J Gastroenterol 1996; 91:2580–2583. [PubMed] [Google Scholar]
- 6.Liangpunsakul S, Ulmer BJ, Chalasani N. Predictors and implications of severe hypersplenism in patients with cirrhosis. Am J Med Sci 2003; 326:111–116. [DOI] [PubMed] [Google Scholar]
- 7.Chalasani N, Imperiale TF, Ismail A, et al. Predictors of large esophageal varices in patients with cirrhosis. Am J Gastroenterol 1999; 94:3285–3291. [DOI] [PubMed] [Google Scholar]
- 8.Castera L, Pinzani M, Bosch J. Non invasive evaluation of portal hypertension using transient elastography. J Hepatol 2012; 56:696–703. [DOI] [PubMed] [Google Scholar]
- 9.Thabut D, Moreau R, Lebrec D. Noninvasive assessment of portal hypertension in patients with cirrhosis. Hepatology 2011; 53:683–694. [DOI] [PubMed] [Google Scholar]
- 10.Colecchia A, Montrone L, Scaioli E, et al. Measurement of spleen stiffness to evaluate portal hypertension and the presence of esophageal varices in patients with HCV-related cirrhosis. Gastroenterology 2012; 143:646–654. [DOI] [PubMed] [Google Scholar]
- 11.Berzigotti A, Seijo S, Arena U, et al. Elastography, spleen size, and platelet count identify portal hypertension in patients with compensated cirrhosis. Gastroenterology 2013; 144:102–111e1. [DOI] [PubMed] [Google Scholar]
- 12.Castera L, Foucher J, Bernard PH, et al. Pitfalls of liver stiffness measurement: a 5-year prospective study of 13,369 examinations. Hepatology 2010; 51:828–835. [DOI] [PubMed] [Google Scholar]
- 13.Rizzo L, Calvaruso V, Cacopardo B, et al. Comparison of transient elastography and acoustic radiation force impulse for non-invasive staging of liver fibrosis in patients with chronic hepatitis C. Am J Gastroenterol 2011; 106:2112–2120. [DOI] [PubMed] [Google Scholar]
- 14.Di Lelio A, Cestari C, Lomazzi A, et al. Cirrhosis: diagnosis with sonographic study of the liver surface. Radiology 1989; 172:389–392. [DOI] [PubMed] [Google Scholar]
- 15.Giorgio A, Amoroso P, Lettieri G, et al. Cirrhosis: value of caudate to right lobe ratio in diagnosis with US. Radiology 1986; 161:443–445. [DOI] [PubMed] [Google Scholar]
- 16.Zwiebel WJ. Sonographic diagnosis of diffuse liver disease. Semin Ultrasound CT MR 1995; 16:8–15. [DOI] [PubMed] [Google Scholar]
- 17.Goertz RS, Zopf Y, Jugl V, et al. Measurement of liver elasticity with acoustic radiation force impulse (ARFI) technology: an alternative noninvasive method for staging liver fibrosis in viral hepatitis. Ultraschall Med 2010; 31:151–155. [DOI] [PubMed] [Google Scholar]
- 18.Jaffer OS, Lung PF, Bosanac D, et al. Acoustic radiation force impulse quantification: repeatability of measurements in selected liver segments and influence of age, body mass index and liver capsule-to-box distance. Br J Radiol 2012; 85:e858–e863. [DOI] [PMC free article] [PubMed] [Google Scholar]
- 19.Potthoff A, Attia D, Pischke S, et al. Influence of different frequencies and insertion depths on the diagnostic accuracy of liver elastography by acoustic radiation force impulse imaging (ARFI). Eur J Radiol 2013; 82:1207–1212. [DOI] [PubMed] [Google Scholar]
- 20.Giannini E, Botta F, Borro P, et al. Platelet count/spleen diameter ratio: proposal and validation of a non-invasive parameter to predict the presence of oesophageal varices in patients with liver cirrhosis. Gut 2003; 52:1200–1205. [DOI] [PMC free article] [PubMed] [Google Scholar]
- 21.Wai CT, Greenson JK, Fontana RJ, et al. A simple noninvasive index can predict both significant fibrosis and cirrhosis in patients with chronic hepatitis C. Hepatology 2003; 38:518–526. [DOI] [PubMed] [Google Scholar]
- 22.Carrion JA, Navasa M, Bosch J, et al. Transient elastography for diagnosis of advanced fibrosis and portal hypertension in patients with hepatitis C recurrence after liver transplantation. Liver Transpl 2006; 12:1791–1798. [DOI] [PubMed] [Google Scholar]
- 23.Vizzutti F, Arena U, Romanelli RG, et al. Liver stiffness measurement predicts severe portal hypertension in patients with HCV-related cirrhosis. Hepatology 2007; 45:1290–1297. [DOI] [PubMed] [Google Scholar]
- 24.Lemoine M, Katsahian S, Ziol M, et al. Liver stiffness measurement as a predictive tool of clinically significant portal hypertension in patients with compensated hepatitis C virus or alcohol-related cirrhosis. Aliment Pharmacol Ther 2008; 28:1102–1110. [DOI] [PubMed] [Google Scholar]
- 25.Kazemi F, Kettaneh A, N’Kontchou G, et al. Liver stiffness measurement selects patients with cirrhosis at risk of bearing large oesophageal varices. J Hepatol 2006; 45:230–235. [DOI] [PubMed] [Google Scholar]
- 26.Castera L, Le Bail B, Roudot-Thoraval F, et al. Early detection in routine clinical practice of cirrhosis and oesophageal varices in chronic hepatitis C: comparison of transient elastography (FibroScan) with standard laboratory tests and non-invasive scores. J Hepatol 2009; 50:59–68. [DOI] [PubMed] [Google Scholar]
- 27.Takuma Y, Nouso K, Morimoto Y, et al. Measurement of spleen stiffness by acoustic radiation force impulse imaging identifies cirrhotic patients with esophageal varices. Gastroenterology 2013; 144:92–101.e2. [DOI] [PubMed] [Google Scholar]
- 28.Hirooka M, Ochi H, Koizumi Y, et al. Splenic elasticity measured with real-time tissue elastography is a marker of portal hypertension. Radiology 2011; 261:960–968. [DOI] [PubMed] [Google Scholar]
- 29.Sharma P, Mishra SR, Kumar M, et al. Liver and spleen stiffness in patients with extrahepatic portal vein obstruction. Radiology 2012; 263:893–899. [DOI] [PubMed] [Google Scholar]
- 30.Singh S, Eaton JE, Murad MH, et al. Accuracy of spleen stiffness measurement in detection of esophageal varices in patients with chronic liver disease: systematic review and meta-analysis. Clin Gastroenterol Hepatol 2014; 12:935–945e4. [DOI] [PubMed] [Google Scholar]


