

Abstract
The aim of the study was to prospectively evaluate the clinical value of intravoxel incoherent motion (IVIM)-magnetic resonance imaging (MRI) in early predicting the treatment response to neoadjuvant chemotherapy (NAC) for nasopharyngeal carcinoma (NPC).
Forty-eight patients with locoregionally advanced NPC were imaged with IVIM-MRI (14 b-factors, 0 – 1000 s/mm2) on a 3.0-T Magnetic resonance system, at the baseline, and repeatedly at the third and 21st day after NAC started. The IVIM-derived parameters (D, pure diffusion coefficient; f, perfusion fraction; and D∗, pseudodiffusion coefficient) were calculated with the Interactive Data Language version 6.3 software. The baseline parameters and their corresponding changes (Δparameter(day)) during NAC were compared using the Student t test or Mann-Whitney U test. Variation analyses of IVIM-derived parameters were tested with intraclass correlation coefficient. Receiver-operating characteristic (ROC) curve analysis was conducted to estimate the best diagnostic accuracy. Statistical analyses were performed on the SPSS 18.0 software, with a 2-tailed probability value, P < 0.05 was considered significant.
Among recruited patients, 37 cases were categorized as responders and 11 cases as nonresponders after NAC completed. The intra- and interobserver intraclass correlation coefficient of IVIM-derived parameters were excellent, which ranged from 0.858 to 0.971. Compared with the baseline value, at the third and 21st day, the D value was significantly higher and the D∗ value significantly lower (P < 0.05, P < 0.001, respectively). In contrast, f parameter only changed slightly (P > 0.05). Compared with nonresponders, responders presented a notably lower baseline D value and higher ΔD3, ΔD21, ΔD3∗, ΔD21∗, and Δf21 (P < 0.05), but no significant change in Δf3 was observed (P > 0.1). The receiver-operating characteristic curve analyses indicated that the threshold of baseline D values that best predicted the responders for primary nasopharynx tumors and metastatic lymph nodes were 0.911 × 10⁻³ mm2/s versus 0.951 × 10⁻³ mm2/s, and their corresponding area under curve, sensitivity, and specificity were 0.714 versus 0.774, 0.658 versus 0.538, and 0.818 versus 0.944, respectively.
IVIM-MRI can potentially early predict the treatment response of NAC for NPC patients. The baseline D value, and early changes in D and D∗ value are better predictors of the chemotherapeutic responsiveness.
INTRODUCTION
Nasopharyngeal carcinoma (NPC) is endemic in Southeast Asia and the southern part of China, especially in Guangdong and Fujian provinces, where the incidence is 15 to 50/105 persons/year.1,2 NPC is a radiosensitive head and neck tumor, with the intensity-modulated radiation therapy (IMRT) has gained ground as its standard radiotherapy regimen.3 The 5-year overall survival (OS) rate of NPCs treated with IMRT has achieved between 58.6% and 83.3%,4 and their local control rate was excellent even for those with locoregionally advanced disease (ie, T3–4 classifications).5,6 Estimates of the 5-year OS rate of early stage diseases (stages I and II) ranged from 72% to 100%, whereas those of advanced diseases (stages III and IV) were much lower, estimated at 38% to 62.7%.7–9
NPC is also considered highly sensitive to various chemotherapeutic drugs,10 so the inefficacy of IMRT in treating locoregionally advanced disease heightens interests in chemotherapy. Moreover, chemotherapy in combination with radiotherapy (or chemoradiotherapy [CRT]) is currently regarded as the optimal treatment modality for NPC. A randomized intergroup study on advanced NPC demonstrated a better 5-year OS rate with CRT than with radiation alone (67% vs 37%).11 However, methods for standardizing chemotherapy regimen, especially neoadjuvant chemotherapy (NAC), and assessing their treatment response remain controversial. Resistance to chemoradiation is widely recognized as the main cause of relapse for locoregionally advanced NPC; so, it is the key to early evaluation of the treatment response of NAC to optimize the treatment regimen individually.
Magnetic resonance imaging (MRI) can not only evaluate the anatomical information, but also assess whether NPC tumors are sensitive to chemoradiation. MRI has the multiplanar capability and no any bone beam-hardening artifacts, so tissues can be imaged with high contrast and resolution.12 Many recent studies have analyzed the utility of functional MRI (ie, dynamic contrast-enhanced-MRI and diffusion-weighted imaging [DWI]).13,14 However, the accuracy of dynamic contrast-enhanced-MRI commonly depends on the design of scan series array and is susceptible to patient's blood pressure and heart rate.13 Alternatively, DWI, with its associated semiquantitative parameter, apparent diffusion coefficient, might be able to characterize the thermal motion of water molecules, at the intracellular and extracellular levels.15,16 Nevertheless, the apparent diffusion coefficient value is calculated with a monoexponential model. Because microvascular blood flow also contributes to the diffusion signal and so, with a monoexponential decay model, it becomes difficult to detect these characteristics at higher b-factors (>200 s/mm2). To separate the so-called perfusion-related effect and calculate the diffusion in microcirculation, a biexponential model DWI was developed, termed intravoxel incoherent motion-magnetic resonance imaging (IVIM-MRI).17 In addition to incorporating the biexponential decay, IVIM-derived parameters may characterize the actual status of diffusion in tumors more accurately than conventional DWI because it also provides the perfusion-related measurement.
IVIM-MRI has been used to explore the pure diffusion and the perfusion-related diffusion in various tumor types,18–24 including head and neck tumors,20–24 and showed promise in differentiating malignant tumors from benign. IVIM-MRI has to date, however, not been used as a predictive tool to assess NPC's treatment response to chemotherapy. In this prospective study, thus, we make a preliminary assessment of whether any IVIM-derived parameters correlate with NPC's treatment response to neoadjuvant chemotherapy. Features of pure diffusion and perfusion-related diffusion were characterized in patients with locoregionally advanced NPC during the course of treatment.
MATERIALS AND METHODS
Ethical Statement
The protocol of this prospective study was approved by the ethics committee of Fujian Provincial Cancer Hospital & Institute (No. 200908). All enrolled subjects have signed the necessary informed consent forms.
Patient Selection
Fifty-six NPC patients who resorted to our institute were consecutively enrolled in this study. Patients who were eligible for this study met the following criteria: having been histopathologically confirmed with NPC, within 1 week before the MRI scan; clinically staged as the advanced diseases (stage III or IV), according to the 7th edition of American Joint Committee on Cancer Classification12; no pregnancy; without any MRI contraindications (including metal prosthesis, cardiac pacemaker, metal internal stent, etc); no allergies to gadolinium contrast agent; have completely received 2 cycles of NAC before radiotherapy or concurrent CRT (CCRT); and scheduled for complete the follow-up IVIM-MRI scans.
Imaging Protocols
Conventional MRI
Head and neck MRI session was conducted on a 3.0-T Magnetic resonance (MR) system (Achieva 3.0T, Philips Healthcare, Best, the Netherlands) with a 16-channel neurovascular coil. Before any antitumor treatments, all enrolled subjects received the following conventional MRI sequences: axial T1-weighted imaging-turbo spin-echo (Ax T1WI-TSE): repetition time/echo time (TR/TE) = 550/8.1 ms, TSE factor = 8, field of view (FOV) = 230 × 230 mm2, reconstruction matrix = 960 × 960, slice number = 36, slice thickness = 5 mm, slice gap = 1 mm, number of signal average (NSA) = 3, flip angle = 90 degree; axial T2-weighted imaging with short TI inversion recovery (Ax T2WI-STIR): TR/TE = 6888/70 ms, FOV = 230 × 230 mm, reconstruction matrix = 960 × 960, slice number = 36, slice thickness = 5 mm, slice gap = 1 mm, TSE factor = 17, NSA = 2; coronal T2-weighted imaging with STIR (Cor T2WI-STIR): TR/TE = 2,327/63 ms, FOV = 230 × 230 mm, reconstruction matrix = 672 × 672, slice number = 18, slice thickness = 5 mm, slice gap = 1 mm, TSE factor = 18, NSA = 2; sagittal T1-weighted imaging-turbo spin-echo (Sag T1WI-TSE): TR/TE = 600/8.1 ms, FOV = 230 × 230 mm, reconstruction matrix = 768 × 768, slice number = 18, slice thickness = 5 mm, slice gap = 1 mm, TSE factor = 6, NSA = 2; and postcontrast-enhanced acquisition of axial T1WI-TSE with spectral presaturation inversion recovery (SPIR): TR/TE = 1215/8.1 ms, flip angle = 90 degree, FOV = 230 × 230 mm, reconstruction matrix = 960 × 960, slice number = 36, slice thickness = 5 mm, slice gap = 1 mm, TSE factor = 5, NSA = 2. For the postcontrast acquisition, a gadolinium-based agent (Gadopentetate dimeglumine, Magnevist; Bayer Healthcare, Berlin, Germany) was intravenously injected at a dose of 0.1 mmoL/kg of body weight and a rate of 1.5 mL/s, followed by a 20-mL saline flush. The total scan time of conventional MRI was approximately 12 minutes.
IVIM-MRI
IVIM-MRI was repeatedly conducted at the baseline, and the third (day 3) and 21st day (day 21) after chemotherapy initiation. A single-shot spin-echo echo-planar imaging (SE-EPI) sequence was used with 14 b-factors (0, 10, 20, 30, 40, 50, 100, 150, 200, 350, 500, 650, 800, and 1000 s/mm2). The corresponding parameters were as follows: TR/TE 4495/69 ms; inversion recovery (IR) delay 240 seconds; EPI factor 63; matrix 256 × 256; FOV 230 × 230 mm2; slice thickness 5 mm; intersection gap 1 mm; NSA 2; shot mode, single-shot; the diffusion gradient timing 33.7/7.3. Image acquisition was performed in the axial plane, and 24 slices were obtained, covering the nasopharynx from the suprasellar region to the hypopharynx. The scan time was 6 minutes. To observe the morphological information in follow-up images, each IVIM-MRI sequence was followed by a conventional axial T2WI-STIR scan.
Image Analysis
All acquired images of IVIM-MRI were exported in a partition-and-recur format. Images were then analyzed with an in-house software termed Interactive Data Language (IDL) (version 6.3; ITT Visual Information Solutions, Boulder, CO) and fitted, on a pixel-by-pixel basis, using the Levenberg-Marquardt algorithm.25 Based on a biexponential algorithm model of IVIM theory,17,26 the relationship between signal intensity (S) and b-factor was calculated by applying Eq. (1):
Sb/S0 = (1 − f) × exp(−bD) + f × exp(−b(D + D *)) (1)
in which f is the fraction of perfusion-related diffusion, D is the pure diffusion coefficient, and D∗ is the pseudodiffusion coefficient (or perfusion-related diffusion coefficient), respectively. In addition, S0 and Sb are the signal intensities at b = 0 and b > 0 s/mm2, respectively. The IVIM-derived parameters (D, f, D∗) were calculated consecutively, where D was obtained by a simplified linear fit equation (Eq. 2) using b-factor >200 s/mm2:
Sb1 /Sb2 = exp[(b2 - b1)D] (2)
where Sb1 and Sb2 are signal intensities at 2 different b-factors. Eq. (2) is based on the assumption that D∗ is much greater than D. When the b-factor is larger than 200 s/mm2, the effects of D∗ on the signal can be neglected.17,26 When given an estimated D from Eq. (2), the corresponding f and D∗ can be calculated automatically from Eq. (1), based on a nonlinear regression algorithm model (Figure 1).
FIGURE 1.
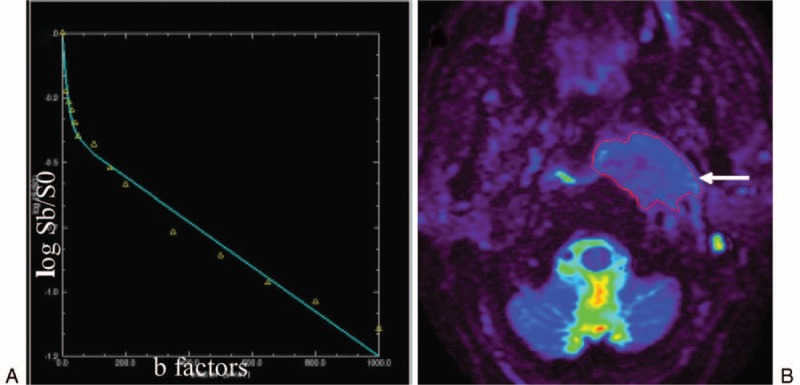
The biexponential model of IVIM theory was displayed on a 53-year-old man with newly diagnosed NPC. (A) Curve-fitting demonstrates the relationship between signal intensity and b-factors, which closely follows the biexponential model of IVIM theory. The X-axis of the curve represents different b-factors whereas the Y-axis represents log Sb/S0. At lower b-factors (≤200 s/mm2), curvature comes from blood flow in randomly oriented vessels (IVIM effect). At high b-factors (>200 s/mm2), whereas, the deviation from a straight line comes from non-Gaussian (hindered and not free) diffusion. (B) The S0 map, showing various signal intensities in different tissues with different degrees of color. Note that the nasopharynx tumor emanates an intense signal (long arrow). IVIM = intravoxel incoherent motion, NPC = Nasopharyngeal carcinoma, S0 and Sb = Signal intensities at b = 0 and b > 0 s/mm2.
After delineating where cancerous tissue was located, 2 radiologists specializing in head and neck MRI (with 5 and 8 years of experience, respectively) independently measured the IVIM-derived parameters, twice, with a double-blind control, to minimize the interobserver variability. Together, they used the morphological images (T2WI-STIR) and diffusion metric images (S0, D, D∗, and f) to reach a consensus on which image “slice” showed the primary tumor or affected lymph node at its widest cross-section. The region of interest was contoured manually around the primary nasopharynx tumors (pNT) and metastatic lymph nodes (mLN) on the axial T2WI-STIR images, and then subsequently coregistered to IVIM-MRI images for analysis. Air (low signal on both T1WI and T2WI) was carefully avoided, as were necrotic masses (low signal on T1WI image and high signal on T2WI image) and adjacent anatomical structures (ie, fat, bone structures, muscle, etc). Meanwhile, the axial maximum diameters (MD) of target lesions were calculated as well.
In addition, any corresponding changes of IVIM-derived parameters (Δparameter (dayX) with X = 3 or 21) were calculated simultaneously. Finally, at the end of NAC, patients were evaluated and classified as responders or nonresponders according to the Response Evaluation Criteria in Solid Tumors criteria, based on their MRI measurement.27 Patients were considered as responders when all assessable tumors completely disappeared or partially reduced (≥30% of in the sum of maximal diameters) on the follow-up MRI. On the contrary, patients were considered nonresponders if measurable tumors were relatively stable (<30% reduction or <20% increase in the sum of maximal diameters) or progressed (≥20% increase of original tumor or appearance of new lesions).
Statistical Analysis
Normality test for each IVIM-derived parameter was done using the Kolmogorov-Smirnov test, and the intra- and interobserver variation analyses were conducted with the intraclass correlation coefficient (ICC). The Student t test or Mann-Whitney U test was used to compare the IVIM-derived parameters, and the receiver-operating characteristic (ROC) curve analysis was used to estimate their predictive capability of treatment response to NAC. Diagnostic accuracy was determined using the values of area under curve (AUC), and the predicting cutoff value, sensitivity, and specificity were calculated as well. All statistical analyses were performed using SPSS 18.0 software (Chicago, IL), with a 2-tailed probability value, P < 0.05 was considered statistically significant.
RESULTS
Clinical Characteristic of Enrolled Patients
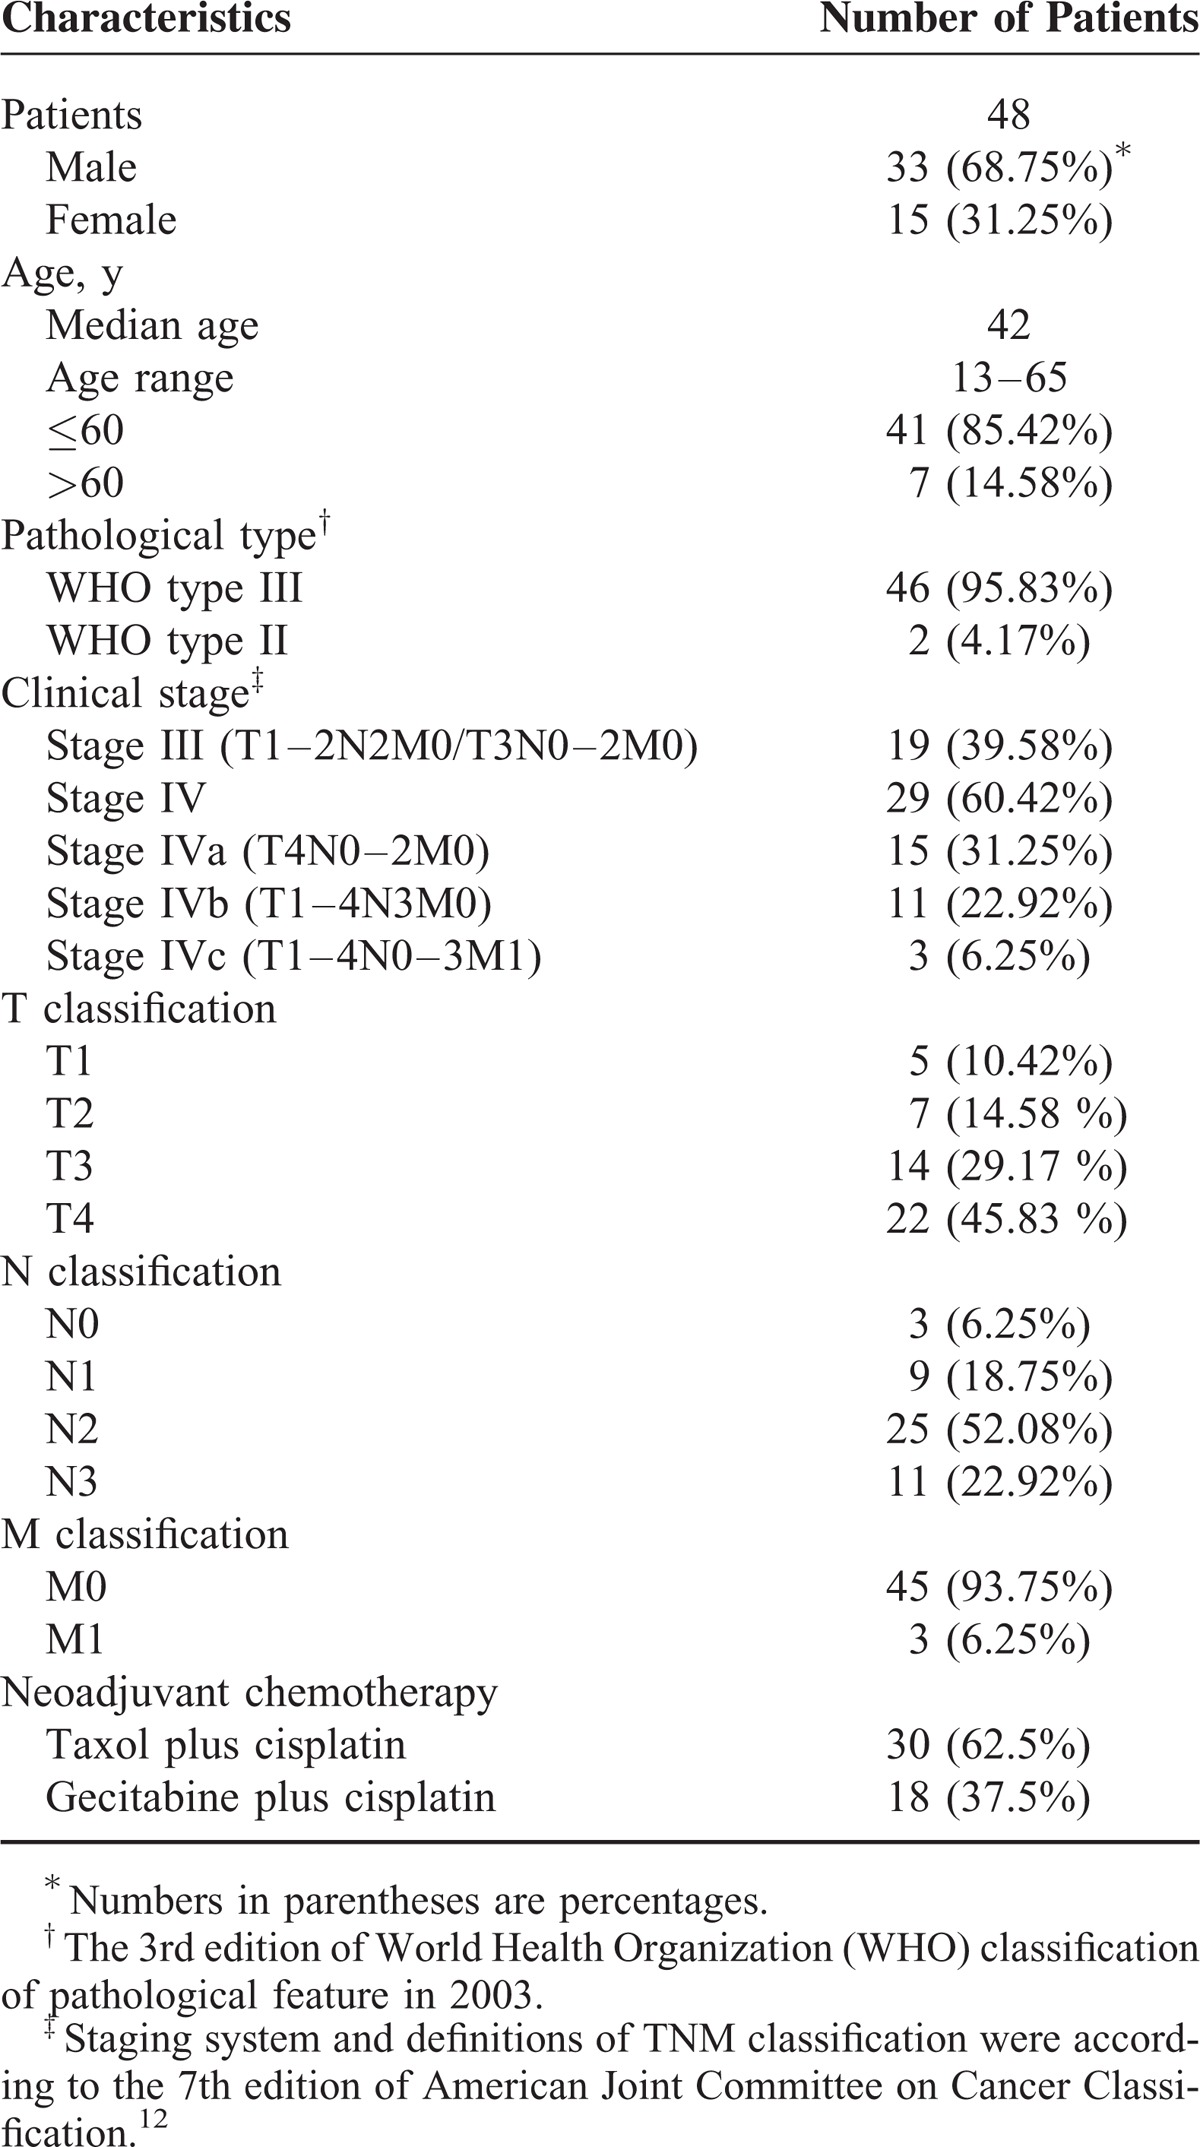
Of the 56 patients who met the inclusion criteria (from August 2012 to May 2013), 48 were recruited into this study finally, and the other 8 were excluded due to image distortions (n = 5) or insufficient follow-up images (n = 3). All recruited patients were staged according to the 7th edition of the American Joint Committee on Cancer Classification.12 Distributions of clinical staging (TNM) were detailed as follow: T1, n = 5 (10.42%); T2, n = 7 (14.58 %); T3, n = 14 (29.17 %); T4, n = 22 (45.83 %); N0, n = 3 (6.25%); N1, n = 9 (18.75%); N2, n = 25 (52.08%); N3, n = 11 (22.92%); M0, n = 45 (93.75%); M1, n = 3 (6.25%). Stage III, n = 19 (39.58%); Stage IV, n = 29 (60.42%). Characteristics of recruited patients and their corresponding chemotherapeutic regimens are listed in Table 1.
TABLE 1.
Clinical Characteristics of Enrolled Nasopharyngeal Carcinoma Patients
Goodness and Reproducibility of IVIM-Derived Parameters
The mean g (goodness of fit R2) parameter, calculated from all measurement, was 0.980 (range: 0.968–0.988), with a lower coefficient of variance (CVs; range: 1.92%–26.01%), suggesting that the goodness of IVIM-derived parameters was reliable and resistant to variations or confounding factors, and also that it fit well with the biexponential model of IVIM theory. In addition, the D, D∗, and f parameters measured by the 2 radiologists were mostly consistent. For IVIM-derived parameters, the intraobserver ICCs of pNT versus mLN were D (0.955 vs 0.97), D∗ (0.949 vs 0.958), and f (0.978 vs 0.965), and their corresponding CVs were D (11.70% vs 15.77%), D∗ (13.7% vs 12.30%), and f (14.1% vs 10.63%), respectively. On the contrary, the interobserver ICCs of pNT versus mLN were D (0.968 vs 0.949), D∗ (0.858 vs 0.882), and f (0.853 vs 0.971), with the corresponding CVs of D, D∗, and f were 8.42% versus 8.78%, 45.84% versus 47.55% and 18.53% versus 19.14%, respectively.
Changes of IVIM-Derived Parameters
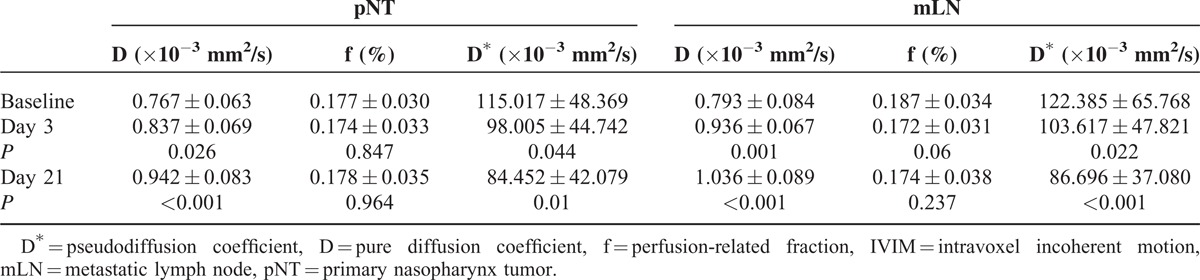
For pNT, the baseline D value was significantly lower than that of day 3 (P = 0.026) or day 21 (P < 0.001), whereas D∗ value was significantly higher at baseline than at day 3 (P = 0.044) or day 21 (P = 0.01). No significant difference was observed on f parameter between baseline and either day 3 (P = 0.847) or day 21 (P = 0.964; Table 2). According to the 7th edition of American Joint Committee on Cancer staging system,12 lymph nodes were considered metastatic if conventional MR images showed that they met the following specific criteria: the minimum diameter of any lymph nodes of the neck ≥10 mm or retropharyngeal lymph nodes ≥5 mm, respectively; and/or central necrosis with a ring enhancement; and/or margin involvement in which the surrounding fat gap disappears. As a result, a total of 128 mLNs were enrolled into the measurement. As with pNT, the D value of mLN was significantly higher on days 3 (P = 0.001) and 21 (P < 0.001) of NAC, relative to the baseline value, whereas their baseline D∗ value was significantly higher than that of days 3 (P = 0.022) and 21 (P < 0.001). The f parameter, however, did not change significantly during the NAC either on day 3 (P = 0.06) or on day 21 (P = 0.237; see Table 2).
TABLE 2.
The IVIM-Derived Parameters Calculated on Primary Nasopharynx Tumors and Metastatic Lymph Nodes
IVIM-Derived Parameters in Different Response Groups
Based on the Response Evaluation Criteria in Solid Tumor criteria, after 2 cycles of NAC, 37 of 48 patients (77.08%) were categorized into the responder group whereas the other 11 were considered nonresponders (Table 3). For primary tumors, the baseline D value in responders was significantly lower than in nonresponders (0.705 vs 0.992 × 10⁻³ mm2/s, P = 0.006; Figures 2 and 3A), whereas the baseline D∗ and f parameters between them were consistent (P > 0.05, Figure 3B and C). The ROC curve analysis (Figure 4A) indicated that, when both sensitivity and specificity were optimized, the threshold of baseline D value in best predicting tumor's chemotherapeutic response was 0.911 × 10⁻³ mm2/s, and the corresponding AUC, sensitivity, and specificity were 0.714, 0.658, and 0.818, respectively. Similarly, the baseline D value of metastatic lymph nodes was significantly lower in responders than in nonresponders (0.673 vs 1.020 × 10⁻³ mm2/s, P = 0.004; Figure 3D; Table 3), whereas the baseline D∗ or f values between them were not significantly different (P > 0.05, Figure 3E and F). As shown in Figure 4B, the ROC curve analysis demonstrated that the threshold of baseline D value of mLN was 0.951 × 10⁻³ mm2/s, with corresponding AUC, sensitivity, and specificity were 0.774, 0.538, and 0.944, respectively.
TABLE 3.
Changes of IVIM-Derived Parameters (ΔParameter) Between Responders and Nonresponders
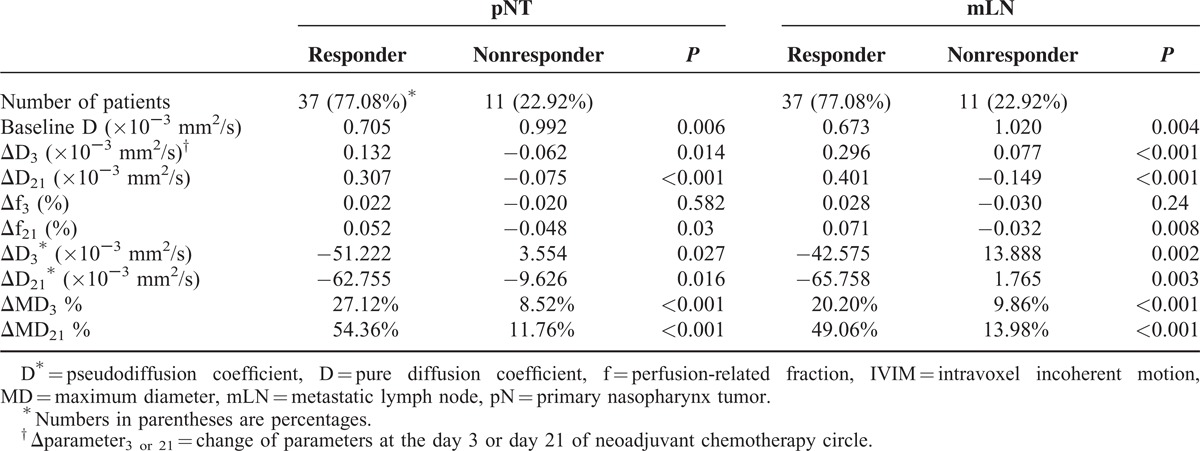
FIGURE 2.
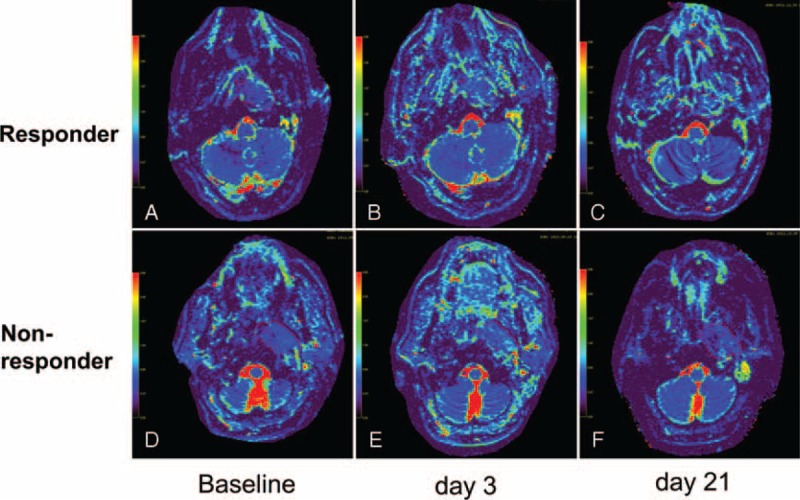
The comparison of changes of D values calculated on primary tumor between a responder and nonresponder during the course of NAC. ROIs (red curves) were manually drawn to contour the border of primary nasopharynx tumor on the axial D maps for a responder (A–C) and a nonresponder (D–F) over the course of NAC, respectively. The mean D value of baseline (A, D), day 3 (B, E), day 21 (C, F) were calculated as 0.676 × 10⁻³ mm2/s, 0.803 × 10⁻³ mm2/s, 1.14 × 10⁻³ mm2/s in responder and 0.681 × 10⁻³ mm2/s, 0.807 × 10⁻³ mm2/s, 0.813 × 10⁻³ mm2/s in nonresponder, respectively. D = pure diffusion coefficient, NAC = neoadjuvant chemotherapy, ROI = region of interests.
FIGURE 3.
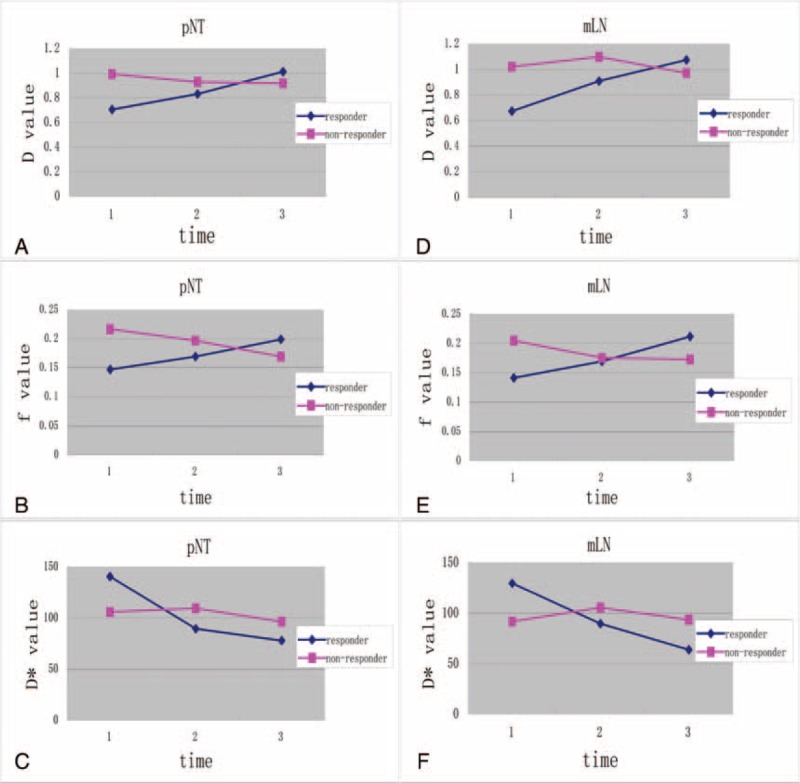
The dynamic changes of IVIM-derived parameters during the course of NAC. The curves of the IVIM-derived parameters in both primary nasopharynx tumors (pNT; map A–C) and metastatic lymph nodes (mLN; map D–F) show that D value increases (A, D) and D∗ value decreases (C, F) more significantly in responders, whereas they are more consistent in nonresponders (A, D, C, F) during the course of NAC. In contrast, f parameter increases in responders and decreases slightly in nonresponders during the NAC, whereas only the changes in f value at day 21 can significantly differentiate the responders from nonresponders (B, E). D∗ = pseudoperfusion coefficient, D = pure diffusion coefficient, f = perfusion-related fraction, IVIM = intravoxel incoherent motion, mLN = metastatic lymph nodes, NAC = Neoadjuvant chemotherapy, pNT = primary nasopharynx tumors.
FIGURE 4.
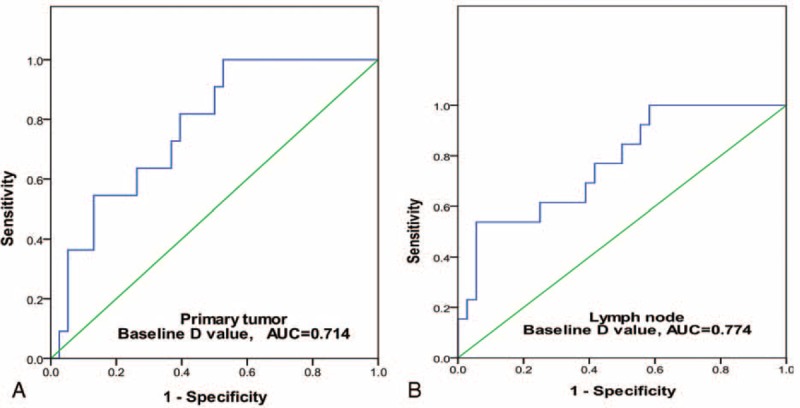
The ROC curve analysis for the baseline D value on both pNT and mLN. The ROC curves indicated that, when both sensitivity and specificity were adjusted to produce the highest accuracy, the optimal thresholds of baseline D value in predicting chemotherapeutic response for primary nasopharyngeal tumor (pNT; map A) and metastatic lymph node (mLN; map B) were 0.911 × 10⁻³ mm2/s and 0.951 × 10⁻³ mm2/s, respectively. And their corresponding AUC, sensitivity, and specificity were, respectively, 0.714, 0.658, 0.818 for pNT and 0.774, 0.538, 0.944 for mLN. AUC = area under curve, D = pure diffusion coefficient, mLN = metastatic lymph node, pNT = primary nasopharynx tumor, ROC = receiver-operating characteristic.
In addition, responders presented a significantly higher ΔD3 and ΔD21 than nonresponders on both pNTs and mLNs (P < 0.05, Figure 3A and D). While ΔD3∗ and ΔD21∗ in responder group were significantly higher than in nonresponder group (P < 0.05, Figure 3C and F). In contrast, NAC elicited no significant changes in f parameter, for all recruited patients. Nevertheless, despite that responders and nonresponders had a consistent Δf3 (P > 0.1, Figure 3B and E), responders did present a higher Δf21 (P < 0.05, see Table 3).
DISCUSSION
Early predicting the treatment response to chemotherapy is conducive to develop an individual and optimal regimen of NAC for NPC patients. By using the IVIM-MRI, this present study demonstrates that both D and D∗ value, rather than f parameter, change more significantly during the course of NAC. In addition, the baseline D value and the early changes of D and D∗ value can effectively differentiate the responders from nonresponders, which suggests that IVIM-MRI can be a potential predictor of the chemotherapeutic response for NPC at the early stage of NAC.
These above observations are consistent with the idea that cell density and abnormal or immature microvessels may decrease after chemotherapy. Consequently, extracellular spaces would enlarge, allowing water molecules to migrate farther with less restriction (ie, pure diffusion) and weakening the process of pseudodiffusion, then yielding a higher D value and a lower D∗ value. In living tissues, however, molecular diffusion is not free and also affected by the microcirculation of blood in the capillary network. Le Bihan et al and Luciani et al both demonstrated that IVIM-MRI can quantitatively distinguish the pure diffusion from the pseudodiffusion of water molecules in microvasculature.17,28 Because D value represents the true molecular diffusion and associates with the ratio of intracellular and extracellular spaces, a tumor with larger areas of stromal tissue appears to exhibit a higher D value.17,29 In contrast, diffusion is more restricted in highly cellular tumors with smaller extracellular and extravascular spaces, which may lead to a lower D value in responders. During the course of NAC, whereas, cellular density in highly cellular tumor tissues (eg, responders) would decrease more dramatically, resulting in a more significant change of D value and a better chemotherapeutic response to NAC. Lai et al22 also demonstrated a significantly higher D and lower D∗ value from postchemoradiation fibrosis than from NPC tumors, which partly agreed with our results. In addition, Zima et al30 and Bisdas et al31,32 both pointed out that perfusion levels might determine the responsiveness to CRT in head and neck tumors, it also agrees with our results that the early changes of D∗ value can effectively distinguish responders from nonresponders, despite no significant differences in baseline D∗ value.
Although, the scale of diffusion (nanometers) versus pseudodiffusion (tens of micrometers) extends across 2 orders of magnitude, the respective diffusion coefficient and pseudodiffusion coefficient only differ by roughly 1 order of magnitude (D is about 1 × 10⁻³ mm2/s, whereas D∗ is about 10 × 10−3 mm2/s) because of the combined effects of elementary particle velocity and distance33: molecular diffusion is a very fast process, whereas pseudodiffusion of blood flow is comparatively much slower but involves distances of tens of micrometers. Microcirculation effects tend to contaminate molecular diffusion, so the IVIM-MRI was proposed as a novel way to suppress the signal from extracellular fluid flowing in perfused cell systems.34,35 Nevertheless, at lower b-factors, there still exists a major challenge to measure tissue's signal intensity reproducibly, because the method suffers dramatically from variations in signal-to-noise ratios and is prone to generate measurement errors.35,36 Other key confounding factors that cause signal variations include tumoral heterogeneity, intravoxel microscopic cystic/necrotic area, cellular pleomorphism, and intravoxel heterogeneity in vascular structures.
In addition, IVIM-derived parameters can also be confounded by tumor's necrosis, a dynamic process within tumor tissues where hypoxic cells become reoxygenated in the early CRT period. This phenomenon can especially affect the measurement of perfusion parameters, and contribute to an overlapping result. Actually, relatively higher CVs were observed on both D∗ (range: 12.3%–47.55%) and f (range: 10.43%–19.14%), reflecting a larger standard deviation. And interestingly, the interobserver ICCs were relatively poorer than those of intraobserver, especially on the D∗ value. This is mainly because the IVIM-derived parameters were measured and calculated by 2 independent radiologists, manually and blindly. Thus, a variance of measurement may exist, more or less, on defining the borders of target lesions. On the contrary, D is much more reliable and less subject to variations or confounding factors (with CVs ranging from 8.42% to 15.77%). Our present results are in agreement with the previous studies, which argued that the method circumscribing the region of interest may had a major influence on D∗ value22–24 and suggested the entire volume of the target tumor should be incorporated into calculations.22,37 For the purpose of improving measurement accuracy, both the inter- and intraobserver variation analyses were conducted to test the repeatability and reproducibility of IVIM-derived parameters. Moreover, the IVIM-MRI sequence also incorporated multiple readings at lower b-factors (≤200 s/mm2, which yield perfusion-sensitive measurements), as was suggested in previous studies.22–24
Lai et al22 suggested that f value could discriminate residual tumor of NPC from the postchemoradiation fibrosis, and argued that newly diagnosed NPCs at lower stages displayed a significantly higher f value than those at more advanced stages.37 Nevertheless, the coefficient of variation of f parameter was relatively higher, which primarily associated with the relaxation effects and T2 contribution.21,33 Another study conducted by Hauser et al38 also correlated a higher baseline f value with poor treatment outcomes in head and neck squamous cell carcinoma underwent CRT and/or immunotherapy. On the contrary, by using perfusion MRI, Chawla et al39 claimed tumors with a poor prognosis initially always showed a lower plasma volume fraction. In this present study, however, the f value was more consistent during the course of NAC. Although responders characterized a greater change at day 21 of NAC, the baseline f value and corresponding change at day 3 cannot significantly differentiate responders from nonresponders. Because f value correlates with the process of angiogenesis in normal or intact vasculature and partly reflects the microvasculature's permeability, normal angiogenesis should not change significantly at the early stage of NAC, so an observation window of 21 days (1 chemotherapy cycle) may be too short for f parameter. In the next study, it is prospected to further prolong the observation periods and continue following the changes of f parameter.
The first limitation of this study is that the observation endpoint (only 2 cycle chemotherapy) is too short before cytotoxicity damage can be repaired (eg, cells resume cycling, tissues are repopulated via division of surviving cells, and hypoxic cells are reoxygenated), because tissue repair is certainly ongoing during the course of radiotherapy and likely confounds relevant changes in IVIM-derived parameters. In addition, this study mainly evaluated the early chemotherapeutic response rather than the long-term survival outcomes with disease-free survival status. So far during the writing of this manuscript, the latest follow-up data have demonstrated that residual tumor after CRT arose in 3 patients among nonresponders. In contrast, none of the responders have signs of residual tumors, suggesting that IVIM-derived parameters can be valuable in early predicting the short-term chemotherapeutic response of NAC. Nevertheless, the authors also purpose to prolong the follow-up period to draw a long-term survival outcome to further prove the present results. Finally, the sample size of this study was relatively small for such a prospective subgroup analysis that could result in a statistical bias. Therefore, further study with a large cohort and multicenter data and long-term follow-up survival outcome is desired in the near future.
CONCLUSIONS
IVIM-derived parameters, especially the D and D∗ value, display a characteristic change during the course of NAC in locoregionally advanced NPC. Patients who have a lower baseline D value and higher ΔD and ΔD∗ tend to respond better to neoadjuvant chemotherapy. Thus, IVIM-MRI can potentially early predict the treatment response to NAC for NPC patients.
Acknowledgments
This study is partly supported by the Social Development Guidance Project of Fujian Province(Grant No.2014Y0013), and partly supported by the National Clinical Key Specialty Construction Program and Key Clinical Specialty Discipline Construction Program of Fujian, P.R.C.
Footnotes
Abbreviations: DWI = diffusion-weighted imaging, IMRT = intensity-modulated radiation therapy, IVIM = intravoxel incoherent motion, MRI = magnetic resonance imaging, NAC = neoadjuvant chemotherapy, NPC = nasopharyngeal carcinoma.
This study is also partly supported by the National Clisnical Key Specialty Construction Program and Key Clinical Specialty Discipline Construction Program of Fujian, P.R.C, could you please help us add these messages in this place and the part of Acknowledge.
The authors have no conflicts of interest to disclose.
REFERENCES
- 1.Chan AT, Teo PM, Johnson PJ. Nasopharyngeal carcinoma. Ann Oncol 2002; 13:1007–1015. [DOI] [PubMed] [Google Scholar]
- 2.Wei KR, Yu YL, Yang YY, et al. Epidemiological trends of nasopharyngeal carcinoma in China. Asian Pac J Cancer Prev 2010; 11:29–32. [PubMed] [Google Scholar]
- 3.Su SF, Han F, Zhao C, et al. Long-term outcomes of early-stage nasopharyngeal carcinoma patients treated with intensity-modulated radiotherapy alone. Int J Radiat Oncol Biol Phys 2012; 82:327–333. [DOI] [PubMed] [Google Scholar]
- 4.Zong J, Lin S, Lin J, et al. Impact of intensity-modulated radiotherapy on nasopharyngeal carcinoma: validation of the 7th edition AJCC staging system. Oral Oncol 2015; 51:254–259. [DOI] [PubMed] [Google Scholar]
- 5.Perri F, Bosso D, Buonerba C, et al. Locally advanced nasopharyngeal carcinoma: current and emerging treatment strategies. World J Clin Oncol 2011; 2:377–383. [DOI] [PMC free article] [PubMed] [Google Scholar]
- 6.Kwong DL, Sham JS, Leung LH, et al. Preliminary results of radiation dose escalation for locally advanced nasopharyngeal carcinoma. Int J Radiat Oncol Biol Phys 2006; 64:374–381. [DOI] [PubMed] [Google Scholar]
- 7.El-Sherbieny E, Rashwan H, Lubis SH, et al. Prognostic factors in patients with nasopharyngeal carcinoma treated in Hospital Kuala Lumpur. Asian Pac J Cancer Prev 2011; 12:1739–1743. [PubMed] [Google Scholar]
- 8.Zhao LN, Zhou B, Shi M, et al. Clinical outcome for nasopharyngeal carcinoma with predominantly WHO II histology treated with intensity-modulated radiation therapy in non-endemic region of China. Oral Oncol 2012; 48:864–869. [DOI] [PubMed] [Google Scholar]
- 9.Mao YP, Xie FY, Liu LZ, et al. Re-evaluation of 6th edition of AJCC Staging System for nasopharyngeal carcinoma and proposed improvement based on magnetic resonance imaging. Int J Radiat Oncol Biol Phys 2009; 73:1326–1334. [DOI] [PubMed] [Google Scholar]
- 10.Lu H, Peng L, Yuan X, et al. Concurrent chemoradiotherapy in locally advanced nasopharyngeal carcinoma: a treatment paradigm also applicable to patients in Southeast Asia. Cancer Treat Rev 2009; 35:345–353. [DOI] [PubMed] [Google Scholar]
- 11.Al-Sarraf M, LeBlanc M, Giri PG, et al. Chemoradiotherapy versus radiotherapy in patients with advanced nasopharyngeal cancer: phase III randomized intergroup study 0099. J Clin Oncol 1998; 16:1310–1317. [DOI] [PubMed] [Google Scholar]
- 12.Edge SB, Compton CC. The American Joint Committee on Cancer: the 7th edition of the AJCC cancer staging manual and the future of TNM. Ann Surg Oncol 2010; 17:1471–1474. [DOI] [PubMed] [Google Scholar]
- 13.Zheng D, Chen Y, Chen Y, et al. Dynamic contrast-enhanced MRI of nasopharyngeal carcinoma: a preliminary study of the correlations between quantitative parameters. J Magn Reson Imaging 2014; 39:940–948. [DOI] [PubMed] [Google Scholar]
- 14.Hong J, Yao Y, Zhang Y, et al. Value of magnetic resonance diffusion-weighted imaging for the prediction of radiosensitivity in nasopharyngeal carcinoma. Otolaryngol Head Neck Surg 2013; 149:707–713. [DOI] [PubMed] [Google Scholar]
- 15.Lemke A, Laun FB, Simon D, et al. An in vivo verification of the intravoxel incoherent motion effect in diffusion-weighted imaging of the abdomen. Magn Reson Med 2010; 64:1580–1585. [DOI] [PubMed] [Google Scholar]
- 16.Koh DM, Collins DJ, Orton MR. Intravoxel incoherent motion in body diffusion-weighted MRI: reality and challenges. Am J Roentgenol 2011; 196:1351–1361. [DOI] [PubMed] [Google Scholar]
- 17.Le Bihan D, Breton E, Lallemand D, et al. Separation of diffusion and perfusion in intravoxel incoherent motion MR imaging. Radiology 1988; 168:497–505. [DOI] [PubMed] [Google Scholar]
- 18.Pang Y, Turkbey B, Bernardo M, et al. Intravoxel incoherent motion MR imaging for prostate cancer: an evaluation of perfusion fraction and diffusion coefficient derived from different b-value combinations. Magn Reson Med 2013; 69:553–562. [DOI] [PMC free article] [PubMed] [Google Scholar]
- 19.Coenegrachts K, Delanote J, Ter Beek L, et al. Evaluation of true diffusion, perfusion factor, and apparent diffusion coefficient in non-necrotic liver metastases and uncomplicated liver hemangiomas using black-blood echo planar imaging. Eur J Radiol 2009; 69:131–138. [DOI] [PubMed] [Google Scholar]
- 20.Sumi M, Nakamura T. Diagnostic importance of focal defects in the apparent diffusion coefficient-based differentiation between lymphoma and squamous cell carcinoma nodes in the neck. Eur Radiol 2009; 19:975–981. [DOI] [PubMed] [Google Scholar]
- 21.Sumi M, Van Cauteren M, Sumi T, et al. Salivary gland tumors: use of intravoxel incoherent motion MR imaging for assessment of diffusion and perfusion for the differentiation of benign from malignant tumors. Radiology 2012; 263:770–777. [DOI] [PubMed] [Google Scholar]
- 22.Lai V, Li X, Lee VH, et al. Intravoxel incoherent motion MR imaging: comparison of diffusion and perfusion characteristics between nasopharyngeal carcinoma and post-chemoradiation fibrosis. Eur Radiol 2013; 23:2793–2801. [DOI] [PubMed] [Google Scholar]
- 23.Zhang SX, Jia QJ, Zhang ZP, et al. Intravoxel incoherent motion MRI: emerging applications for nasopharyngeal carcinoma at the primary site. Eur Radiol 2014; 24:1998–2004. [DOI] [PMC free article] [PubMed] [Google Scholar]
- 24.Marzi S, Piludu F, Vidiri A. Assessment of diffusion parameters by intravoxel incoherent motion MRI in head and neck squamous cell carcinoma. NMR Biomed 2013; 26:1806–1814. [DOI] [PubMed] [Google Scholar]
- 25.Federau C, Maeder P, O’Brien K, et al. Quantitative measurement of brain perfusion with intravoxel incoherent motion MR imaging. Radiology 2012; 265:874–881. [DOI] [PubMed] [Google Scholar]
- 26.Le Bihan D, Turner R, MacFall JR. Effects of intravoxel incoherent motions (IVIM) in steady-state free precession (SSFP) imaging: application to molecular diffusion imaging. Magn Reson Med 1989; 10:324–337. [DOI] [PubMed] [Google Scholar]
- 27.Eisenhauer EA, Therasse P, Bogaerts J, et al. New response evaluation criteria in solid tumours: revised RECIST guideline (version1.1). Eur J Cancer 2009; 45:228–247. [DOI] [PubMed] [Google Scholar]
- 28.Luciani A, Vignaud A, Cavet M, et al. Liver cirrhosis: intravoxel incoherent motion MR imaging—pilot study. Radiology 2008; 249:891–899. [DOI] [PubMed] [Google Scholar]
- 29.Le Bihan D. Diffusion, confusion and functional MRI. Neuroimage 2012; 62:1131–1136. [DOI] [PubMed] [Google Scholar]
- 30.Zima A, Carlos R, Gandhi D, et al. Can pretreatment CT perfusion predict response of advanced squamous cell carcinoma of the upper aerodigestive tract treated with induction chemotherapy? AJR Am J Neuroradiol 2007; 28:328–334. [PMC free article] [PubMed] [Google Scholar]
- 31.Bisdas S, Rumboldt Z, Surlan-Popovic K, et al. Perfusion CT in squamous cell carcinoma of the upper aerodigestive tract: long-term predictive value of baseline perfusion CT measurements. Am J Neuroradiol 2010; 31:576–581. [DOI] [PMC free article] [PubMed] [Google Scholar]
- 32.Bisdas S, Nguyen SA, Anand SK, et al. Outcome prediction after surgery and chemoradiation of squamous cell carcinoma in the oral cavity, oropharynx, and hypopharynx: use of baseline perfusion CT microcirculatory parameters vs. tumor volume. Int J Radiat Oncol Biol Phys 2009; 73:1313–1318. [DOI] [PubMed] [Google Scholar]
- 33.Le Bihan D, Turner R. The capillary network: a link between IVIM and classical perfusion. Magn Reson Med 1992; 27:171–178. [DOI] [PubMed] [Google Scholar]
- 34.Zhao L, Sukstanskii AL, Kroenke CD, et al. Intracellular water specific MR of microbead-adherent cells: HeLa cell intracellular water diffusion. Magn Reson Med 2008; 59:79–84. [DOI] [PMC free article] [PubMed] [Google Scholar]
- 35.Thoeny HC, De Keyzer F, Boesch C, et al. Diffusion-weighted imaging of the parotid gland: influence of the choice of b-values on the apparent diffusion coefficient value. J Magn Reson Imaging 2004; 20:786–790. [DOI] [PubMed] [Google Scholar]
- 36.Lemke A, Stieltjes B, Schad LR, et al. Toward an optimal distribution of b values for intravoxel incoherent motion imaging. Magn Reson Imaging 2011; 29:766–776. [DOI] [PubMed] [Google Scholar]
- 37.Lai V, Li X, Lee VH, et al. Nasopharyngeal carcinoma: comparison of diffusion and perfusion characteristics between different tumour stages using intravoxel incoherent motion MR imaging. Eur Radiol 2014; 24:176–183. [DOI] [PubMed] [Google Scholar]
- 38.Hauser T, Essig M, Jensen A, et al. Characterization and therapy monitoring of head and neck carcinomas using diffusion-imaging-based intravoxel incoherent motion parameters-preliminary results. Neuroradiology 2013; 55:527–536. [DOI] [PubMed] [Google Scholar]
- 39.Chawla S, Kim S, Dougherty L, et al. Pretreatment diffusion-weighted and dynamic contrast-enhanced MRI for prediction of local treatment response in squamous cell carcinomas of the head and neck. Am J Roentgenol 2013; 200:35–43. [DOI] [PMC free article] [PubMed] [Google Scholar]