

Abstract
Metabolic syndrome (MS), high-sensitivity C-reactive protein (hs-CRP), and chronic kidney disease (CKD) are related to cardiovascular diseases. Although MS is common in CKD subjects, the contribution of MS-associated risk factors and hs-CRP to arterial stiffness in CKD has not been well studied.
In this cross-sectional cohort study, we enrolled 9903 subjects who underwent brachial-ankle pulse wave velocity (baPWV) measurements from our database of Health Care Center. CKD was defined as an estimated glomerular filtration rate (eGFR) <60 mL/min/1.73 m2. Comparing those grouped with and without CKD, multivariate linear regression analyses were used.
Overall, baPWV was found to have an inverse relationship with eGFR (P for trend <0.001), which increased progressively with the presence of CKD, increasing number of MS-associated risk factors and hs-CRP (P for trend <0.001). In the non-CKD group, age, body mass index (BMI), systolic blood pressure (SBP), diastolic blood pressure (DBP), fasting glucose, triglyceride, high-density lipoprotein cholesterol, and hs-CRP independently predicted baPWV, whereas in CKD, eGFR, age, gender, body mass index, SBP, DBP, and fasting glucose remained predictors.
The number of MS-associated risk factors and hs-CRP remains a determinant of arterial stiffness in both CKD and non-CKD groups. The decline of renal function contributes to arterial stiffness only in CKD but not in non-CKD. Our findings suggest that for CKD subjects, renal function, BP, and glycemic control are potential targets for further interventional studies of arterial stiffness.
INTRODUCTION
Coronary artery disease is the leading cause of death worldwide.1 Central obesity and insulin resistance are significantly associated with a cluster of cardiometabolic risk factors well-known as metabolic syndrome (MS)2 that is correlated to cardiovascular disease and type 2 diabetes mellitus.3 High-sensitivity C-reactive protein (hs-CRP), an inflammatory biomarker, is also associated with insulin resistance4 and type 2 diabetes mellitus,5 and is frequently used in clinical practice as the risk factor for coronary artery disease and all-cause mortality.6,7 However, few studies have combined these major risk factors in cardiovascular disease or mortality prediction.8
MS is also widely prevalent in chronic kidney disease (CKD)9 and has been also implicated as a risk factor for CKD.10 Meanwhile, CKD is common in community and is associated with an increased risk of cardiovascular disease.11 An independent, graded association was observed between a reduced estimated glomerular filtration rate (eGFR) and the risk of death, cardiovascular events, and hospitalization in a large, community-based population.12 Conventional cardiovascular risk factors, including hypertension, dyslipidemia, and diabetes, all of which are common in CKD subjects and are themselves contributory risk factors for CKD, only partially explain the high cardiovascular risk.13
Arterial stiffness presented by pulse wave velocity (PWV) has been well studied as a risk predictor for coronary artery disease14 and all-cause mortality15 among general populations. Among diabetic patients, it also associated with reduced arterial flow volume in the lower extremities,16 mortality, and cardiovascular morbidity.17 However, few studies have simultaneously investigated and compared determinants of arterial stiffness from the pool of MS-associated risk factors and hs-CRP among a large cohort including CKD and non-CKD subjects.
METHODS
Study Design and Population
In this cross-sectional study, we retrospectively analyzed the clinical data of subjects who underwent a self-paid health examination at the Health Care Center of Chang Gung Memorial Hospital, Taoyuan branch, from January 1, 2005 through December 31, 2007. All subjects were required to be afebrile and to have undergone a standardized protocol, including the structured questionnaires covering the personal and family history of chronic diseases and life style, as well as measurements of body weight and height. The inclusion criteria were 18 to 95 years old with a standardized vascular assessment of brachial-ankle PWV (baPWV) measurement. We excluded the subjects with pyuria to minimize the risks for infection or acute renal insufficiency. CKD in the study was defined as an eGFR <60 mL/min/1.73 m2. These subjects were categorized by CKD or non-CKD, number of MS-associated risk factors and hs-CRP. The correlations with baPWV between groups were analyzed. All subjects provided their written informed consent. The study was approved by the Ethics Committee of the Institutional Review Board of Chang Gung Memorial Hospital (approval number: 102-4175B) and performed according to the ethical principles of the Declaration of Helsinki.
MS-Associated Risk Factors and hs-CRP
The MS-associated risk factors were determined according to the criteria from the third report of the National Cholesterol Education Program expert panel on the detection, evaluation, and treatment of high blood cholesterol in adults (Adult Treatment Panel III)18 and the American College of Endocrinology Position Statement on Insulin Resistance Syndrome.2 The 5 MS-associated risk factors defined in the present study included high body mass index (BMI) (≥25 kg/m2), high blood pressure (BP) (≥130/85 mm Hg), high fasting plasma glucose (≥100 mg/dL), low high-density lipoprotein (HDL) cholesterol level (<40 mg/dL in men or <50 mg/dL in women), and high triglyceride level (≥150 mg/dL). Elevated hs-CRP level was defined as ≥3 mg/L. Putting above factors together, we further classified all subjects to Group I by 0 to 2 risk factors, to Group II by 3 or 4 factors, and to Group III by 5 or 6 factors.
Measurements
Eligible subjects completed anthropometric measurements and collection of venous blood samples in the morning after overnight fasting. BMI was calculated as body weight (kg) divided by the square of body height (m). The biochemical tests included assessments of serum creatinine, fasting plasma glucose, triglyceride, HDL cholesterol, and hs-CRP at the central laboratory of Taoyuan Chang Gung Memorial Hospital. The eGFR was calculated by using the Modification of Diet in Renal Disease equation.19
Arterial Stiffness as Represented by Pulse Wave Velocity
baPWV was measured by using an automated apparatus (Colin VP-1000, Omron, Kyoto, Japan). The subjects were told to avoid tobacco or any stimulant beverages, such as coffee or alcohol, before the examination. A standardized temperature was kept in the examination room. Four pneumatic pressure cuffs were placed appropriately around both arms and both ankles. Two electrocardiographic electrodes were attached on both wrists, and 1 microphone probe for heart sound detecting was placed at the second intercostal space at the left margin of sternum. After the subjects were kept in a resting supine position for 15 min, the automatically processing procedure started with the simultaneous measurements of BP over 4 extremities by the oscillometric principle, followed by performing the pulse volume recording over right arm and both ankles for 10 sec when the cuff pressures were maintained at the level of 60 mm Hg. The recorded cuff pressure signals are thought to be the pulse volume traces corresponding to the intra-arterial pressure contours. The recorded pulse volume traces provided the pulse transit time between the right arm and right ankle, and between the right arm and left ankle. The assumed length of an arterial segment between the arm and ankle was calculated automatically from height according to the regression equation: distance = 0.5934 × height + 14.401. Right and left baPWVs were calculated automatically as length/transit time between right arm and both ankles. We calculated the mean of right and left PWVs as the representative baPWV.
Statistical Analysis
Data were analyzed by using SPSS 18.0 software for Windows 7 (SPSS Inc., Chicago, IL) and expressed as the mean ± SD or frequency, as appropriate. All variables were tested for normal distribution using the Kolmogorov–Smirnov test. One-way analysis of variance was applied to compare differences in continuous variables, whereas categorical data were tested by using the Pearson's chi-squared test. When age, gender, individual MS-associated risk factors, and hs-CRP were considered, adjusted risk estimates for PWV were calculated by using multivariate linear regression analyses in the 4 predefined models (Table 1), including prognostic risk factors from published observations, such as eGFR, age, gender, the number of MS-associated risk factors, BMI, systolic blood pressure (SBP), diastolic blood pressure (DBP), glucose, triglyceride, and HDL cholesterol.20 All statistical tests were 2-tailed, and a P value <0.05 indicated statistical significance.
TABLE 1.
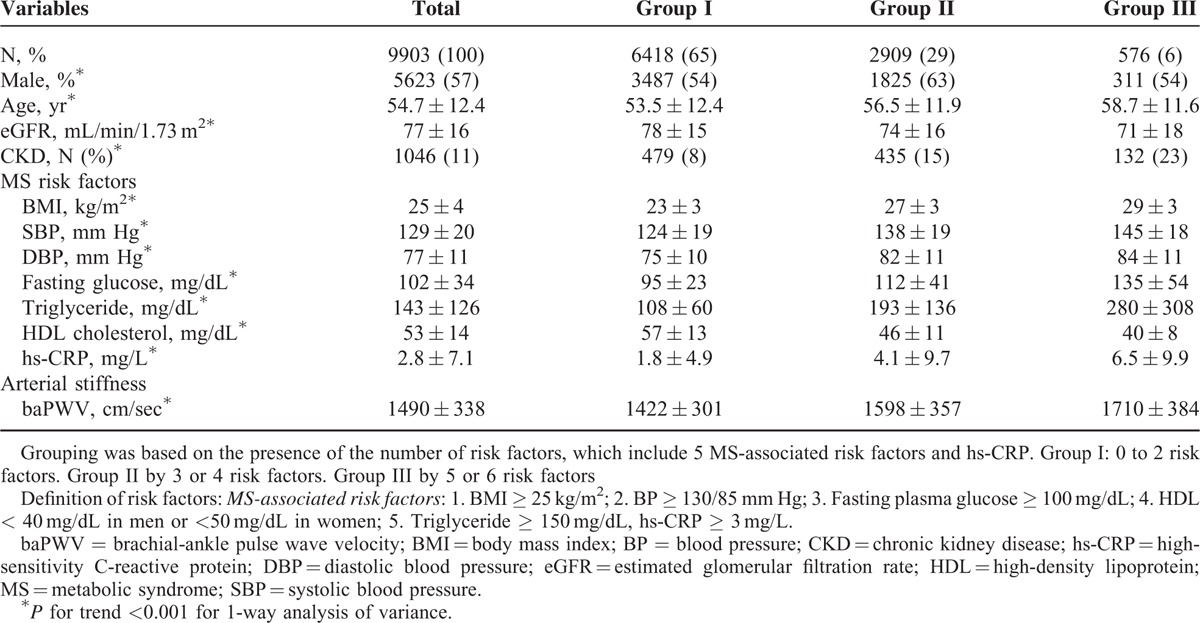
Baseline Characteristics of 9903 Subjects Enrolled in the Study, Categorized by Different Groups
RESULTS
Present study included 9903 subjects with a mean age of 54.7 years, male gender rate of 57%, mean eGFR of 77 mL/min/1.73 m2 with a range from 4 to 189 mL/min/1.73 m2, CKD rate of 11%, and mean baPWV of 1490 cm/sec.
The Relationship Between Arterial Stiffness and the Severity of CKD
Overall, baPWV was negatively correlated with eGFR (P for trend <0.001) (Figure 1). Subjects with an eGFR >90 mL/min/1.73 m2 had the lowest baPWV, while those with an eGFR 15–29 mL/min/1.73 m2 had the highest baPWV. The baPWV increased progressively with the decline in eGFR.
FIGURE 1.
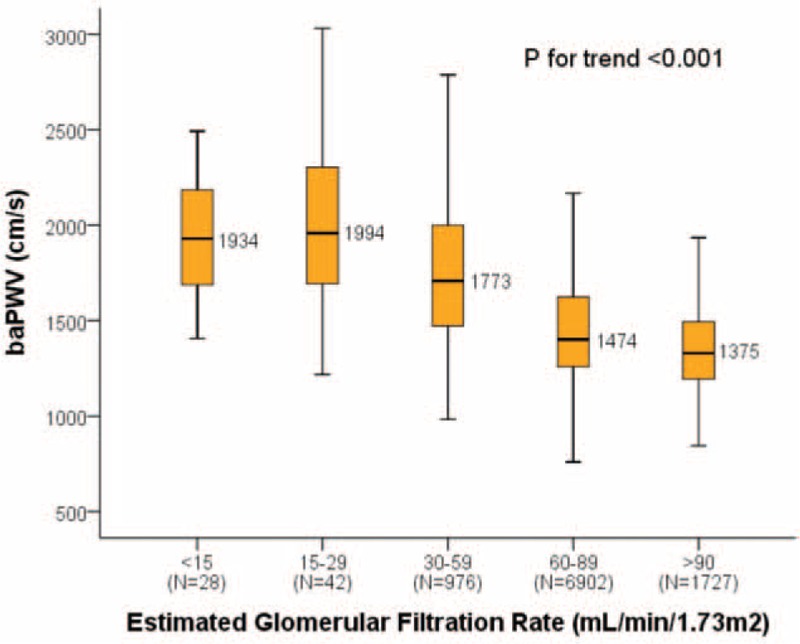
The associations between baPWV and renal function. P for trend is for 1-way analysis of variance. P = 0.008 for “eGFR = 30–59 mL/min/1.73 m2 vs eGFR < 15 mL/min/1.73 m2”; P = 0.445 for “eGFR = 15–29 mL/min/1.73 m2 vs eGFR < 15 mL/min/1.73 m2”; other inter-groups P < 0.001. baPWV = brachial-ankle pulse wave velocity; eGFR = estimated glomerular filtration rate.
The Relationship Between Arterial Stiffness and New Risk Group Combined MS-Associated Risk Factors and hs-CRP
Subjects were classified into 3 groups according to the number of MS-associated risk factors and hs-CRP. Within this cohort, 6418 (65%) subjects were classified to Group I, 2909 (29%) to Group II, and 576 (6%) to Group III. Subject demographics, stratified by new risk group, are presented in Table 2. Age, CKD proportion, BMI, SBP, DBP, fasting plasma glucose, triglyceride, and hs-CRP were positively correlated with the number of MS-associated risk factors and hs-CRP (all P for trend <0.001), while eGFR and HDL cholesterol were negatively correlated (both P for trend <0.001). PWV also positively correlated with the number of MS-associated risk factors and hs-CRP (P for trend <0.001). Group III with the most MS-associated risk factors and hs-CRP had the highest age, CKD proportion, BMI, SBP, DBP, fasting plasma glucose, triglyceride level, hs-CRP level, baPWV, and the lowest eGFR, HDL cholesterol level within the 3 groups.
TABLE 2.
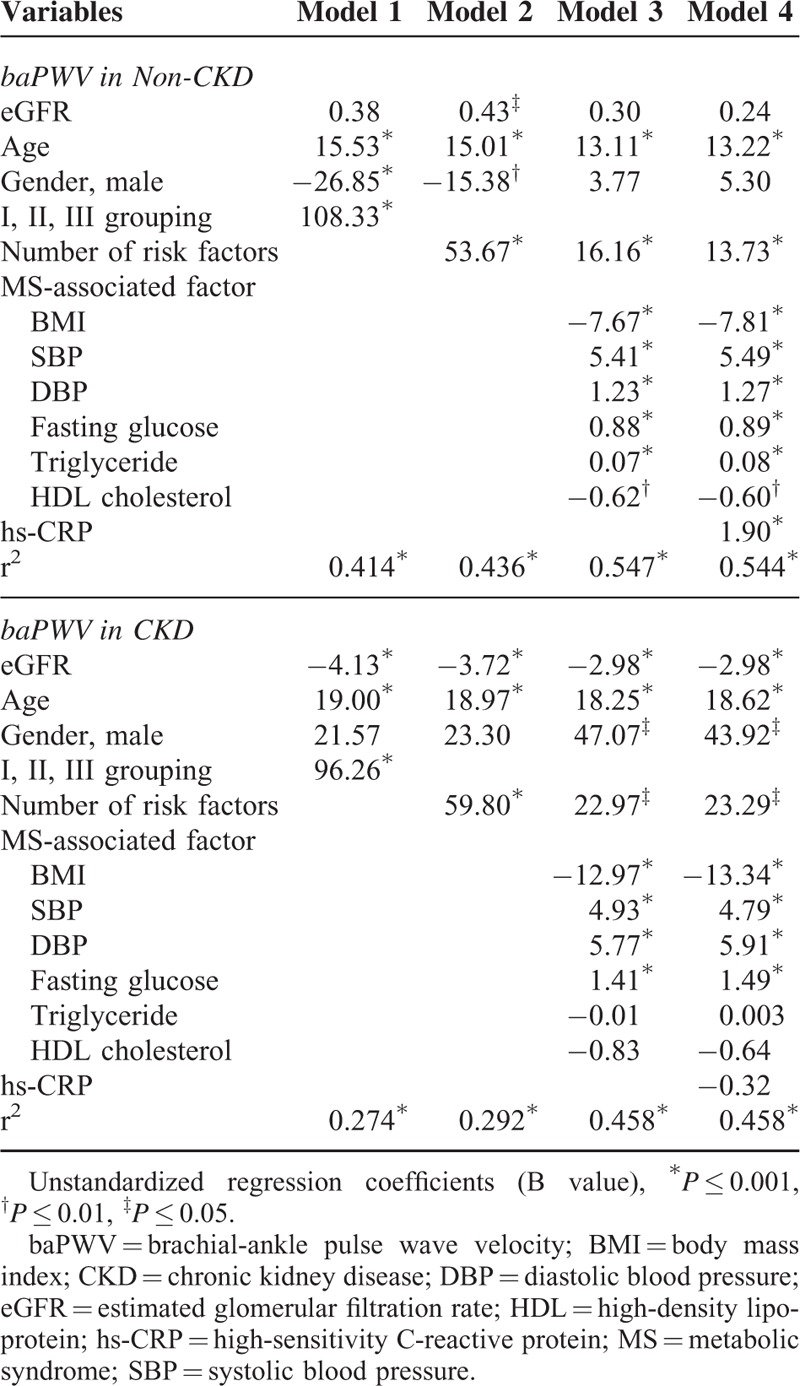
Multivariate Linear Regression Analyses of MS-Associated Risk Factors and hs-CRP as Independent Predictors of Arterial Stiffness (baPWV) in the Non-CKD or CKD Subjects, by 4 Predefined Models
The Relationship Between Arterial Stiffness and the Number of MS-Associated Risk Factors and hs-CRP, Based on Whether CKD Was Present or Not
baPWV increased progressively with the presence of CKD and the risk groups of MS-associated risk factors and hs-CRP (P for trend <0.001) (Figure 2). In both non-CKD and CKD, baPWV increased progressively with the increased number of MS-associated risk factors and hs-CRP (all inter-groups P < 0.001, except P = 0.005 for Group III in non-CKD vs Group I in CKD, and P = 0.001 for Group II in CKD vs Group III in CKD). Group I in non-CKD had the lowest baPWV level while Group III in CKD had the highest.
FIGURE 2.
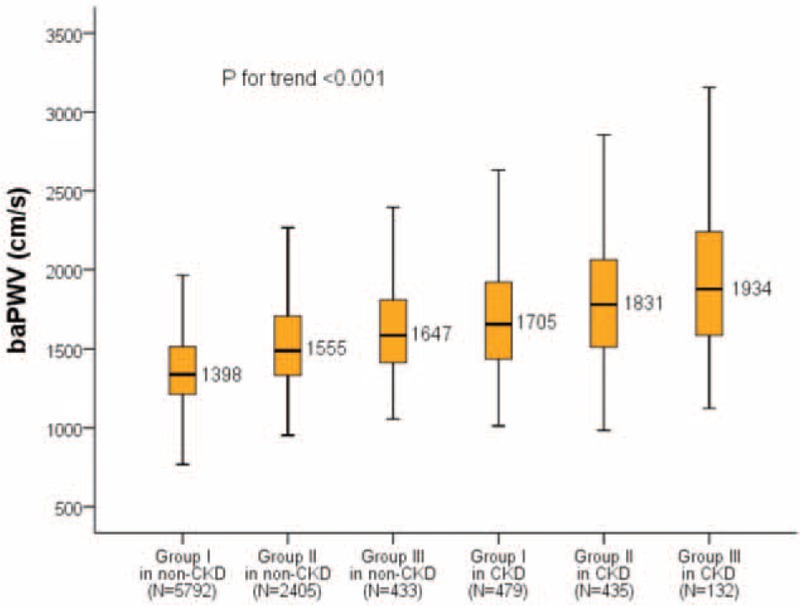
The levels of baPWV categorized by the presence of CKD, the number of metabolic syndrome-associated risk factors and hs-CRP. P for trend is for 1-way analysis of variance. P = 0.005 for “Group III in non-CKD vs Group I in CKD”; P = 0.001 for “Group II in CKD vs Group III in CKD”; other inter-groups P < 0.001. baPWV = brachial-ankle pulse wave velocity; chronic kidney disease = CKD; high-sensitivity C-reactive protein = hs-CRP.
Independent Predictors of Arterial Stiffness, Based on the Presence or Absence of CKD
Multivariate liner regression of MS-associated risk factors and hs-CRP as the independent predictors of baPWV in the CKD or non-CKD subjects were conducted by the predefined 4 models.
In non-CKD subjects, all MS-associated risk factors and hs-CRP were independently associated to higher baPWV, with the exception of HDL cholesterol. In addition, older age was another independent risk factor for arterial stiffness. The presence of the higher combined number of MS risk factors and hs-CRP also predicted higher baPWV in the non-CKD patients. All predictors except BMI were positively correlated with higher baPWV.
In CKD subjects, BP (SBP/DBP), fasting glucose, and age persisted to contribute to arterial stiffness, while individual hs-CRP, triglyceride, and HDL failed to show the same association. However, combined number of MS risk factors and hs-CRP remained as an independently positive predictor of increased arterial stiffness in these patients. On the contrary, BMI and eGFR were independently and negatively correlated with baPWV.
Compared to non-CKD subjects, fewer MS-associated risk factors and more non-MS factors including eGFR and gender were demonstrated as determinants of arterial stiffness in CKD subjects.
DISSCUSSION
This is the first large cohort study to simultaneously investigate and compare risk factors for arterial stiffness in CKD and non-CKD subjects. First, we demonstrated that the deterioration of renal function was related to an increased arterial stiffness across the spectrum of eGFR. In previous studies, Kawamoto et al21 and Wang et al22 reported a stepwise increase in arterial stiffness corresponding with stages of CKD. Similarly, arterial stiffness was independently associated with the rate of change in renal function in 133 patients with CKD stages 3 and 4.23 Elias et al24 also reported that the decline of renal function of 482 community residences was independently related to higher levels of baseline PWV over a mean follow-up of 4.8 years. However, all above studies were small sample sized. Our study is the first large cross-sectional cohort study involving nearly 10,000 subjects to prove the strong negative relationship between eGFR and arterial stiffness.
Second, we showed a stepwise increase in arterial stiffness corresponding with the numbers of MS-associated risk factors and hs-CRP. This finding was comparable to previous data from a small cohort of subjects with minimal comorbidity and eGFR ranging from 8 to 154 mL/min/1.73 m2.20 Moreover, we demonstrated that CKD is a strong risk factor for arterial stiffness across the spectrum of the number of MS-associated risk factors and hs-CRP. Our results suggest that for further studies, the addition of eGFR <60 mL/min/1.73 m2 to screening based on traditional cardiovascular risk factors may aid in clarifying the associations between arterial stiffness, cardiovascular events, and mortality.
Previous cross-sectional community-based studies reported that PWV was correlated with age, BP, BMI, blood glucose, and abnormal lipid in the multivariate regression analyses,25,26 and this is similar to our findings in non-CKD. It is interesting that baPWV was negatively correlated with BMI in a large cohort study in Japan,25 while carotid-femoral PWV was positively correlated with that in the Framingham Heart study.26 In a cross-sectional population-based study, surveying the associations between different regional PWVs and cardiovascular risk factors, carotid-femoral and heart-femoral PWV positively correlated with BMI, which was negatively correlated with femoral-ankle PWV.27 Theoretically, arterial stiffness is related to the lumen diameter and distensibility of the artery. A study focusing on the associations between obesity and arterial stiffness reported that BMI was related to increased lumen diameter and reduced distensibility in femoral arteries.28 As a result, the negative relationship between baPWV and BMI may be attributable to the result of a complex interaction of increasing the lumen diameters of peripheral arteries along of increasing BMI, overwhelming reducing arterial distensibility. Further studies may be needed to clarify the associations between central, peripheral PWV and BMI, and their clinical significances.
A previous study demonstrated that subjects with a lower eGFR have higher risks for death, cardiovascular events, and hospitalization.12 Meanwhile, PWV, measured as a maker of arterial stiffness, was reported to provide good prognostic significance for coronary artery calcium score in CKD patients,29 maximum intima-media thickness of the carotid artery,30 walking time,31 cardiovascular disease, and all-cause mortality32,33 in end-stage renal disease patients. In present study, we found that in CKD, eGFR, age, gender, the number of MS-associated risk factors, hs-CRP, BMI, SBP, DBP, and fasting plasma glucose were independently predicted arterial stiffness. Moreover, eGFR independently predicted arterial stiffness only in CKD but not in non-CKD, whereas dyslipidemia and elevated hs-CRP level predicted arterial stiffness in non-CKD but not in CKD. A study surveying the associations between risk factors for MS and arterial stiffness among CKD patients reported that eGFR was not an independent predictor of arterial stiffness, possibly due to its enrolled subjects having a wide eGFR range of ≤90 mL/min/1.73 m2.20 It is interesting that 1 report found that in 264 CKD stage 3–5 patients, although eGFR may have independently predicted PWV, the contribution of eGFR did not appear to be clinically meaningful when compared with traditional cardiovascular risk factors.34 This is similar to our findings, even though eGFR remained an independent predictor of arterial stiffness in the CKD category.
The limitations of our work are the lack of smoking habits and waist circumference, which prevented from defining the diagnosis of MS. In addition, because this was a large cohort of a self-paid health examination, it was difficult to fully ascertain the subjects’ current medication and underlying diseases, and it might mean that most of them had minimal comorbidity. In respect of BMI, with concerning the World Health Organization criteria of more than 30 being too high for Taiwanese,35 the cut-off point of more than or equal to 25 that we used was from the American college of endocrinology position statement on the insulin resistance syndrome,2 but we are unsure to what extent that this is an appropriate application for Taiwanese. Additionally, since our enrolled subjects were relatively healthy, the number of CKD subjects was far fewer than that of non-CKD. Finally, as this was a cross-sectional but not longitudinal study, we could not completely clarify the long-term causal relationships of arterial stiffness and renal function behind our findings.
In summary, arterial stiffness was negatively correlated with renal function and also increased progressively with the presence of CKD or an increased number of MS-associated risk factors and hs-CRP. The number of MS-associated risk factors and hs-CRP remained a major determinant of arterial stiffness in both CKD and non-CKD. In non-CKD, age, MS-associated risk factors (including BMI, SBP, DBP, fasting glucose, triglyceride, HDL cholesterol), and hs-CRP were independent predictors of arterial stiffness, while in CKD, only eGFR, age, gender, BMI, SBP, DBP, and fasting glucose remained as predictors. The decline of renal function contributes to arterial stiffness only in CKD, but not non-CKD. For non-CKD subjects, the treatments of MS-associated risk factors, including hypertension, hyperglycemia, dyslipidemia, and inflammatory biomarker hs-CRP are potential targets for further interventional studies of arterial stiffness, whereas for CKD subjects, renal function, BP, and glycemic control remain targets.
ACKNOWLEDGMENTS
We thank all the subjects and staff involved in this study for their cooperation. The Chang Gung Memorial Hospital Linkou Medical Center provided grant support for this research. We appreciate Michael Wu's critical reading.
Footnotes
Abbreviations: baPWV = brachial-ankle pulse wave velocity, BMI = body mass index, CKD = chronic kidney disease, DBP = diastolic blood pressure, eGFR = estimated glomerular filtration rate, HDL = high-density lipoprotein, hs-CRPh = igh-sensitivity C-reactive protein, MS = metabolic syndrome, SBP = systolic blood pressure.
The authors have no funding and conflicts of interest to disclose.
REFERENCES
- 1.Beaglehole R. International trends in coronary heart disease mortality, morbidity, and risk factors. Epidemiol Rev 1990; 12:1–15. [DOI] [PubMed] [Google Scholar]
- 2.Einhorn D, Reaven GM, Cobin RH, et al. American College of Endocrinology position statement on the insulin resistance syndrome. Endocr Pract 2003; 9:237–252. [PubMed] [Google Scholar]
- 3.Wilson PW, D’Agostino RB, Parise H, et al. Metabolic syndrome as a precursor of cardiovascular disease and type 2 diabetes mellitus. Circulation 2005; 112:3066–3072. [DOI] [PubMed] [Google Scholar]
- 4.Grundy SM, Cleeman JI, Daniels SR, et al. Diagnosis and management of the metabolic syndrome: an American Heart Association/National Heart, Lung, and Blood Institute Scientific Statement. Circulation 2005; 112:2735–2752. [DOI] [PubMed] [Google Scholar]
- 5.Freeman DJ, Norrie J, Caslake MJ, et al. C-reactive protein is an independent predictor of risk for the development of diabetes in the West of Scotland Coronary Prevention Study. Diabetes 2002; 51:1596–1600. [DOI] [PubMed] [Google Scholar]
- 6.Ridker PM, Rifai N, Rose L, et al. Comparison of C-reactive protein and low-density lipoprotein cholesterol levels in the prediction of first cardiovascular events. New Engl J Med 2002; 347:1557–1565. [DOI] [PubMed] [Google Scholar]
- 7.Cao JJ, Arnold AM, Manolio TA, et al. Association of carotid artery intima-media thickness, plaques, and C-reactive protein with future cardiovascular disease and all-cause mortality: the Cardiovascular Health Study. Circulation 2007; 116:32–38. [DOI] [PubMed] [Google Scholar]
- 8.Suzuki T, Voeks J, Zakai NA, et al. Metabolic syndrome, C-reactive protein, and mortality in U.S. Blacks and Whites: the Reasons for Geographic and Racial Differences in Stroke (REGARDS) study. Diabetes Care 2014; 37:2284–2290. [DOI] [PMC free article] [PubMed] [Google Scholar]
- 9.Johnson DW, Armstrong K, Campbell SB, et al. Metabolic syndrome in severe chronic kidney disease: prevalence, predictors, prognostic significance and effects of risk factor modification. Nephrology 2007; 12:391–398. [DOI] [PubMed] [Google Scholar]
- 10.Chen J, Muntner P, Hamm LL, et al. The metabolic syndrome and chronic kidney disease in U.S. adults. Ann Intern Med 2004; 140:167–174. [DOI] [PubMed] [Google Scholar]
- 11.Sarnak MJ, Levey AS, Schoolwerth AC, et al. Kidney disease as a risk factor for development of cardiovascular disease: a statement from the American Heart Association Councils on Kidney in Cardiovascular Disease, High Blood Pressure Research, Clinical Cardiology, and Epidemiology and Prevention. Circulation 2003; 108:2154–2169. [DOI] [PubMed] [Google Scholar]
- 12.Go AS, Chertow GM, Fan D, et al. Chronic kidney disease and the risks of death, cardiovascular events, and hospitalization. N Engl J Med 2004; 351:1296–1305. [DOI] [PubMed] [Google Scholar]
- 13.Zoccali C. Traditional and emerging cardiovascular and renal risk factors: an epidemiologic perspective. Kidney Int 2006; 70:26–33. [DOI] [PubMed] [Google Scholar]
- 14.Imanishi R, Seto S, Toda G, et al. High brachial-ankle pulse wave velocity is an independent predictor of the presence of coronary artery disease in men. Hypertens Res 2004; 27:71–78. [DOI] [PubMed] [Google Scholar]
- 15.Turin TC, Kita Y, Rumana N, et al. Brachial-ankle pulse wave velocity predicts all-cause mortality in the general population: findings from the Takashima study, Japan. Hypertens Res 2010; 33:922–925. [DOI] [PubMed] [Google Scholar]
- 16.Suzuki E, Kashiwagi A, Nishio Y, et al. Increased arterial wall stiffness limits flow volume in the lower extremities in type 2 diabetic patients. Diabetes Care 2001; 24:2107–2114. [DOI] [PubMed] [Google Scholar]
- 17.Maeda Y, Inoguchi T, Etoh E, et al. Brachial-ankle pulse wave velocity predicts all-cause mortality and cardiovascular events in patients with diabetes: the Kyushu Prevention Study of Atherosclerosis. Diabetes Care 2014; 37:2383–2390. [DOI] [PubMed] [Google Scholar]
- 18.Grundy SM, Brewer HB, Jr, Cleeman JI, et al. Definition of metabolic syndrome: report of the National Heart, Lung, and Blood Institute/American Heart Association conference on scientific issues related to definition. Arterioscler Thromb Vasc Biol 2004; 24:e13–e18. [DOI] [PubMed] [Google Scholar]
- 19.National Kidney Foundation. K/DOQI clinical practice guidelines for chronic kidney disease: evaluation, classification, and stratification. Am J Kidney Dis. 2002;39Suppl 1:S1–S266. [PubMed] [Google Scholar]
- 20.Lilitkarntakul P, Dhaun N, Melville V, et al. Risk factors for metabolic syndrome independently predict arterial stiffness and endothelial dysfunction in patients with chronic kidney disease and minimal comorbidity. Diabetes Care 2012; 35:1774–1780. [DOI] [PMC free article] [PubMed] [Google Scholar]
- 21.Kawamoto R, Kohara K, Tabara Y, et al. An association between decreased estimated glomerular filtration rate and arterial stiffness. Intern Med (Tokyo, Japan) 2008; 47:593–598. [DOI] [PubMed] [Google Scholar]
- 22.Wang M-C, Tsai W-C, Chen J-Y, et al. Stepwise increase in arterial stiffness corresponding with the stages of chronic kidney disease. Am J Kidney Dis 2005; 45:494–501. [DOI] [PubMed] [Google Scholar]
- 23.Ford ML, Tomlinson LA, Chapman TP, et al. Aortic stiffness is independently associated with rate of renal function decline in chronic kidney disease stages 3 and 4. Hypertension 2010; 55:1110–1115. [DOI] [PubMed] [Google Scholar]
- 24.Elias MF, Davey A, Dore GA, et al. Deterioration in renal function is associated with increased arterial stiffness. Am J Hypertens 2014; 27:207–214. [DOI] [PMC free article] [PubMed] [Google Scholar]
- 25.Tomiyama H, Yamashina A, Arai T, et al. Influences of age and gender on results of noninvasive brachial-ankle pulse wave velocity measurement—a survey of 12517 subjects. Atherosclerosis 2003; 166:303–309. [DOI] [PubMed] [Google Scholar]
- 26.Mitchell GF, Guo CY, Benjamin EJ, et al. Cross-sectional correlates of increased aortic stiffness in the community: the Framingham Heart Study. Circulation 2007; 115:2628–2636. [DOI] [PubMed] [Google Scholar]
- 27.Choo J, Shin C, Barinas-Mitchell E, et al. Regional pulse wave velocities and their cardiovascular risk factors among healthy middle-aged men: a cross-sectional population-based study. BMC Cardiovasc Disord 2014; 14:5. [DOI] [PMC free article] [PubMed] [Google Scholar]
- 28.Zebekakis PE, Nawrot T, Thijs L, et al. Obesity is associated with increased arterial stiffness from adolescence until old age. J Hypertens 2005; 23:1839–1846. [DOI] [PubMed] [Google Scholar]
- 29.Haydar AA, Covic A, Colhoun H, et al. Coronary artery calcification and aortic pulse wave velocity in chronic kidney disease patients. Kidney Int 2004; 65:1790–1794. [DOI] [PubMed] [Google Scholar]
- 30.Ueyama K, Miyata M, Kubozono T, et al. Noninvasive indices of arterial stiffness in hemodialysis patients. Hypertens Res 2009; 32:716–720. [DOI] [PubMed] [Google Scholar]
- 31.Lane AD, Wu PT, Kistler B, et al. Arterial stiffness and walk time in patients with end-stage renal disease. Kidney Blood Press Res 2013; 37:142–150. [DOI] [PMC free article] [PubMed] [Google Scholar]
- 32.Blacher J, Safar ME, Pannier B, et al. Prognostic significance of arterial stiffness measurements in end-stage renal disease patients. Curr Opin Nephrol Hypertens 2002; 11:629–634. [DOI] [PubMed] [Google Scholar]
- 33.Blacher J, Guerin AP, Pannier B, et al. Impact of aortic stiffness on survival in end-stage renal disease. Circulation 1999; 99:2434–2439. [DOI] [PubMed] [Google Scholar]
- 34.Sengstock D, Sands RL, Gillespie BW, et al. Dominance of traditional cardiovascular risk factors over renal function in predicting arterial stiffness in subjects with chronic kidney disease. Nephrol Dial Transplant 2010; 25:853–861. [DOI] [PubMed] [Google Scholar]
- 35.Grundy SM, Brewer HB, Jr, Cleeman JI, et al. Definition of metabolic syndrome: report of the National Heart, Lung, and Blood Institute/American Heart Association conference on scientific issues related to definition. Circulation 2004; 109:433–438. [DOI] [PubMed] [Google Scholar]