

Supplemental Digital Content is available in the text
Abstract
The 5-Hydroxymethylcytosine (5-hmC) is an epigenetic modification whose role in the pathogenesis of metabolic-related complex diseases remains unexplored; 5-hmC appears to be prevalent in the mitochondrial genome. The Ten-Eleven-Translocation (TET) family of proteins is responsible for catalyzing the conversion of 5-methylcytosine to 5-hmC. We hypothesized that epigenetic editing by 5-hmC might be a novel mechanism through which nonalcoholic fatty liver disease (NAFLD)-associated molecular traits could be explained.
Hence, we performed an observational study to explore global levels of 5-hmC in fresh liver samples of patients with NAFLD and controls (n = 90) using an enzyme-linked-immunosorbent serologic assay and immunohistochemistry. We also screened for genetic variation in TET 1–3 loci by next generation sequencing to explore its contribution to the disease biology. The study was conducted in 2 stages (discovery and replication) and included 476 participants.
We observed that the amount of 5-hmC in the liver of both NAFLD patients and controls was relatively low (up to 0.1%); a significant association was found with liver mitochondrial DNA copy number (R = 0.50, P = 0.000382) and PPARGC1A-mRNA levels (R = −0.57, P = 0.04).
We did not observe any significant difference in the 5-hmC nuclear immunostaining score between NAFLD patients and controls; nevertheless, we found that patients with NAFLD (0.4 ± 0.5) had significantly lower nonnuclear-5-hmC staining compared with controls (1.8 ± 0.8), means ± standard deviation, P = 0.028. The missense p.Ile1123Met variant (TET1-rs3998860) was significantly associated with serum levels of caspase-generated CK-18 fragment-cell death biomarker in the discovery and replication stage, and the disease severity (odds ratio: 1.47, 95% confidence interval: 1.10–1.97; P = 0.005). The p.Ile1762Val substitution (TET2-rs2454206) was associated with liver PPARGC1A-methylation and transcriptional levels, and Type 2 diabetes.
Our results suggest that 5-hmC might be involved in the pathogenesis of NAFLD by regulating liver mitochondrial biogenesis and PPARGC1A expression. Genetic diversity at TET loci suggests an “epigenetic” regulation of programmed liver-cell death and a TET-mediated fine-tuning of the liver PPARGC1A-transcriptional program.
INTRODUCTION
Nonalcoholic fatty liver disease (NAFLD) is a highly prevalent chronic liver disease1 that is clustered in the metabolic syndrome (MetS) along with other cardiometabolic comorbidities.2–4 In fact, NAFLD is not only a component of the diagnostic criteria for MetS but is critically involved in the development of insulin resistance.5,6
The clinical picture of NAFLD might present in a relatively mild form, characterized by abnormal hepatic triglyceride accumulation, named simple or bland steatosis or nonalcoholic fatty liver (NAFL). However, it might progress to a more severe clinical condition, named nonalcoholic steatohepatitis (NASH), which is characterized by fat accumulation accompanied by liver cell injury, a mixed inflammatory lobular infiltrate, and variable fibrosis.7,8 Notably, NAFL is not necessarily associated with a benign prognosis.9 A recent meta-analysis showed that patients with NAFL could develop liver fibrosis over time.10 In addition, NAFL may seriously increase the probability of exacerbating associated co-morbidities, including cardiovascular disease.11
Like many other complex diseases, NAFLD is under both genetic and environmental influences.12 Recent evidence from human studies indicates presence of tissue-specific epigenetic modifications in both nuclear6,13,14 and mitochondrial (mt) genome.15 These are involved not only in NAFLD pathogenesis and histological disease progression but are relevant to the pathophysiology of the MetS-associated phenotypes.6,15 Furthermore, there is compelling evidence showing that mitochondrial function,15–19 and mitochondrial DNA (mtDNA) copy number are both diminished in NAFLD.6 Notably, the aforementioned molecular changes are not only determinants of the disease prognosis and severity6,14,15,20 and even the potential development of liver cancer14 but are also critical modifiers of disease-associated metabolic traits.6,15 In fact, we previously demonstrated that epigenetic modifications occurring in the liver of patients with NAFLD, such as methylation of target sites (dinucleotides CpG) in the promoter of the peroxisome proliferator-activated receptor gamma coactivator 1α (PPARGC1A, a master transcription factor involved in liver-related metabolic pathways, including mitochondrial biogenesis and fatty acid oxidation, gluconeogenesis, and lipogenesis) adversely affect peripheral insulin sensitivity.6 Finally, we and others have previously shown that liver epigenetic changes are not necessarily stable but subject to reversion.13,15
The 5-hydroxymethylcytosine (5-hmC) is an old,21 but recently rediscovered and understood epigenetic modification that modulates gene transcription by influencing putative DNA demethylation and chromatin structure remodelling.22 Interestingly, 5-hmC profile seems to be tissue-specific23 and is highly dependent on the cellular state, resulting in changes in response to environmental stimuli and metabolic perturbations.24 Non-CG hydroxymethylation appears to be prevalent in the mitochondrial genome as well.25,26
The Ten-Eleven-Translocation (TET1, TET2, and TET3) family of proteins, which share significant sequence homology at their C-terminal catalytic domains, were recently identified as 5 mC hydrolases that catalyze the conversion of 5-mC to 5-hmC.27 These proteins, which frequently mutate in cancer, are involved in programmed cell death in neurons.28 However, whether this effect could be observed in hepatocytes remains unknown.
Because NAFLD is associated with altered DNA methylation profiles, changes in mtDNA content and PPARGC1A expression, we hypothesized that epigenetic editing by 5-hmC might be a novel mechanism through which the NAFLD-associated molecular traits could be explained. Hence, we explored the global levels of 5-hmC in the liver of patients with NAFLD at different stages of disease severity and controls. In addition, we screened for genetic variation in TET 1–3 loci by targeted next generation sequencing (NGS) to explore its contribution to the disease biology.
PATIENTS AND METHODS
Study Design and Patient Selection
This study was conducted in 3 phases: an initial study that included exploration of global levels of 5-hmC in the liver of patients with NAFLD (n = 67) and control subjects (n = 23); screening of genetic variation of TET1, TET2, and TET3 by targeted NGS in a discovery group of 96 individuals (64 NAFLD patients and 32 controls); and independent replication of selected single nucleotide polymorphisms (SNPs) in a case–control association study (n = 380 participants).
Patients were included in the study if there was histopathological evidence of NAFLD, either NAFL or NASH, based on a liver biopsy (LB) conducted within the study period. Exclusion criteria were secondary causes of steatosis, including alcohol abuse (≥30 g alcohol daily for men and ≥20 g for women), total parenteral nutrition, hepatitis B and hepatitis C virus infection, and the use of drugs known to precipitate steatosis. By using standard clinical and laboratory evaluation, as well as LB features when applicable, autoimmune liver disease, metabolic liver disease, Wilson's disease, and α-1-antitrypsin deficiency were likewise ruled out in all patients.
Healthy subjects were selected for inclusion into the control group if their age and sex matched those of the NAFLD patients and in whom, in addition to the standard health assessment described below, a careful ultrasonographic (US) examination of the liver was performed to exclude fatty liver infiltration. In addition, controls were included at any study phase if they did not exhibit features of MetS and did not have fatty liver at liver US.
For obvious ethical reasons, the control subjects were not exposed to the potential risk of an LB; hence, in explorations that involved molecular studies requiring fresh liver tissue, patients with near-normal liver histology (NNLH) were included. In the NNLH subjects, LB was justified owing to the presence of persistently mildly elevated serum activity of liver enzymes. In all NNLH subjects, all causes of common liver disease were ruled out, and these patients were included in the study if they did not present either histological evidence of fatty change or necrotic-inflammatory activity, and had either minimal changes or mild cholestasis as histological diagnosis.
The case participants and the controls were selected during the same study period from the same population of patients attending the liver unit, and all shared the same demographic characteristics.
Ethics, Consent, and Permissions
Human serum and DNA samples from healthy individuals and those diagnosed with NAFLD, as well as liver biopsies from all the patients, were obtained with written informed consent following Institutional Review Board-approved protocols (protocol number: 104/HGAZ/09, 89/100, and 1204/2012, Comite de Bioetica Hospital Abel Zubizarreta). All the investigations performed in this study were conducted in accordance with the guidelines of the 1975 Declaration of Helsinki.
Physical, Anthropometric, and Biochemical Evaluation
Health examinations included anthropometric measurements, a questionnaire on health-related behaviors, and biochemical determinations.
Caspase-generated CK-18 fragment (CK-18)—a noninvasive quantification of hepatocellular apoptosis29—concentration was measured by the 1-step in vitro immunoassay M30-apoptosense enzyme-linked-immunosorbent serologic assay (ELISA) kit (PEVIVA AB; DiaPharma, OH) that selectively recognizes the caspase-generated fragments of keratin 18 containing the K18Asp396 neoepitope (CK-18).
Anthropometric measurements and blood samples were obtained from each patient at the time of LB or DNA sample collection, and before any intervention. Complete details are provided in the Supplemental Content, http://links.lww.com/MD/A400.
Liver Biopsy and Histopathological Evaluation
LB was performed before any intervention with ultrasound guidance and a modified 1.4 mm-diameter Menghini needle (Hepafix, Braun, Germany) under local anesthesia, in the outpatient setting. A portion of each LB specimen was routinely fixed in 40 g/L formaldehyde (pH 7.4) embedded in paraffin before being stained with hematoxylin and eosin, Masson trichrome, and silver impregnation for reticular fibers. All the biopsies were at least 3 cm in length and contained a minimum of 8 portal tracts. The liver biopsies were read by a single experienced hepatopathologist, who was blinded to all the clinical and laboratory data. The degree of steatosis was assessed according to the system developed by Kleiner et al.30 NASH was defined as steatosis, accompanied by mixed inflammatory-cell infiltration, hepatocyte ballooning and necrosis, glycogen nuclei, Mallory's hyaline, and any stage of fibrosis, including absent fibrosis.31 Complete details are provided in the Supplemental Content, http://links.lww.com/MD/A400.
Liver Immunohistochemistry
Immunostaining for TET1 protein and 5-hmC was performed on liver specimens previously obtained from NAFLD patients and controls and included in paraffin before use. Complete details are provided in the Supplemental Content, http://links.lww.com/MD/A400.
Electron Microscopy of the Liver Tissue
Electron microscopy (EM) studies were performed on liver specimens by immersion of a small sample (1 mm) in 2.5% glutaraldehyde and 0.1 M phosphate buffer (pH 7.4). Sections were mounted in copper grids, counterstained with lead citrate, and observed in a transmission electronic microscope (Carl Zeiss, Carl-Zeiss-Straße 56, 73447 Oberkochen, Germany). Further details are provided in extant literature.15
RNA Preparation and Real-Time RT-PCR for Quantitative Assessment of mRNA Expression and Bisulfite Treatment of DNA for Methylation-Specific PCR
Total RNA was prepared from liver tissue using phenol extraction step method, with an additional DNAse digestion. Genomic DNA was isolated from liver biopsies at the same time as RNA by standard methods, and DNA bisulfite modification was performed as previously reported.6 Complete details are provided in the Supplemental Content, http://links.lww.com/MD/A400, which includes details on reverse transcription polymerase chain reaction (RT-PCR), data normalization, and the primer sequences.
Global Liver 5-hmC Quantification
We measured global 5-hmC levels in the DNA isolated from fresh liver specimens of patients and controls using Quest 5-hmC DNA ELISA Kit (Zymo Research, Irvine, CA) according to the manufacturer's instructions. This system is highly sensitive to 5-hmC DNA and has a detection threshold of 0.02% per 100 ng input DNA. In brief, 5-hmC was detected using a sandwich-based ELISA kit that includes a control DNA set, which was calibrated to accurately quantify the percent 5-hmC in sample DNA by a standard curve. All samples were measured in triplicate, allowing us to estimate the mean % 5-hmC level. The % 5-hmC levels were not normally distributed and were thus log-transformed for statistical analyses.
Characterization of Genetic Variation in TET 1–3 by NGS
NGS technology was employed to search for the presence of genetic variation in TET1–3 loci covering all protein-coding exons (TET1: 9.7 kb, 12 exons, TET2: 19 kb, 13 exons, and TET3: 11 kb, 9 exons), in addition to exon–intron boundaries and 5′ and 3′ UTR regions, which were examined by semiconductor technology offered in the Ion Torrent PGM system (IT-PGM) (Life Technologies, Carlsbad, CA) using a 316 chip. All reagents were obtained from the same provider. Complete details are provided in the Supplemental Content, http://links.lww.com/MD/A400.
Variant Calling, Estimation of Quality Control, Data Analysis, and Prediction of Variant/Mutation Effect
Complete details are provided in the Supplemental Content, http://links.lww.com/MD/A400.
Replication Study: Genotype and Association Analysis, Power and Sample Size Calculation, and Population Stratification
The genetic analyses were performed on genomic DNA extracted from white blood cells. Genotyping of the TET1-rs3998860 (p.Ile1123Met) and TET2-rs2454206 (p.Ile1762Val) was performed using a TaqMan genotyping assay (dbSNP rs3998860 assay C_2719530_10 and dbSNP rs2454206 assay C_11566753_20; Applied Biosystems, Carlsbad, CA) according to the manufacturer's instructions.
Using the CaTS power calculator for genetic association studies32 and assuming a prevalence of NAFLD of 0.30, an minor allele frequency of ∼0.3, and a relative risk of ∼2, our sample had 100% power for the additive genetic model and 98% for the dominant 1. Complete details are provided in the Supplemental Content, http://links.lww.com/MD/A400.
Quantification of Liver mtDNA Copy Number
An assay based on real-time quantitative PCR was used for both nuclear DNA (nDNA) and mtDNA quantification using SYBR Green as a fluorescent dye (Invitrogen, Carlsbad, CA 92008, USA) as previously described.6 Primer sequences are shown in Supplemental Content, http://links.lww.com/MD/A400, along with further details on quantification of liver mtDNA copy number.
Statistical Analysis
Quantitative data were expressed as mean ± standard deviation (SD) unless otherwise indicated. Because significant differences in variance were observed between the groups in most of the variables and the distribution was significantly skewed in most cases, we chose to be conservative and assessed the differences between the groups by using nonparametric Mann–Whitney U or Kruskal–Wallis tests. As indicated, in some comparisons, log-transformed variables were compared by analysis of variance and Neuman–Keuls test for mean differences, as in the case of liver 5-hmC levels, liver methylation and mRNA expression of PPARGC1A, and serum CK-18 levels. Univariate correlations were obtained via the Spearman's rank correlation test. For association tests between genotypes or allele frequencies and phenotypes, such as liver disease and Type 2 diabetes, Cochran–Armitage test for trend, or logistic regression were employed.
The CSS/Statistica program package version 6.0 (StatSoft, Tulsa, OK) was employed in the aforementioned analyses.
RESULTS
Clinical and biochemical features of the entire population in each of the study phases are shown in Tables 1–3. Overall, patients with NAFLD had all the features of the MetS, including abdominal obesity, insulin resistance, hypertriglyceridemia, and arterial hypertension.
TABLE 1.
Clinical and Biochemical Characteristics of Subjects With Near Normal Liver Histology (NNLH) and Patients With NAFLD Included in the Exploration of Liver Global Levels of DNA 5-Hydroxymethylation
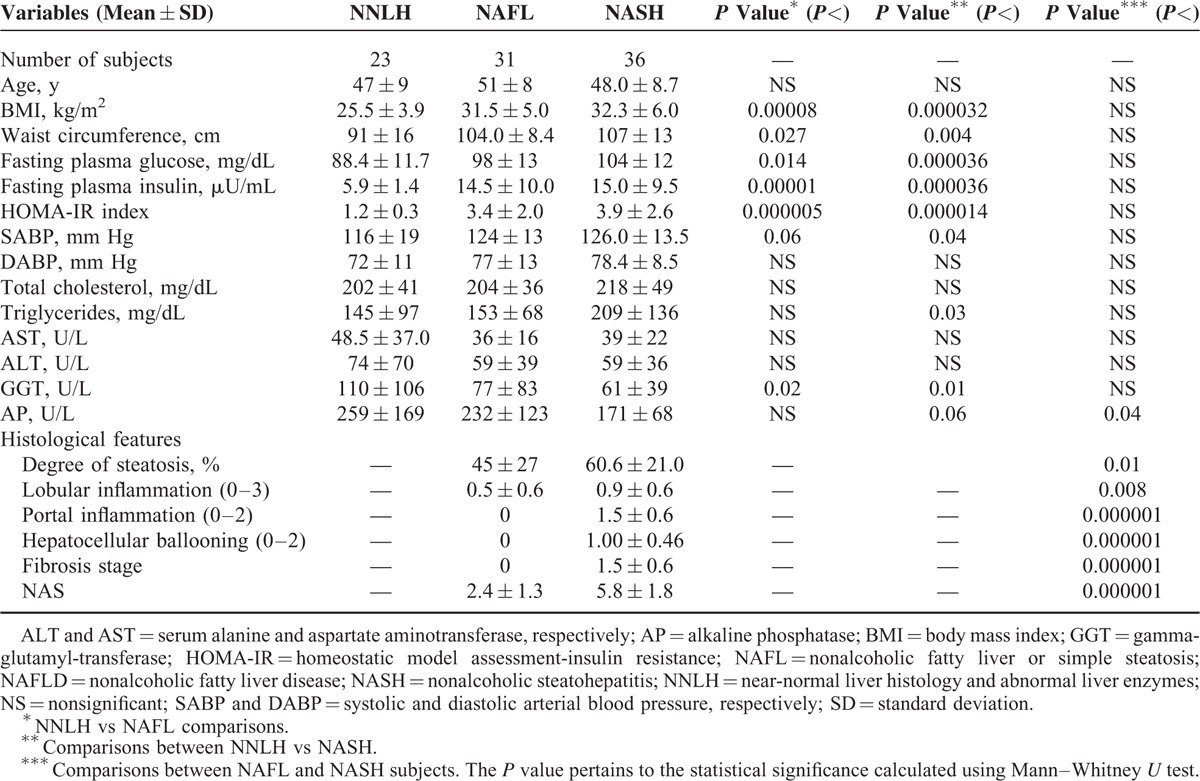
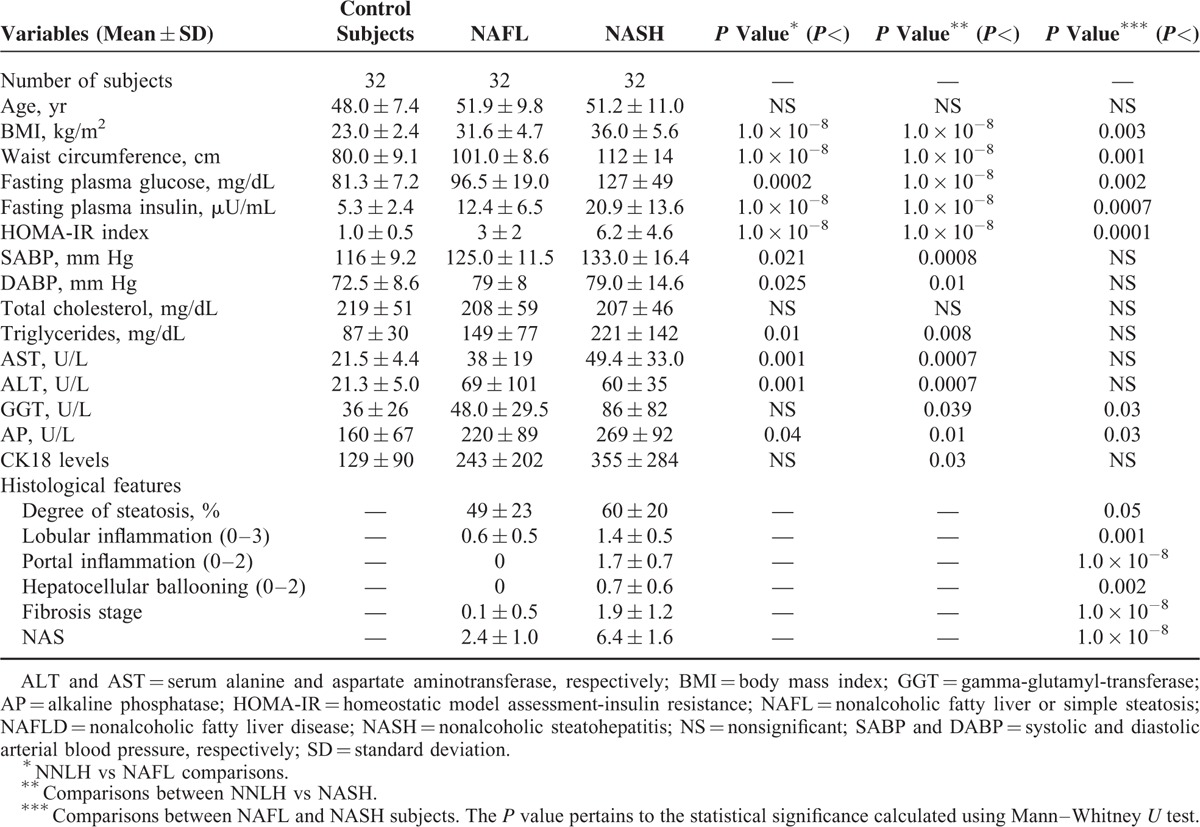
TABLE 3.
Clinical and Biochemical Characteristics of Control Subjects and Patients With NAFLD in the Independent Replication Study of the Exploration of TET 1–3 Genetic Variation

TABLE 2.
Clinical and Biochemical Characteristics of Control Subjects and Patients With NAFLD Included in the Discovery Group of the Exploration of TET 1–3 Genetic Variation by Next Generation Sequencing
Global Liver DNA Hydroxymethylation Levels Are Significantly Associated With Liver mtDNA Content and the Abundance of PPARGC1A-mRNA
First, we explored the association between liver 5-hmC levels and NAFLD as a disease trait. The findings revealed no differences in the overall mean levels of global DNA hydroxymethylation in subjects with NNLH (0.100 ± 0.016) and patients with NAFLD (0.095 ± 0.034), P = NS. The overall median (interquartile range, IQR) levels of global DNA hydroxymethylation were 0.101% (IQR: 0.035) and 0.094% (IQR: 0.052) for subjects with NNLH and NAFLD, respectively.
The analysis of global liver 5-hmC levels and NAFLD disease severity did not show significant differences either (NAFL: 0.090 ± 0.035% vs NASH: 0.100 ± 0.032%, mean, SD, P = NS), and the same conclusion was reached for liver fibrosis (F0–F1: 0.10 ± 0.032% vs F2–F4: 0.094 ± 0.034%, P = NS).
To explore the localization pattern of 5-hmC, we further evaluated the liver specimens (stained by immunohistochemistry [IHQ], by a specific antibody) of NAFLD patients and subjects with NNLH. While the immunoreactivity product of 5-hmC was preferentially localized in the nucleus of hepatocytes in both controls and NAFLD patients, with no significant differences in staining intensity, there were remarkable differences in both the pattern of nonnuclear localization and the immunostaining counts. The immunoreactivity product of 5-hmC in subjects with NNLH was randomly located in nonnuclear (cytoplasmic) areas of hepatocytes, showing a granular pattern. Conversely, in patients with NAFLD, 5-hmC was preferentially localized at the edge of lipid-laden hepatocytes (Figure 1). Notably, liver specimens of patients with NAFLD were examined by EM and showed mitochondria in close physical association with large lipid droplets (Figure 1)—a finding that supports a putative localization of the nonnuclear immunoreactivity product of 5-hmC in mtDNA. Further analysis on nonnuclear immunostaining scores showed significant differences between patients with NAFLD (0.4 ± 0.5) and controls (1.8 ± 0.8), P = 0.028.
FIGURE 1.
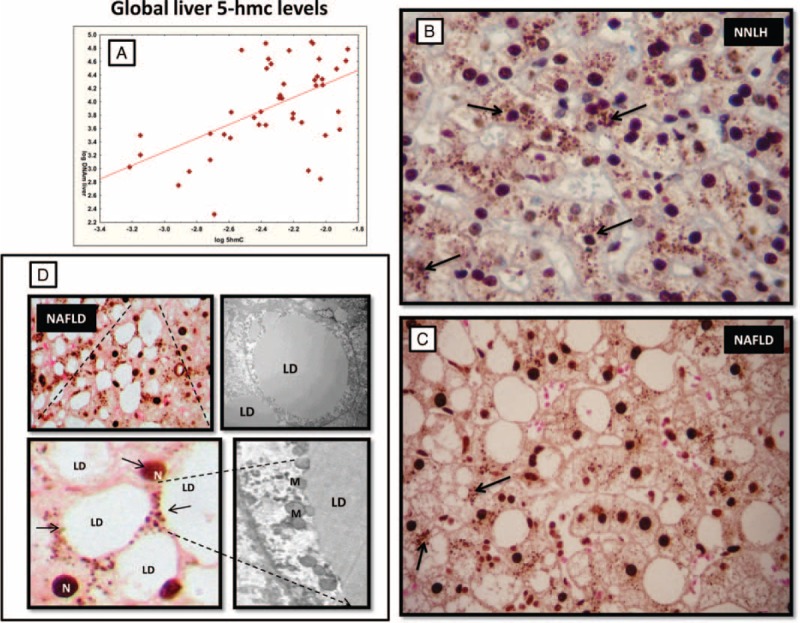
Global levels of 5-hydroxymethylcytosine (5-hmC) in the liver tissue of patients with NAFLD and near normal liver histology (NNLH). A: Correlation between log-transformed liver mtDNA/nDNA ratio and log-transformed global liver 5-hmC levels measured by a sandwich-based enzyme-linked immunosorbent assay employing an anti-5-hydroxymethylcytosine polyclonal antibody. B and C: A representative specimen of immunostaining for 5-hmC in the liver of a patient with NNLH and NAFLD, respectively. Arrows indicate nonnuclear areas of 5-hmC staining. D: Magnification shows 5-hmC preferentially localized at the edge of lipid-laden hepatocytes; N = nucleus. Representative electron micrograph of hepatocyte isolated from an NASH patient showing a lipid droplet (LD) and mitochondria (M) in close physical association with LDs. Magnification: ×3000. 5-hmC immunoreactivity was examined using light microscopy of liver sections, while counterstaining was performed with eosin. Original magnification: ×400. NAFLD = nonalcoholic fatty liver disease.
We next examined crude linear trends in the association of global liver DNA hydroxymethylation with continuous phenotypic variables, including age, body mass index (BMI), percent body fat, waist circumference, homeostatic model assessment-insulin resistance (HOMA-IR), and ALT and AST (serum alanine and aspartate aminotransferase, respectively) liver enzyme levels, as well as continuous molecular traits of interest associated with NAFLD, including expression levels of PPARGC1A-mRNA and liver mtDNA copy number. Of note, we found a positive and significant correlation between liver 5-hmC levels and liver mtDNA content (Spearman R = 0.50, P = 0.000382) (Figure 1), and an inverse and significant association with the abundance of liver PPARGC1A-mRNA (Spearman R = −0.57, P = 0.04). As previously reported,6 patients with NAFLD have a significantly lower liver mtDNA copy number, expressed as an mtDNA/nDNA ratio (62.5 ± 41.0), in comparison with subjects with NNLH (103.5 ± 88.0).
In addition, a significant and inverse correlation of liver 5-hmC levels was found with ALT (Spearman R = −0.24, P = 0.02) and AST (Spearman R = −0.28, P = 0.01) serum levels, and BMI (Spearman R = −0.27, P = 0.01).
Analysis of Missense Variation in TET1 and TET2 Loci Shows Association With NAFLD-Disease Biology and Type 2 Diabetes
TET proteins play a significant role in the generation of 5-hmC; in fact, these enzymes mediate the conversion of 5-mC to 5-hmC utilizing oxygen and 2-ketoglutarate as substrates.
To understand the potential contribution of genetic variation in TET1–3 loci in NAFLD-associated molecular traits, including changes in promoter methylation levels of PPARGC1α, we followed an NGS approach, which was applied to all the exons, exon–intron unions and 5′ and 3′ untranslated regions of these genes. Furthermore, based on the previous knowledge of TET-mutations are able to mediate cell death,28 we explored the role of variants on surrogate markers of hepatocellular apoptosis (release of caspase-cleaved cytokeratin-18, CK-18)29 and the disease severity.
In the exploratory study, we generated more than 2 million reads with an average length of 145 bases of quality equal to or exceeding Q20, and a coverage on average higher than 100×. Overall, analysis of sequence data yielded 28 SNPs in TET1 gene, 37 in TET2, and 24 in TET3; according to the information pertaining to the dbSNP or the 1000 genomes, among these, 23 were novel variants.
Information of genetic variation took precedence over nonsynonymous SNPs (those that change the amino acid sequence). Distribution of the variants’ function is depicted in the Supplemental Content, http://links.lww.com/MD/A400. As can be seen, a high percentage of genetic variation of TET1 (35.5%) and TET2 (27%) were missense variants. The main features of variants selected for the replication study, including chromosome location and predicted functional consequences, are shown in Supplemental Content, http://links.lww.com/MD/A400.
The association analysis in the exploratory study showed that TET1-rs3998860 (p.Ile1123Met) was significantly associated with serum levels of CK-18 (P = 0.003; Figure 2). Replication analysis performed on the larger validation set confirmed the initial findings, indicating that hepatocytes of NAFLD patients who are homozygous for the G allele are more susceptible to apoptosis compared with carriers of the ancestral A allele (P = 0.001). Accordingly, an allelic test showed that the variant was significantly associated with the disease severity (Cochran–Armitage test for trend P = 0.005); generalized odds ratio (OR): 1.47, 95% confidence interval (CI): 1.10 to 1.97 for G vs A allele as a reference. Genotype distribution was in Hardy–Weinberg equilibrium (P = 0.49).
FIGURE 2.
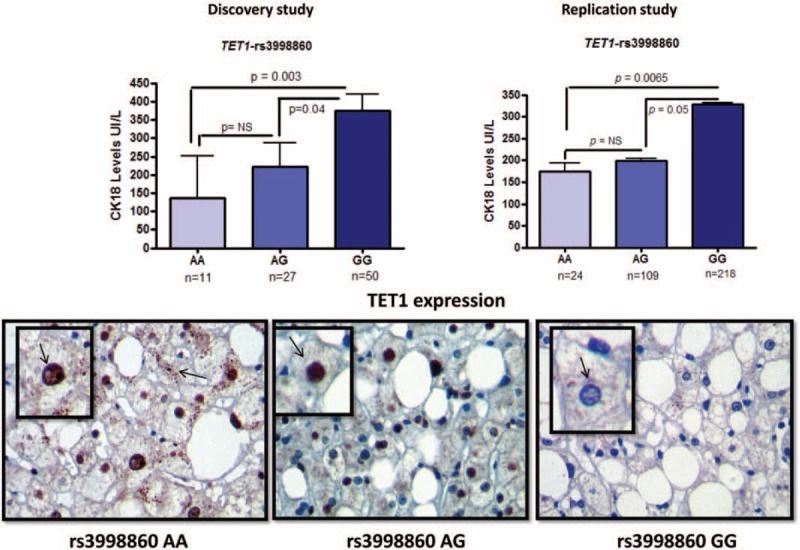
Association analysis of TET1-rs3998860 (p.Ile1123Met) and serum CK-18 levels. Upper panels: Results of the association analysis of rs3998860 and serum CK-18 cell death biomarker levels in the discovery and replication stage, left and right, respectively; caspase-mediated cleavage of the CK-18 reflects degradation of the intracellular cytoskeleton when cells undergo apoptosis. Each bar represents the mean ± standard error value. P values pertain to log-transformed serum CK-18 levels, analyzed by analysis of variance. Lower panels: Representative specimens of immunostaining for liver TET1 protein expression evaluated by immunohistochemistry, according to TET1-rs3998860 genotypes. Counterstaining was performed using hematoxylin. Original magnification: ×400.
To gain insights into the putative mechanisms by which this variant might influence the disease phenotype, we next used IHQ to explore the level of liver TET1 expression according to rs3998860 genotypes. We observed that TET1 immunoreactivity product significantly (P = 0.036) increased in subjects carrying at least 1 copy of the A allele (AA and AG), in comparison with carriers of the rs3998860-GG genotype (Figure 2).
On the other hand, we aimed to analyze whether genetic variation in TET1–3 loci plays any role in the modulation of liver PPARGC1α transcriptional activity. The association analysis of sequence variation in the exploratory study showed that p.Ile1762Val substitution (TET2-rs2454206), located in exon 11, was significantly associated with the liver promoter methylation status of PPARGC1α (methylated DNA/unmethylated DNA ratio: AA: 0.61 ± 0.1 vs AG + GG: 1.6 ± 0.4, mean ± SD, P = 0.03 on log transformed values), indicating that G allele carriers have higher levels of promoter methylation compared with homozygous AA.
To further assess whether this variant has any effect on liver gene expression of PPARGC1α, we explored the abundance of the transcript according to the variant genotypes in a sub-sample of the replication set that had available isolated liver mRNA (n = 66). In line with the findings observed in the discovery stage, we found that rs2454206 was significantly associated with the relative abundance of liver PPARGC1α-mRNA in both the dominant (P = 0.005) and additive (P = 0.018) model of inheritance (Figure 3), suggesting that carriers of the G allele have decreased liver expression of PPARGC1α. Collectively, our findings suggest that the p.Ile1762Val substitution would be involved in the modulation of liver PPARGC1α methylation profile, thereby regulating gene transcription.
FIGURE 3.
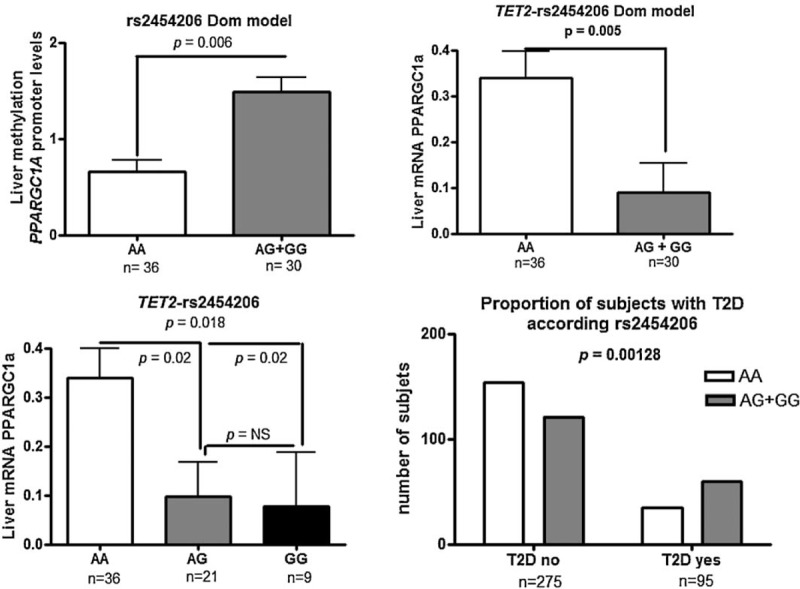
Association analysis of TET2-rs2454206 (p.Ile1762Val) and liver methylation and the transcriptional status of the coactivator PPARGC1A (peroxisome proliferator-activated receptor gamma coactivator 1α). Upper panel: Methylated DNA/unmethylated DNA ratio for the liver PPARGC1A promoter according to rs2454206 and liver abundance of PPARGC1A mRNA evaluated by quantitative real-time PCR genotypes in the dominant model of inheritance. Bottom panel: Liver abundance of PPARGC1A mRNA evaluated by quantitative real-time PCR according to rs2454206 genotypes in the additive model of inheritance, and the distribution of the variant genotypes according to the presence or absence of Type 2 diabetes in the entire replication set. Each bar represents the mean ± standard error value. In each sample, the abundance of target genes was normalized to the amount of cyclophilin to carry out comparisons between the groups. P values apply to log-transformed values of liver PPARGC1A promoter methylation and mRNA levels. PCR = polymerase chain reaction.
To gain insights into possible clinical implications of this finding, and based on previous knowledge showing that liver expression of PPARGC1α modulates insulin resistance,6 we explored the association between the variant and the presence of Type 2 diabetes in the entire replication set. Notably, we observed a significant association between the rs2454206 and Type 2 diabetes, chi-square 10.37, P = 0.00128 (OR 1.60 per G allele, 95% CI: 1.01–2.51; Figure 3). The genotype distribution was in Hardy–Weinberg equilibrium (P = 0.91).
DISCUSSION
Epigenetic modifications, including changes in the DNA methylation/demethylation rate, are involved in the pathogenesis of complex diseases, including NAFLD. It is known that tissue levels of 5-hmC are variable, and are higher in embryonic pluripotent stem cells and cells of neuronal lineages, compared to adult tissue.33–35 In addition, high 5-hmC levels are a feature of rapidly proliferating cell populations. Nevertheless, 5-hmC level in the liver of patients with NAFLD presently remains unknown.
In this study, we aimed to explore global levels of 5-hmC in the liver of patients with NAFLD at different stages of disease severity, aiming to better understand its role in the disease biology. In agreement with a recent study, whereby the authors measured global 5-hmC levels in nonneoplastic liver tissue of patients with hepatocelular carcinoma,36 the amount of 5-hmC in the liver of patients with NAFLD, as well as in the liver of subjects with NNLH, was relatively low (up to 0.1%). These findings were confirmed by immunohistostaining of liver sections with specific anti-5hmC antibody.
Furthermore, while no differences in the global level of liver 5-hmC between patients and controls were observed, a significant association was found with molecular traits of interest, suggesting the possibility of an involvement of hydroxylation of mC in the development of NAFLD. For instance, we could demonstrate a significant association between liver 5-hmC and liver mtDNA copy number. Previous work in which the authors used mtDNA immunoprecipitation by an antibody directed against 5-hmC supports our findings, showing substantial 5-hmC levels in the mtDNA.25,26 It is noteworthy to highlight that a major limitation of all current methodologies that measure global DNA hydroxymethylation stems from their inability to provide information on whether 5-hmC occurs in the nuclear or mt genome. Moreover, none provides information about locus localization in the genome. Nevertheless, we were able to show that oxidation of mC to hmC is a process that occurs not only in the nucleus of liver cells but outside them. In fact, the cytosolic localization of liver 5-hmC by immunostaining strongly suggests mitochondrial localization as extrachromosomal DNA, which is any DNA that is found outside of the nucleus of a cell, corresponds exclusively to mtDNA. While our immunohistochemical analysis revealed no differences in the nuclear 5-hmC staining scores between patients with NAFLD and controls, we observed that NAFLD was associated with a significant decrease of nonnuclear 5-hmC suggesting that mtDNA has different hydroxymethylation levels according to the disease status.
It is currently unknown whether members of the TET family are able to target liver mtDNA, as in vitro explorations in HeLa and 3T3-L1 cells found TET1 and TET2, or only TET1, respectively, in the mitochondrial fraction, suggesting that the TET-mtDNA interaction is very much cell-type dependent.26 Thus, we cannot rule out the possibility of an interaction between 5-hmC and liver mtDNA involving a large regulatory network, including genes that regulate mitochondrial biogenesis, replication and transcription. The significant association between liver levels of 5-hmC and liver mtDNA content allows us to hypothesize that epigenetic editing by hydroxymethylation is involved in the regulation of liver mtDNA copy number. Hydroxymethylated cytosines within the human mtDNA control region (D-loop), as demonstrated in previous work,26 strongly support the biological plausibility of our findings.
In addition, we observed that global 5-hmC levels in the liver were negatively associated with the abundance of liver PPARGC1A-mRNA. This finding suggests that the balance between hypomethylation and hypermethylation in this locus modulates its transcriptional activity, as we previously reported by exploring targeted regions of the gene promoter.6 In fact, the capacity to convert 5-mC into 5-hmC is very much influenced by the initial amount of 5-mC, which was shown to be higher in the liver of NAFLD patients.6
On the other hand, we observed that a missense p.Ile1123Met variant located in TET methylcytosine dioxygenase 1 (rs3998860) was significantly associated with serum levels of the CK-18 cell death biomarker. In addition, empirical evidence indicated that caspase-mediated cleavage of the keratin 18 reflects degradation of the intracellular cytoskeleton when cells undergo apoptosis.37 This finding was replicated in the validation sample, in which the rs3998860-G allele was significantly associated with the disease severity, suggesting an involvement of TET1 locus in the modulation of apoptosis and liver injury in NAFLD. Exploration of a putative functional role of rs3998860 revealed that immunostaining scores of liver TET1 were significantly reduced in homozygous carriers of the G allele. While previous evidence indicated that the effects of TET1 overexpression on gene transcription are unrelated to its 5-mC dioxygenase function33 TET1-mediated DNA demethylation provides protection against oxidative stress in neuronal cells.28 In effect, knockdown of tet1 in cerebellar granule cells in mice significantly increases apoptosis by promoting neuronal cell death induced by oxidative stress.28
Finally, we observed that the p.Ile1762Val substitution (TET2-rs2454206) was significantly associated with liver PPARGC1A methylation and transcriptional levels. This finding suggests that the TET2 locus might be involved in the modulation of the liver PPARGC1A methylation/demethylation balance, putatively in response to the metabolic cellular environment. More importantly, this molecular trait would influence the development of Type 2 diabetes, suggesting new avenues in the understanding of the genetic susceptibility to diseases that cluster in the metabolic syndrome.
Of note, we were not able to find any significant association between global liver 5-hmC levels and genetic variation in TET-locus; neither we were able to find an association between TET-variants and mtDNA copy number. Nevertheless, previous evidence suggest that the dynamics of DNA methylation/demethylation is governed by a complex interaction of proteins, including isocitrate dehydrogenases (IDHs) that catalyze the oxidative decarboxylation of isocitrate to 2-oxoglutarate, which is a substrate of TET proteins.38 For instance, it was recently reported that the expression levels of both IDH1 and IDH2 regulate the total 5-hmC content in the adult liver.38 Furthermore, as explained before, it cannot be ascertained whether mitochondrial 5-hmC is a product of the same enzymatic reaction that takes place in the nucleus, as there is not conclusive evidence of the expression of TET proteins in the mitochondria. Hence, further research is required to guarantee a deep understanding of the regulatory mechanisms by which 5-hmC levels are modulated in NAFLD, and so, what are the mechanisms by which this epigenetic modification regulates gene expression. Remarkably, IDH-proteins localize to the mitochondrial matrix and have activity as NADP-dependent IDH either cytosolic or peroxisomal; the later of particular significance as NAFLD severity is associated with peroxisome proliferation.15
In conclusion, our data provide evidence of the involvement of 5-hmC in the modulation of NAFLD phenotype by regulating liver mitochondrial biogenesis and the transcriptional activity of the co-activator PPARGC1A. In addition, our findings revealed a putative role of TET1-p.Ile1123Met-mediated regulation of hepatocyte apoptosis, suggesting the possibility of an “epigenetic” regulation of programmed liver-cell death. Using sequencing and replicated data, we also identified signatures of TET2-p.Ile1762Val-mediated regulation of liver PPARGC1A expression.
Taken together, our findings might contribute as a proof-of-concept study to the understanding of the role of DNA-hydroxymethylation and TET proteins in the molecular tissue-specific quantitative phenotypes associated with NAFLD pathogenesis and disease severity. To our knowledge, this is the first report of the influence of liver 5-hmC and TET-mediated genetic susceptibility of nonmalignant complex diseases. Our results suggest the importance of early intervention once NAFLD is suspected/detected, as epigenetic modifications are potentially reversible and the altered “liver epigenome” can be reversed.13,15 Emerging hypotheses remain to be explained by the use of novel technologies, including high-resolution mapping of 5-hmC regions in the mitochondrial genome and sequencing of additional candidate genes that regulate the liver methylome.
Footnotes
Abbreviations: 5-hmC = 5-hydroxymethylcytosine, CK-18 = caspase-generated CK-18 fragment, mtDNA = mitochondrial DNA, NAFLD = nonalcoholic fatty liver disease, nDNA = nuclear DNA, NGS = next generation sequencing, NNLH = near-normal liver histology, PPARGC1A = peroxisome proliferator-activated receptor gamma coactivator 1α, TET = Ten-Eleven-Translocation.
CJP and SS—co-senior authors.
Author contributions: CJP: study concept and design; data acquisition; data analysis and interpretation; statistical analysis; drafting of the manuscript; securing funding; general study; and NGS supervision. GOC: performed liver biopsies and collected biological samples. RS: performed gene expression analysis and genotyping. TFG: performed NGS. HD and CR: the NGS data analysis. JSM: performed histopathological evaluation and IHQ. SS: study concept and design; data acquisition; performed liver biopsies and collected biological material; data analysis and interpretation; drafting of the manuscript; securing funding; and study supervision. CJP, RS, HD, CR, and SS belong to the National Scientific and Technical Research Council (CONICET).
Funding: This study was partially supported by grants PICT 2010-0441 (Dr Carlos Pirola) and PICT 2012-0159 (Dr Silvia Sookoian) (Agencia Nacional de Promoción Científica y Tecnológica).
The authors have no conflicts of interest to disclose.
Supplemental digital content is available for this article. Direct URL citations appear in the printed text and are provided in the HTML and PDF versions of this article on the journal's Website (www.md-journal.com).
REFERENCES
- 1.Loomba R, Sanyal AJ. The global NAFLD epidemic. Nat Rev Gastroenterol Hepatol 2013; 10:686–690. [DOI] [PubMed] [Google Scholar]
- 2.Sookoian S, Pirola CJ. Non-alcoholic fatty liver disease is strongly associated with carotid atherosclerosis: a systematic review. J Hepatol 2008; 49:600–607. [DOI] [PubMed] [Google Scholar]
- 3.Targher G, Day CP, Bonora E. Risk of cardiovascular disease in patients with nonalcoholic fatty liver disease. N Engl J Med 2010; 363:1341–1350. [DOI] [PubMed] [Google Scholar]
- 4.Targher G, Byrne CD. Clinical review: nonalcoholic fatty liver disease: a novel cardiometabolic risk factor for type 2 diabetes and its complications. J Clin Endocrinol Metab 2013; 98:483–495. [DOI] [PubMed] [Google Scholar]
- 5.Tarantino G, Finelli C. What about non-alcoholic fatty liver disease as a new criterion to define metabolic syndrome? World J Gastroenterol 2013; 19:3375–3384. [DOI] [PMC free article] [PubMed] [Google Scholar]
- 6.Sookoian S, Rosselli MS, Gemma C, et al. Epigenetic regulation of insulin resistance in nonalcoholic fatty liver disease: impact of liver methylation of the peroxisome proliferator-activated receptor gamma coactivator 1alpha promoter. Hepatology 2010; 52:1992–2000. [DOI] [PubMed] [Google Scholar]
- 7.Brunt EM. Pathology of fatty liver disease. Mod Pathol 2007; 20 Suppl 1:S40–S48. [DOI] [PubMed] [Google Scholar]
- 8.Brunt EM. Histopathology of non-alcoholic fatty liver disease. Clin Liver Dis 2009; 13:533–544. [DOI] [PubMed] [Google Scholar]
- 9.Fierbinteanu-Braticevici C, Negreanu L, Tarantino G. Is fatty liver always benign and should not consequently be treated? J Physiol Pharmacol 2013; 64:3–9. [PubMed] [Google Scholar]
- 10.Singh S, Allen AM, Wang Z, et al. Fibrosis progression in nonalcoholic fatty liver vs nonalcoholic steatohepatitis: a systematic review and meta-analysis of paired-biopsy studies. Clin Gastroenterol Hepatol 2015; 13:643–654. [DOI] [PMC free article] [PubMed] [Google Scholar]
- 11.Torres DM, Harrison SA. Nonalcoholic fatty liver disease: fibrosis portends a worse prognosis. Hepatology 2015; 61:1462–1464. [DOI] [PubMed] [Google Scholar]
- 12.Sookoian S, Pirola CJ. The genetic epidemiology of nonalcoholic fatty liver disease: toward a personalized medicine. Clin Liver Dis 2012; 16:467–485. [DOI] [PubMed] [Google Scholar]
- 13.Ahrens M, Ammerpohl O, von Schönfels W, et al. DNA methylation analysis in nonalcoholic fatty liver disease suggests distinct disease-specific and remodeling signatures after bariatric surgery. Cell Metab 2013; 18:296–302. [DOI] [PubMed] [Google Scholar]
- 14.Murphy SK, Yang H, Moylan CA, et al. Relationship between methylome and transcriptome in patients with nonalcoholic fatty liver disease. Gastroenterology 2013; 145:1076–1087. [DOI] [PMC free article] [PubMed] [Google Scholar]
- 15.Pirola CJ, Gianotti TF, Burgueno AL, et al. Epigenetic modification of liver mitochondrial DNA is associated with histological severity of nonalcoholic fatty liver disease. Gut 2013; 62:1356–1363. [DOI] [PubMed] [Google Scholar]
- 16.Caldwell SH, de Freitas LA, Park SH, et al. Intramitochondrial crystalline inclusions in nonalcoholic steatohepatitis. Hepatology 2009; 49:1888–1895. [DOI] [PubMed] [Google Scholar]
- 17.Koliaki C, Szendroedi J, Kaul K, et al. Adaptation of hepatic mitochondrial function in humans with non-alcoholic fatty liver is lost in steatohepatitis. Cell Metab 2015; 21:739–746. [DOI] [PubMed] [Google Scholar]
- 18.Sanyal AJ, Campbell-Sargent C, Mirshahi F, et al. Nonalcoholic steatohepatitis: association of insulin resistance and mitochondrial abnormalities. Gastroenterology 2001; 120:1183–1192. [DOI] [PubMed] [Google Scholar]
- 19.Song BJ, Akbar M, Abdelmegeed MA, et al. Mitochondrial dysfunction and tissue injury by alcohol, high fat, nonalcoholic substances and pathological conditions through post-translational protein modifications. Redox Biol 2014; 3:109–123. [DOI] [PMC free article] [PubMed] [Google Scholar]
- 20.Zeybel M, Hardy T, Robinson SM, et al. Differential DNA methylation of genes involved in fibrosis progression in non-alcoholic fatty liver disease and alcoholic liver disease. Clin Epigenetics 2015; 7:25. [DOI] [PMC free article] [PubMed] [Google Scholar]
- 21.Wyatt GR, Cohen SS. A new pyrimidine base from bacteriophage nucleic acids. Nature 1952; 170:1072–1073. [DOI] [PubMed] [Google Scholar]
- 22.Laird A, Thomson JP, Harrison DJ, et al. 5-Hydroxymethylcytosine profiling as an indicator of cellular state. Epigenomics 2013; 5:655–669. [DOI] [PubMed] [Google Scholar]
- 23.Nestor CE, Ottaviano R, Reddington J, et al. Tissue type is a major modifier of the 5-hydroxymethylcytosine content of human genes. Genome Res 2012; 22:467–477. [DOI] [PMC free article] [PubMed] [Google Scholar]
- 24.Thomson JP, Hunter JM, Lempiainen H, et al. Dynamic changes in 5-hydroxymethylation signatures underpin early and late events in drug exposed liver. Nucleic Acids Res 2013; 41:5639–5654. [DOI] [PMC free article] [PubMed] [Google Scholar]
- 25.Shock LS, Thakkar PV, Peterson EJ, et al. DNA methyltransferase 1, cytosine methylation, and cytosine hydroxymethylation in mammalian mitochondria. Proc Natl Acad Sci USA 2011; 108:3630–3635. [DOI] [PMC free article] [PubMed] [Google Scholar]
- 26.Bellizzi D, D’Aquila P, Scafone T, et al. The control region of mitochondrial DNA shows an unusual CpG and non-CpG methylation pattern. DNA Res 2013; 20:537–547. [DOI] [PMC free article] [PubMed] [Google Scholar]
- 27.Tahiliani M, Koh KP, Shen Y, et al. Conversion of 5-methylcytosine to 5-hydroxymethylcytosine in mammalian DNA by MLL partner TET1. Science 2009; 324:930–935. [DOI] [PMC free article] [PubMed] [Google Scholar]
- 28.Xin YJ, Yuan B, Yu B, et al. Tet1-mediated DNA demethylation regulates neuronal cell death induced by oxidative stress. Sci Rep 2015; 5:7645. [DOI] [PMC free article] [PubMed] [Google Scholar]
- 29.Eguchi A, Wree A, Feldstein AE. Biomarkers of liver cell death. J Hepatol 2014; 60:1063–1074. [DOI] [PubMed] [Google Scholar]
- 30.Kleiner DE, Brunt EM, Van NM, et al. Design and validation of a histological scoring system for nonalcoholic fatty liver disease. Hepatology 2005; 41:1313–1321. [DOI] [PubMed] [Google Scholar]
- 31.Brunt EM, Kleiner DE, Wilson LA, et al. Nonalcoholic fatty liver disease (NAFLD) activity score and the histopathologic diagnosis in NAFLD: distinct clinicopathologic meanings. Hepatology 2011; 53:810–820. [DOI] [PMC free article] [PubMed] [Google Scholar]
- 32.Skol AD, Scott LJ, Abecasis GR, et al. Joint analysis is more efficient than replication-based analysis for two-stage genome-wide association studies. Nat Genet 2006; 38:209–213. [DOI] [PubMed] [Google Scholar]
- 33.Jin C, Lu Y, Jelinek J, et al. TET1 is a maintenance DNA demethylase that prevents methylation spreading in differentiated cells. Nucleic Acids Res 2014; 42:6956–6971. [DOI] [PMC free article] [PubMed] [Google Scholar]
- 34.Williams K, Christensen J, Pedersen MT, et al. TET1 and hydroxymethylcytosine in transcription and DNA methylation fidelity. Nature 2011; 473:343–348. [DOI] [PMC free article] [PubMed] [Google Scholar]
- 35.Williams K, Christensen J, Helin K. DNA methylation: TET proteins-guardians of CpG islands? EMBO Rep 2012; 13:28–35. [DOI] [PMC free article] [PubMed] [Google Scholar]
- 36.Udali S, Guarini P, Moruzzi S, et al. Global DNA methylation and hydroxymethylation differ in hepatocellular carcinoma and cholangiocarcinoma and relate to survival rate. Hepatology 2015; 62:496–504. [DOI] [PubMed] [Google Scholar]
- 37.Leers MP, Kolgen W, Bjorklund V, et al. Immunocytochemical detection and mapping of a cytokeratin 18 neo-epitope exposed during early apoptosis. J Pathol 1999; 187:567–572. [DOI] [PubMed] [Google Scholar]
- 38.Ivanov M, Kals M, Kacevska M, et al. Ontogeny, distribution and potential roles of 5-hydroxymethylcytosine in human liver function. Genome Biol 2013; 14:R83. [DOI] [PMC free article] [PubMed] [Google Scholar]