

Abstract
We retrospectively examined intraoperative blood transfusion patterns at US veteran's hospitals through description of national patterns of intraoperative blood transfusion by indication for transfusion in the elderly; assessment of temporal trends in the use of intraoperative blood transfusion; and relationship of institutional use of intraoperative blood transfusion to hospital 30-day risk-adjusted postoperative mortality rates.
Limited data exist on the pattern of intraoperative blood transfusion by indication for transfusion at the hospital level, and the relationship between intraoperative transfusion rates and institutional surgical outcomes.
Using the Department of Veterans Affairs Surgical Quality Improvement Program database, we assigned 424,015 major noncardiac operations among elderly patients (≥65 years) in 117 veteran's hospitals, from 1997 to 2009, into groups based on indication for intraoperative blood transfusion according to literature and clinical guidelines. We then examined institutional variations and temporal trends in surgical blood use based on these indications, and the relationship between these institutional patterns of transfusion and 30-day postoperative mortality.
Intraoperative transfusion occurred in 38,056/424,015 operations (9.0%). Among the 64,390 operations with an indication for transfusion, there was wide variation (median: 49.9%, range: 8.7%–76.2%) in hospital transfusion rates, a yearly decline in transfusion rates (average 1.0%/y), and an inverse relationship between hospital intraoperative transfusion rates and hospital 30-day risk-adjusted mortality (adjusted mortality of 9.8 ± 2.8% vs 8.3 ± 2.1% for lowest and highest tertiles of hospital transfusion rates, respectively, P = 0.02). In contrast, for the 225,782 operations with no indication for transfusion, there was little variation in hospital transfusion rates (median 0.7%, range: 0%–3.4%), no meaningful temporal change in transfusion (average 0.0%/y), and similar risk-adjusted 30-day mortality across all tertiles of hospital transfusion rates.
Among patients ≥65 years with an indication for intraoperative transfusion, intraoperative transfusion patterns varied widely across hospitals and declined through the 1997 to 2009 study period. Hospitals with higher transfusion rates in these patients have lower risk-adjusted 30-day postoperative mortality rates.
INTRODUCTION
Understanding the pattern of blood transfusion use during surgery is important because surgical patients receive close to half of all transfused blood,1–3 transfusions are costly and limited,4,5 and differences in hospital intraoperative transfusion practices may contribute to national heterogeneity in care and surgical outcomes. The association of intraoperative transfusion use with outcomes is especially important given national and international initiatives to improve the quality of surgical care.6,7
However, scant data are available to inform such discussions. Controversy exists as to whether higher hospital intraoperative and postoperative transfusion rates can be used as an indicator of inferior quality of care in cardiac surgery programs.8,9 A single-center randomized controlled trial (RCT) in cardiac surgery showed no difference in 30-day postoperative outcomes when intraoperative and postoperative blood transfusions were used to maintain hemoglobin levels at either 9.1 g/dL or 10.5 g/dL.10 The 2 available multicenter RCTs focused on postoperative transfusion in patients who underwent noncardiac surgery,11,12 and neither showed a definitive relationship between postoperative blood transfusion and outcomes. Although previous studies have described the national pattern of blood transfusion use in specific procedures such as coronary artery bypass surgery, total hip replacement, pancreaticoduodenectomy, and colectomy,13,14 few studies relate hospital intraoperative transfusion or nontransfusion patterns with institutional surgical outcomes.
Furthermore, there have not been large-scale studies describing national intraoperative transfusion use by indication for blood transfusion for patients undergoing major noncardiac surgery, or temporal trends of transfusion practices. This task can now be facilitated by a framework from our previous work that found intraoperative blood transfusions, in the event of substantial operative blood loss, to be associated with <30-day mortality at the patient level.15 We hope to further explore this relationship between intraoperative transfusion and surgical outcomes at the institutional level in this study. We also drew from a recent RCT on postoperative blood use,12 and recent guidelines for the appropriate use of blood transfusions.16,17
Because elderly patients receive a major proportion of the total blood transfused18 and are especially vulnerable to both the complications of anemia19–21 and the side effects of blood transfusions,22,23 they are an ideal population to study the association between intraoperative blood transfusion practices and hospitals’ postoperative outcomes. Using a nationwide sample of US veteran's hospitals, our study aimed to describe national patterns of intraoperative blood transfusion by indication for transfusion in the elderly, assess temporal trends in the use of intraoperative blood transfusion from 1997 to 2009, and relate institutional use of intraoperative blood transfusion with hospital 30-day risk-adjusted postoperative mortality rates.
METHODS
We used data from the Department of Veterans Affairs (VA) Surgical Quality Improvement Program (VASQIP), a VA-wide surgical quality of care initiative to improve the outcomes of major noncardiac surgeries. The VASQIP is a VA-wide surgical quality of care initiative to improve the outcomes of major noncardiac surgeries through prospective collection of data on patient risk and report of risk-adjusted postoperative outcomes.24–26 Excluded from the dataset were repeated operations performed within 30 days of the initial procedure (by definition of VASQIP, a return to the operating room for any type of intervention is considered a complication of the initial procedure), and procedures with very low morbidity and mortality, such as ophthalmology, auditory, or nasal procedures. Nurse reviewers in each participating center extracted the data. The quality of the abstracted data is monitored with periodic data reabstraction by external reviewers, and has shown very good agreement.
The institutional review boards of the Providence VA Medical Center and the University of Colorado Denver, and the VASQIP Data Use Group approved the study.
Analytic Sample
The study's main unit of analysis was the participating institution in the VASQIP during the years 1997 to 2009. Before any exclusions were applied, our sample included 140 institutions and 497,440 operations performed on 393,398 unique veteran patients aged ≥65 years who had undergone noncardiac surgery during the study period. In order to focus on major noncardiac surgery where there is a greater concern for significant morbidity and mortality and variation in institutional health outcomes, we excluded 26,431 operations that were not done under general, spinal, or epidural anesthesia, and 1396 operations not classified under the surgical specialties of general, peripheral vascular, orthopedic, urology, noncardiac thoracic, neurosurgery, otolaryngology, and plastics. We further excluded 325 cases with missing data for nonlaboratory variables that were >99% complete for the study population The study outcome was 30-day postoperative mortality from the day of the index operation, whether death occurred within or after the initial hospitalization. If a patient had undergone >1 operation in a fiscal year, we randomly selected only one of these operations (40,365 cases excluded) because these operations are more likely to be related to maintain statistical independence of observations. In addition, we only included institutions which have averaged >1 patient with an indication for transfusion (defined below) per year (4908 cases excluded from 21 hospitals), so low volume centers would not skew the hospital-level data and contribute to statistical noise through increased variance.
All the exclusions (supplemental figure) yielded a final analytic sample of 424,015 operations for 362,446 unique patients in 117 institutions.
Intraoperative Blood Transfusion
Patients were classified as having received intraoperative blood transfusions if they received red blood cells during their operation. If the red blood cells came from a cell saver (which occurred in <0.3% of VASQIP surgeries),15 every 500cc of fluid were considered to be equivalent to 1 unit of red cell.
Indications for Blood Transfusion
Based on current literature and guideline recommendations, we considered “indication for transfusion” to exist if a patient had either a preoperative hematocrit value <24% (grossly equivalent to hemoglobin levels of 8 g/dL)17 or significant surgical blood loss, defined here as an estimated blood loss >500 mL, at any hematocrit level.15 We considered a patient to have “no indication for transfusion” if the preoperative hematocrit value was ≥30% and surgical blood loss was <500 mL.15,27 Preoperative hematocrit was defined as the last hematocrit measurement before the index operation. Based on previous work, the median duration between the last hematocrit measurement and the index operation was 3 days (interquartile range 1–11 days).19
Estimation of Intraoperative Blood Loss
The surgical blood loss was estimated based on a previously developed formula for a population of predominantly male patients, ≥65 years, who underwent major noncardiac surgery with and without intraoperative blood transfusions:15
Intraoperative blood loss (in mL) = (31.265 × % preoperative hematocrit) − (29.83 × % postoperative hematocrit) + (269.67 × units of red blood cells transfused intraoperatively), where % hematocrit levels are volume (in mL) of packed red blood cells divided by the total volume (in mL) of the blood sample, and units of red blood cells are usually 220 mL per unit.
This formula showed a high correlation with the chart documentation of surgical blood loss (R2 of 0.62) at the individual level,15 and was validated for hospital-level analyses in a subsequent study.27 The postoperative hematocrit captures the lowest postoperative hematocrit after the index surgery; thus, it could reflect the value immediately postsurgery or the day after, with the intention of capturing the maximal extent of potential blood loss.
Study Outcome
The main outcome of the study was hospital surgical mortality rates within 30 days of the index surgery, which was obtained by chart abstraction and validated by VA vital status files.27
Statistical Analysis
For all our analyses, hospital intraoperative blood transfusion use was studied for 3 groups of patients by indication: the entire population of elderly patients undergoing major noncardiac surgery irrespective of the indication (overall transfusion), the subgroup of patients with indication for transfusion, and the subgroup of patients with no indication for transfusion, per criteria stated previously.
First, we compared yearly trends of intraoperative blood use using a mixed-effects linear model that adjusted for clustering of patients within hospitals. Next, we calculated each hospital's intraoperative transfusion rates for all patients, patients with indication for transfusion, and patients with no indication for transfusion. We divided hospitals into tertiles of intraoperative blood use for each subgroup, and compared hospital characteristics among the tertiles using χ2 analysis for categorical variables and one-way analysis of variance for continuous variables. We also compared baseline patient characteristics among the tertiles of hospitals using multivariable regression modeling adjusted for clustering of patients within hospitals.
To relate hospital intraoperative transfusion use with risk-adjusted postoperative outcomes, we calculated each hospital's risk-adjusted 30-day mortality (discussed further below) for the 3 groups of patients, and compared their risk-adjusted mortality rates among tertiles using one-way analysis of variance. We used Pearson correlation to assess the association between hospital rates of intraoperative transfusion and the hospital's 30-day risk-adjusted mortality rates. Linearity assumptions were examined with residuals versus fitted values plots, and sensitivity analyses were conducted excluding presumed outliers. We also conducted sensitivity analyses by incorporating postoperative blood transfusion >4 units and an emergency surgery interaction term into our 30-day mortality prediction model to explore potential effects of postoperative transfusion or emergency surgery on the study outcomes. Linear regression was used to adjust for potential confounding by hospital's annual surgical volume.
The risk-adjusted 30-day postoperative mortality for each hospital was determined by estimating the predicted probability of 30-day postoperative death for each patient based on a previously established VASQIP mortality model,19,25 aggregating the values at the hospital level, and then calculating the ratio of observed-to-expected mortality for each hospital in the study. The mortality prediction model included 41 patient and surgery-level variables (listed in Supplementary Table 1) with excellent outcome discrimination for both our overall study population (c-index = 0.87) and subgroup analyses (c-indices of 0.82 and 0.86 for subgroups with clear indication and no indication, respectively). Preoperative blood transfusion >4 units (<72 hours of surgery) was incorporated into the mortality prediction model because it may predict intraoperative blood use and a higher likelihood of postoperative complications. Postoperative transfusions were captured in VASQIP as a surgical complication because of blood loss and were not included in our main analyses. Data were >98% complete for all variables in the model with the exception of laboratory variables, which contained up to 37% missing for liver function tests. We used a well-validated multivariate imputation regression technique to account for missing values.28,29 The risk-adjusted mortality for each hospital was then calculated by multiplying the observed-to-expected mortality ratio by the overall observed mortality for the group of patients with the transfusion indication being studied (ie, overall, indication for transfusion and no indication for transfusion, respectively).
Statistical analyses were performed using STATA SE 11.2 (StataCorp LP, College Station, TX) and SAS 9.2 (SAS Inc, Cary, NC), and a 2-sided P value of <0.05 was considered significant.
RESULTS
The analytic sample included 117 hospitals. Intraoperative transfusion occurred in 38,056/424,015 operations (9.0%). Stratified by transfusion indication, we classified 64,390 operations as having indication for transfusion (62,947 because of estimated major blood loss), which represented 86.0% of overall transfused cases, and 225,782 operations as having no indication for transfusion, which represented only 5.5% of overall transfused cases.
Temporal Trends
Examination of temporal trends (Figure 1) showed that hospital rates of intraoperative transfusion declined for the overall group by −0.35 percentage points per year (95% confidence interval [CI]: −0.31 to −0.39) and for the subgroup with indication for transfusion by −1.01 percentage points per year (95% CI: −0.78% to −1.23) over the 13-year study period (1997–2009). In contrast, hospital rates of intraoperative transfusion in the subgroup of patients with no indication for transfusion declined only −0.03 percentage points per year (95% CI: −0.01 to −0.04).
FIGURE 1.
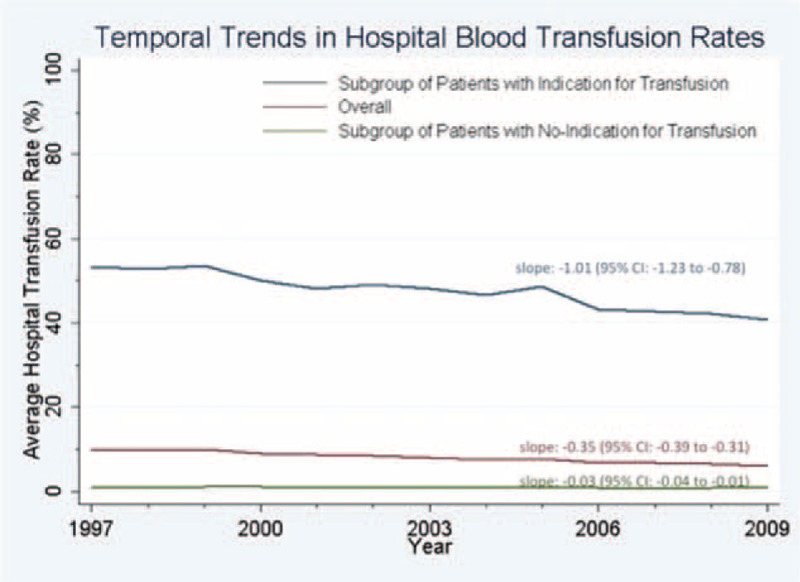
Temporal Trends in Hospital Blood Transfusion Rates. Hospital rates of intraoperative transfusion declined per year by −0.35 percentage points in the overall study group, by −1.01 percentage points in the subgroup with indication for transfusion, and −0.03 percentage points in the subgroup of patients with no indication for transfusion.
Variation in Hospital Intraoperative Transfusion Rates
The pattern of hospital intraoperative transfusion rates varied based on indication for transfusion. The variation in hospital intraoperative transfusion rates was only moderate for the entire study population (median transfusion rate = 8.1%, range 0.5%–20.4% [interquartile range: 5.3%–10.8%]). The variation was greater among the subgroup of patients with an indication for transfusion (median: 49.9%, range 8.7%–76.2% [interquartile range: 40.7%–57.4%]; Figure 2). There was only minimal variation in hospital intraoperative transfusion rates for the subgroup of patients with no indication for transfusion (median transfusion rate = 0.7%, range: 0%–3.4% [interquartile range: 0.5%–1.2%]).
FIGURE 2.
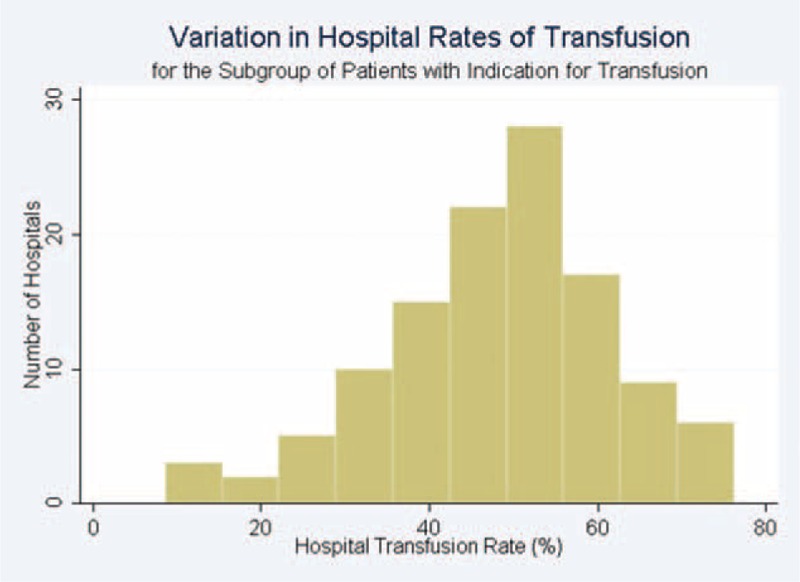
Variation in Hospital Rates of Transfusion for the Subgroup of Patients with Indication for Transfusion. In this subgroup, the median hospital rate of transfusion was 49.9% and the interquartile range spanned from 40.7–57.2%.
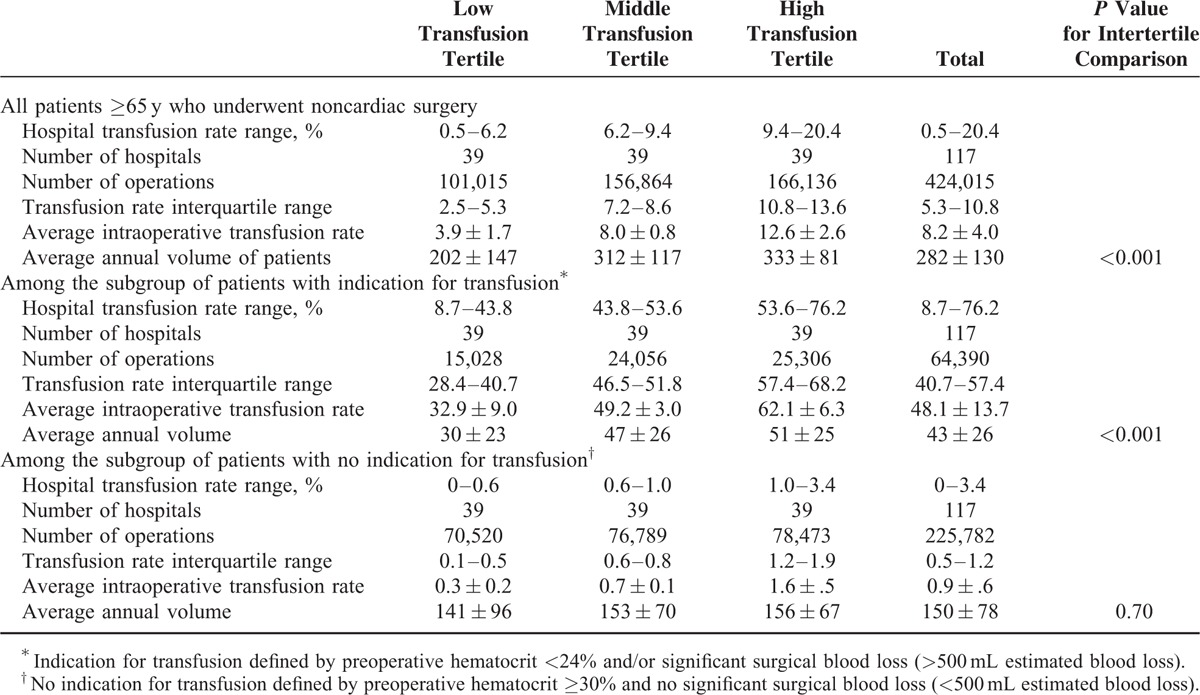
Baseline characteristics of the hospitals stratified by tertiles of hospital intraoperative transfusion rates for each indication group are shown in Table 1. Although the annual surgical volume was consistently higher for hospitals in the highest tertile of intraoperative blood transfusion rates for all patients and for the subgroup of patients with indication for transfusion, the annual surgical volume was similar for hospitals when stratified by tertiles of intraoperative blood transfusion rates for patients with no indication for transfusion.
TABLE 1.
Hospital Characteristics Stratified by Tertiles of Hospital Blood Transfusion for Each Indication Subgroup
The baseline characteristics of patients stratified by tertiles of hospital intraoperative transfusion rates for the overall group and for the subgroups of patients with indication and no indication for transfusion are shown in Supplementary Tables 2 to 4, respectively. Briefly, patients treated in hospitals in the highest tertile of overall transfusion rates were more likely to be a racial minority, have higher rates of preoperative comorbidities, laboratory abnormalities, and a more complex surgery (higher work relative value units, more vascular, noncardiac thoracic, and neurosurgery), but less likely to have a do-not-resuscitate order (Supplementary Table 2). A similar pattern of baseline characteristics was observed for patients in the highest tertile of hospital transfusion rates for the subgroup with an indication for transfusion (Supplementary Table 3). The baseline characteristics of patients were similar among tertiles of hospital transfusion rates for patients with no indication for transfusion, with the exception of preoperative blood transfusion and ventilator dependence <48 hours of surgery which were more likely to occur in patients within the highest tertile of hospital transfusion rates, and a do-not resuscitate order which was least likely to occur in this tertile group of patients (Supplementary Table 4).
Relationship Between Hospital Intraoperative Transfusion Rate and 30-Day Postoperative Mortality
Table 2 shows hospital 30-day surgical mortality rates stratified by tertiles of hospital intraoperative transfusion rates for each indication group. For all patients, although the crude (unadjusted) 30-day hospital surgical mortality rates were significantly higher for tertiles of hospitals with higher intraoperative transfusion rates (P<0.001), the risk-adjusted mortality rates were similar (P = 0.43). For the subgroup of patients with no indication for transfusion, the hospital's risk-adjusted 30-day mortality rates were similar across tertiles of hospitals stratified by intraoperative transfusion rates (P = 0.54). On the contrary, for the subgroup of patients with indication for blood transfusion, the risk-adjusted 30-day mortality rates were significantly lower for hospitals in the highest tertile of intraoperative transfusion rates (P = 0.02). For these patients, Pearson correlation showed that hospital intraoperative transfusion rates had an inverse relationship with the hospital's 30-day risk-adjusted mortality (r = −0.31, P < 0.001; Figure 3).
TABLE 2.
Hospital's 30-Day Surgical Mortality Rates, Stratified by Tertiles of Surgical Blood Transfusion Rates
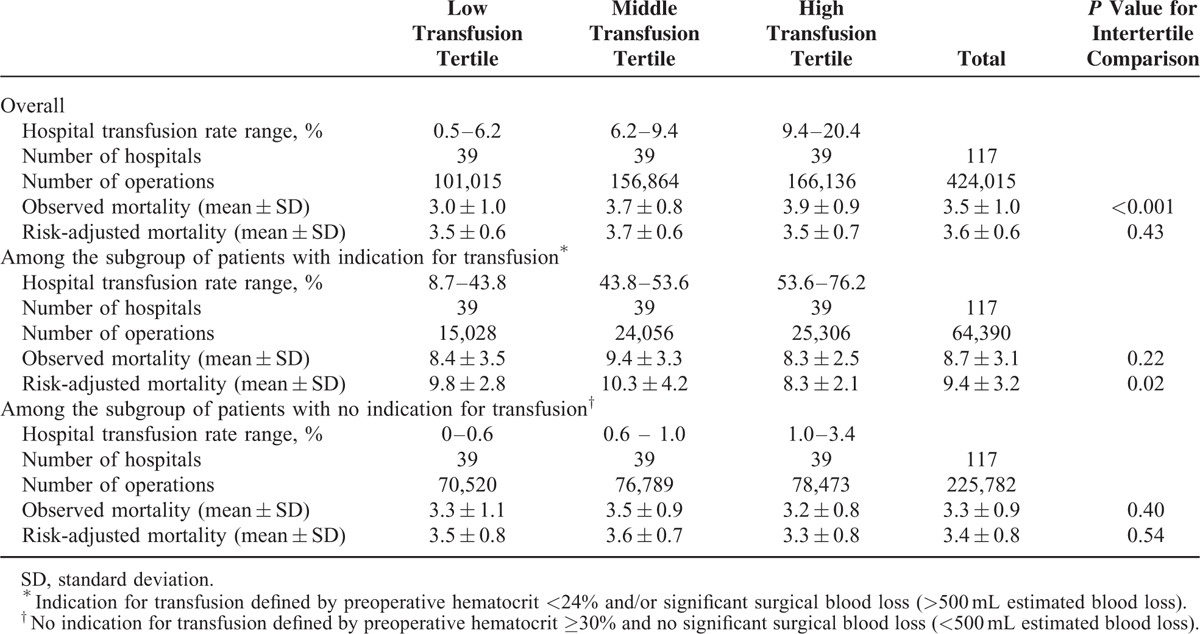
FIGURE 3.
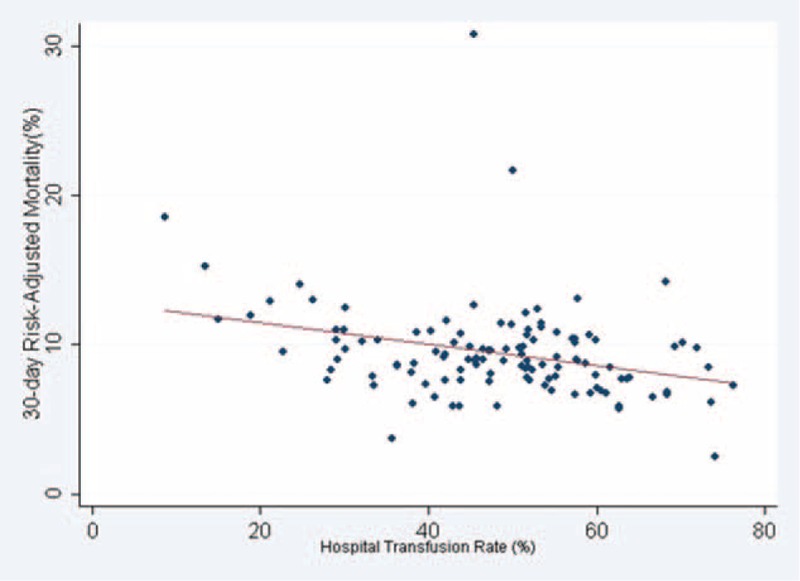
Hospital Transfusion Rate and 30-day Risk-Adjusted Mortality for the Subgroup of Patients with Indication for Blood Transfusion. Pearson correlation showed an inverse relationship (r = −0.31, P < 0.001).
These findings for the subgroup of patients with indication for intraoperative transfusion remained significant after excluding outlier hospitals based on a high 30-day risk-adjusted mortality (n = 2) or low transfusion rates (n = 2), or both (n = 4) (Supplementary Table 5). These 4 outlier hospitals generally had lower volumes of patients with indication for transfusion (average: 24 patients/y) and belonged to the lowest and middle transfusion tertiles. We found the association became more pronounced after 2 outlier hospitals with 30-day risk-adjusted mortality rates >20% were removed (r = −0.43, P < 0.001). This relationship remained significant after adjustment for the hospital's annual surgical volume (P = 0.018). Sensitivity analysis with addition of postoperative blood transfusion >4 units and an emergency surgery interaction term into the mortality prediction model also did not significantly affect our findings (data not shown). Examination of the residuals versus fitted values plots showed no violation of linearity assumptions.
There were an additional 133,843 cases with uncertain indication for transfusion, of which 19,107 cases had a preoperative hematocrit between 24% and 30% and blood loss <500 mL, and 114,736 cases were lacking postoperative hematocrit values for whom estimation of blood loss was not possible. These groups represented 2.0% and 6.5%, respectively, of overall transfused cases (baseline patient characteristics in Supplementary Tables 6 and 7). Patients for whom blood loss estimation was not possible had a lower rate of comorbidities compared with that of the overall study group; for instance, they had lower rates of heart failure within 30 days, myocardial infarction within 6 months, dyspnea at rest, and impaired sensorium.
DISCUSSION
We found that hospital intraoperative blood transfusion use, temporal patterns in transfusion, and the association between hospital intraoperative transfusion rates and surgical mortality differed greatly by groups defined by indication or no indication for transfusion. Among the subgroup of patients with indication for intraoperative transfusion, hospital intraoperative transfusion rates varied widely, significantly declined during the study period, and higher rates of intraoperative transfusion were associated with lower hospital's 30-day risk-adjusted mortality. However, among patients with no indication for intraoperative transfusion, there was minimal variation in hospital transfusion rates, consistently low rates of transfusion across the study period, and no association between rates of intraoperative transfusion use and hospital's 30-day risk-adjusted mortality.
Our findings and those of others suggest that large variability still persists in the intraoperative use of blood transfusion.14 In particular, we found that the magnitude of variation differed greatly by indication for intraoperative transfusion. The largest variation in intraoperative transfusion was observed in patients with indication for transfusion (range: 8.7%–76.2%), with a close to normal distribution (Figure 2). This finding suggests clinical equipoise and that clinicians may differ in opinion about the criteria for clinically appropriate intraoperative blood transfusions. Despite the publication of 2 multicenter RCTs addressing adult postoperative transfusion thresholds in the intensive care and hip surgery settings,12,30 and a large observational study of intraoperative transfusion for patients with surgical blood loss,15 there may be a need for further evidence to guide clinicians’ decisions about intraoperative blood transfusion.15 The variation in intraoperative transfusion practices overall, and specifically for the subgroup of patients with a clear indication for intraoperative transfusion, may be due to an evolving concept of what is considered appropriate throughout the 12-year study period despite the lack of significant change in perioperative blood transfusion guidelines. Changing attitudes toward transfusion may also contribute to the temporal variation in transfusion practices that we observed.
On the contrary, there appeared to be very little practice variation among hospitals throughout the study period for the subgroup of patients with no indication for transfusion. For these patients, almost all hospitals in our study had minimal transfusion rates, suggesting excessive blood transfusion was not a significant concern in our cohort.
Temporal patterns in intraoperative blood transfusion also differed by indication group. Although there was a 1.01 percentage point yearly decline in the hospital intraoperative transfusion rates for the subgroup of patients with indications for transfusion, the transfusion rate for operations with no indication for transfusion was consistently low across the 13-year study period (median 0.7%). These findings may reflect greater awareness about the risks of transfusion.11 However, the decline in rates of intraoperative blood transfusion primarily impacted patients with an indication for transfusion and potentially resulted in underuse of an appropriate therapy for major surgical blood loss or significant preoperative anemia. Future efforts in this area should aim at generating more evidence to guide clinicians on appropriate intraoperative transfusion and reduce the heterogeneity among hospitals in practice.
The association of higher levels of hospital intraoperative transfusion with lower hospital risk-adjusted 30-day mortality for patients with indications for transfusion may reflect a hospital's ability to successfully “rescue” a patient from major surgical complication, that is blood loss. We also found that hospitals with higher surgical volumes tend to have higher intraoperative transfusion rates, but our results remained significant after adjustment for annual surgical volume. These findings are in contrast to some data from observational studies, suggesting blood transfusion overall is associated with worse outcomes.31,32 However, when studies account for anemia and blood loss, a subset of surgical patients that may benefit from blood transfusions can be identified.15,27
Our findings support the thresholds for surgical transfusion in the current guidelines, and suggest that the hospital's rate of appropriate intraoperative transfusion might be a valid framework to be used in future studies of surgical transfusion pattern. Our study suggests that it is useful to examine patterns of surgical blood transfusion stratified by indication as opposed to aggregate rates of blood transfusions without consideration of the clinical indication. Although the optimal indication for blood transfusion may continue to evolve with future evidence, the current framework of examining in the context of the clinical scenario will be adaptable and represents the first steps toward that direction. Based on prespecified criteria informed by current evidence, we found that the overall trend toward more restrictive intraoperative blood transfusion patterns in the elderly during our study period was primarily driven by a decline in transfusion rates in patients with reasonable indications for transfusion, such as significant preoperative anemia or intraoperative blood loss, whereas transfusion rates among the subgroup without such a clear indication remains consistently low throughout the study period.
Strengths of this database include its nationwide sample of VA hospitals, diversity of surgeries, and broad spectrum of patient complexity and abstraction of clinical data as opposed to administrative claims data. This study also has limitations. The study sample of predominantly male veterans ≥65 years treated in VA hospitals may not generalize to younger or female patients, or treatment in non-VA hospitals. Further research should be conducted in other populations. Procedures done within 30 days of the index operation were not recorded in the VASQIP database as independent observations but rather complications of the first surgery; further research is needed to explore patterns of transfusion in the event of reexploration because of blood loss. Although we constructed our study sample from a nationwide set of VA hospitals in the United States, we only included those hospitals that met the minimal volume criteria of 1 or more transfusion-eligible patients per year. Therefore, our results may not be generalized to low volume centers that did not meet this criterion. However, these facilities account for only 1.2% of all procedures in the VASQIP database. Future studies are needed on exploring the transfusion patterns of hospitals with low volume of transfusion-eligible patients The question may arise of whether observational evidence may be sufficient to recommend best practices in the absence of RCTs. Despite the strengths of RCTs in providing evidence for causation, they can be difficult to conduct in operating room settings, and the use of standardized treatment protocols to isolate effects of the intervention may not reflect a real-world clinical environment.33,34 On the contrary, data quality in carefully conducted observational studies can be arguably as good as RCTs,35 with the results better reflecting real-world practices and broader generalizability. However, the main limitation of observational evidence is the possibility of confounding. Although we have adjusted for an extensive list of preoperative and operative variables to account for patient case-mix across hospitals and our method of risk-adjustment has been validated, there may still be residual confounding (eg, more experienced surgeons, anesthesiology, or quality of intensive care). For example, we could not determine the precise hydration, hemodynamic status, and/or clinical conditions for which the surgical team's judgment for providing or withholding of blood transfusions during surgery was made. Therefore, these findings may suggest that higher appropriate intraoperative transfusion rates are a reflection of a hospital's overall quality of surgical care (eg, ability to rescue from a major surgical complication) rather than solely survival is better for patients who were operated in hospitals that have high transfusion rates for those patients with an indication. Third, intraoperative blood loss was estimated rather than directly measured, a task that is difficult to accomplish in the real-world setting. Fourth, we did not analyze the variation of transfusion rates by surgical specialty, as current knowledge and guidelines do not support it as a determinant for blood transfusion beyond patient case-mix, which has been accounted for within the mortality-adjustment models. Fifth, there were 114,736 patients for whom we could not estimate blood loss; however, they comprised only 6.5% of total transfusions.
In conclusion, we found a useful framework to study hospital variation in intraoperative blood transfusion practices that was related to surgical outcomes. Hospitals with higher intraoperative transfusion rates in patients with an indication for transfusion have lower risk-adjusted 30-day postoperative mortality rates. Future studies can determine whether this same framework can be applicable to study institutional transfusion practices in other settings such as in preoperative or postoperative care of high-risk patients.
ACKNOWLEDGMENTS
The authors would like to acknowledge the VA Surgical Quality Data Use Group (SQDUG) for its role as scientific advisors and for the critical review of data use and analysis presented in this manuscript.
Footnotes
Abbreviations: RCT = randomized controlled trial, VA = Department of Veterans Affairs, VASQIP = Department of Veterans Affairs Surgical Quality Improvement Program.
Authors’ contributions—The database is provided by the Department of Veterans Affairs Surgical Quality Improvement Program, who collected the data. W-CW and AC had full access to all of the data in the study and take responsibility for the integrity of the data and the accuracy of the data analysis.
Study concept and design: W-CW, AC, ANT, and WGH.
Acquisition of data: W-CW and WGH.
Analysis and interpretation of data: W-CW, AC, LJ, ANT, WGH, and Vezeridis.
Drafting of the manuscript: AC, W-CW, WGH, LJ, ANT, and Vezeridis.
Critical revision of the manuscript for important intellectual content: AC, W-CW, WGH, LJ, ANT, and Vezeridis.
Statistical analysis: AC, W-CW, LJ, and WGH.
Obtained funding: W-CW ands WGH.
This work is supported by the VA Merit Review Award in Health Services Research and Development grant # IIR 04-313. AC is recipient of a training grant from the National Heart, Lung and Blood Institution (T35 HL094308). ANT is supported by HSR&D CDA07-217 and VA HSR&D Robert Wood Johnson Foundation's Faculty Physician Scholars Program. The Providence VA Medical Center's Center of Excellence in Long Term Services and Support provided space and computing infrastructure.
The opinions expressed are those of the authors and not necessarily those of the Department of Veterans Affairs or the United States Government.
The authors have no conflicts of interest to disclose.
REFERENCES
- 1.Wells AW, Mounter PJ, Chapman CE, et al. Where does blood go? Prospective observational study of red cell transfusion in north England. BMJ 2002; 325:803. [DOI] [PMC free article] [PubMed] [Google Scholar]
- 2.Cook SS, Epps J. Transfusion practice in central Virginia. Transfusion 1991; 31:355–360. [DOI] [PubMed] [Google Scholar]
- 3.Mathoulin-Pelissier S, Salmi LR, Verret C, et al. Blood transfusion in a random sample of hospitals in France. Transfusion 2000; 40:1140–1146. [DOI] [PubMed] [Google Scholar]
- 4.Hannon T. Spiess BD, Spence RK, Shander A. The contemporary economics of transfusions. Chapter 2Perioperative Transfusion Medicine Lippincott Williams & Wilkins, 2nd edPhiladelphia, PA:2005. [Google Scholar]
- 5.Sullivan MT, Wallace EL. Blood collection and transfusion in the United States in 1999. Transfusion 2005; 45:141–148. [DOI] [PubMed] [Google Scholar]
- 6.Semel ME, Resch S, Haynes AB, et al. Adopting a surgical safety checklist could save money and improve the quality of care in U.S. hospitals. Health Aff (Millwood) 2010; 29:1593–1599. [DOI] [PMC free article] [PubMed] [Google Scholar]
- 7.Haynes AB, Weiser TG, Berry WR, et al. A surgical safety checklist to reduce morbidity and mortality in a global population. N Engl J Med 2009; 360:491–499. [DOI] [PubMed] [Google Scholar]
- 8.Shander AS, Goodnough LT. Blood transfusion as a quality indicator in cardiac surgery. JAMA 2010; 304:1610–1611. [DOI] [PubMed] [Google Scholar]
- 9.Paone G, Brewer R, Likosky DS, et al. Transfusion rate as a quality metric: is blood conservation a learnable skill? Ann Thorac Surg 2013; 96:1279–1286. [DOI] [PubMed] [Google Scholar]
- 10.Hajjar LA, Vincent JL, Galas FR, et al. Transfusion requirements after cardiac surgery: the TRACS randomized controlled trial. JAMA 2010; 304:1559–1567. [DOI] [PubMed] [Google Scholar]
- 11.Hebert PC, Wells G, Blajchman MA, et al. A multicenter, randomized, controlled clinical trial of transfusion requirements in critical care. Transfusion Requirements in Critical Care Investigators, Canadian Critical Care Trials Group. N Engl J Med 1999; 340:409–417. [DOI] [PubMed] [Google Scholar]
- 12.Carson JL, Terrin ML, Noveck H, et al. Liberal or restrictive transfusion in high-risk patients after hip surgery. N Engl J Med 2011; 365:2453–2462. [DOI] [PMC free article] [PubMed] [Google Scholar]
- 13.Bennett-Guerrero E, Zhao Y, O’Brien SM, et al. Variation in use of blood transfusion in coronary artery bypass graft surgery. JAMA 2010; 304:1568–1575. [DOI] [PubMed] [Google Scholar]
- 14.Qian F, Osler TM, Eaton MP, et al. Variation of blood transfusion in patients undergoing major noncardiac surgery. Ann Surg 2013; 257:266–278. [DOI] [PubMed] [Google Scholar]
- 15.Wu WC, Smith TS, Henderson WG, et al. Operative blood loss, blood transfusion, and 30-day mortality in older patients after major noncardiac surgery. Ann Surg 2010; 252:11–17. [DOI] [PubMed] [Google Scholar]
- 16.Carson JL, Carless PA, Hebert PC. Transfusion thresholds and other strategies for guiding allogeneic red blood cell transfusion. Cochrane Database Syst Rev 2012; 4:CD002042. [DOI] [PMC free article] [PubMed] [Google Scholar]
- 17.Carson JL, Grossman BJ, Kleinman S, et al. Red blood cell transfusion: a clinical practice guideline from the AABB. Ann Intern Med 2012; 157:49–58. [DOI] [PubMed] [Google Scholar]
- 18.Anderson SA, Menis M, O’Connell K, et al. Blood use by inpatient elderly population in the United States. Transfusion 2007; 47:582–592. [DOI] [PubMed] [Google Scholar]
- 19.Wu WC, Schifftner TL, Henderson WG, et al. Preoperative hematocrit levels and postoperative outcomes in older patients undergoing noncardiac surgery. JAMA 2007; 297:2481–2488. [DOI] [PubMed] [Google Scholar]
- 20.Musallam KM, Tamim HM, Richards T, et al. Preoperative anaemia and postoperative outcomes in non-cardiac surgery: a retrospective cohort study. Lancet 2011; 378:1396–1407. [DOI] [PubMed] [Google Scholar]
- 21.Hamel MB, Henderson WG, Khuri SF, et al. Surgical outcomes for patients aged 80 and older: morbidity and mortality from major noncardiac surgery. J Am Geriatr Soc 2005; 53:424–429. [DOI] [PubMed] [Google Scholar]
- 22.Altimir S, Lupon J, Gonzalez B, et al. Sex and age differences in fragility in a heart failure population. Eur J Heart Fail 2005; 7:798–802. [DOI] [PubMed] [Google Scholar]
- 23.Goodnough L, Brecher M, Kanter M, et al. Transfusion medicine. First of two parts. New Eng J Med 1999; 340:438–447. [DOI] [PubMed] [Google Scholar]
- 24.Khuri S, Daley J, Henderson W, et al. The National Veterans Administration Surgical Risk Study: risk adjustment for the comparative assessment of the quality of surgical care. J Am Coll Surg 1995; 180:519–531. [PubMed] [Google Scholar]
- 25.Khuri S, Daley J, Henderson W, et al. Risk adjustment of the postoperative mortality rate for the comparative assessment of the quality of surgical care: results of the National Veterans Affairs Surgical Risk Study. J Am Coll Surg 1997; 185:315–327. [PubMed] [Google Scholar]
- 26.Daley J, Khuri S, Henderson W, et al. Risk adjustment of the postoperative morbidity rate for the comparative assessment of the quality of surgical care: results of the National Veterans Affairs Surgical Risk Study. J Am Coll Surg 1997; 185:328–340. [PubMed] [Google Scholar]
- 27.Wu WC, Trivedi A, Friedmann PD, et al. Association between hospital intraoperative blood transfusion practices for surgical blood loss and hospital surgical mortality rates. Ann Surg 2012; 255:708–714. [DOI] [PubMed] [Google Scholar]
- 28.Rubin DB. Multiple Imputation for Nonresponse in Surveys. New York: John Wiley & Sons, Inc; 1987. [Google Scholar]
- 29.Schafer JL. Analysis of Incomplete Multivariate Data. New York: Chapman & Hall; 1997. [Google Scholar]
- 30.Hebert PC, Wells G, Blajchman MA, et al. A multicenter, randomized, controlled clinical trial of transfusion requirements in critical care. N Engl J Med 1999; 340:409–417. [DOI] [PubMed] [Google Scholar]
- 31.Bursi F, Barbieri A, Politi L, et al. Perioperative red blood cell transfusion and outcome in stable patients after elective major vascular surgery. Eur J Vasc Endovasc Surg 2009; 37:311–318. [DOI] [PubMed] [Google Scholar]
- 32.Vincent J, Baron J-F, Reinhart K, et al. Anemia and blood transfusion in critically ill patients. JAMA 2002; 288:1499–1507. [DOI] [PubMed] [Google Scholar]
- 33.Chao HH, Mayer T, Concato J, et al. Prostate cancer, comorbidity, and participation in randomized controlled trials of therapy. J Investig Med 2010; 58:566–568. [DOI] [PubMed] [Google Scholar]
- 34.Jane-wit D, Horwitz RI, Concato J. Variation in results from randomized, controlled trials: stochastic or systematic? J Clin Epidemiol 2010; 63:56–63. [DOI] [PubMed] [Google Scholar]
- 35.Concato J, Shah N, Horwitz RI. Randomized, controlled trials, observational studies, and the hierarchy of research designs. N Engl J Med 2000; 342:1887–1892. [DOI] [PMC free article] [PubMed] [Google Scholar]