Supplemental Digital Content is available in the text
Abstract
Recurrently and abnormally hypersynchronous discharge is a striking feature of idiopathic generalized epilepsy (IGE). Resting-state functional magnetic resonance imaging has revealed aberrant spontaneous brain synchronization, predominately in low-frequency range (<0.1 Hz), in individuals with IGE. Little is known, however, about these changes in local synchronization across different frequency bands. We examined alterations to frequency-specific local synchronization in terms of spontaneous blood oxygen level-dependent (BOLD) fluctuations across 5 bands, spanning 0 to 0.25 Hz. Specifically, we compared brain activity in a large cohort of IGE patients (n = 86) to age- and sex-matched normal controls (n = 86). IGE patients showed decreased local synchronization in low frequency (<0.073 Hz), primarily in the default mode network (DMN). IGE patients also exhibited increased local synchronization in high-frequency (>0.073 Hz) in a “conscious perception network,” which is anchored by the pregenual and dorsal anterior cingulate cortex, as well as the bilateral insular cortices, possibly contributing to impaired consciousness. Furthermore, we found frequency-specific alternating local synchronization in the posterior portion of the DMN relative to the anterior part, suggesting an interaction between the disease and frequency bands. Importantly, the aberrant high-frequency local synchronization in the middle cingulate cortex was associated with disease duration, thus linking BOLD frequency changes to disease severity. These findings provide an overview of frequency-specific local synchronization of BOLD fluctuations, and may be helpful in uncovering abnormal synchronous neuronal activity in patients with IGE at specific frequency bands.
INTRODUCTION
Idiopathic generalized epilepsy (IGE) is a common type of seizure syndrome.1 Conventionally, generalized seizures are thought to homogeneously affect a large number of brain regions, resulting in abnormal activity across virtually the entire brain.2 However, focal abnormalities occur in IGE, suggesting local and selectively impaired brain function.3
Recurrently and abnormally hypersynchronous generalized spike-wave discharges (GSWDs) are a main feature of IGE. Electrophysiological investigations have generally shown that GSWDs are synchronized throughout the brain,4 resulting in a random organization of the epileptic network.5 More recently, simultaneous electroencephalography and functional magnetic resonance imaging (EEG-fMRI) studies have demonstrated GSWD-related thalamic activation and default mode network (DMN) deactivation in IGE.6 In summary, advanced neuroimaging findings regarding (de)activation of certain cortical regions can be interpreted as evidence supporting the focal basis theory of IGE.7
Resting-state fMRI (RS-fMRI) constitutes a novel paradigm for investigating spontaneous local brain activity and distant connectivity,8 and has been widely used to document intrinsic functional abnormalities in various epilepsies.9–11 Regional homogeneity (ReHo) analysis, which is a type of RS-fMRI approach, can be used to measure local synchronization in the spontaneous blood oxygenation level-dependent (BOLD) fluctuations of “nearest neighbor” voxels.12 This local synchronization of BOLD fluctuations is relevant to band-limited power of local field potential.13 In addition, electrophysiological studies of IGE have shown abnormally hypersynchronous neuronal activity underlying epileptic seizure activity.5 Accordingly, ReHo analysis-based resting-state fMRI is feasible to detect aberrance of brain temporal synchrony in context of the localization and status of epileptiform activity.14 Abnormal ReHo is probably associated with changes in neural activity in certain brain region, and hence may be helpful in localization of the epileptic source in individuals with partial epilepsy.15–17 Moreover, we previously reported increased and decreased ReHo in the thalamus and default mode regions, indicating that ReHo might denote abnormal epileptiform activity in generalized tonic-clonic seizures (subsyndrome of IGE) patients.18 Note that all the above-mentioned studies predominately detected abnormal epileptic local synchronization in the low-frequency range (<0.1 Hz). Little is known, however, about the changes in local synchronization that occur across different frequency bands in patients with IGE.
Both lower (<0.1 Hz) and higher-frequency (>0.1 Hz) BOLD signals may have specific physiological relevance.19–21 For instance, chronic pain studies have specifically demonstrated that aberrant increases in intrinsic brain activity are often derived from higher frequency activity,22,23 which corresponds with previous electrophysiological studies reporting the involvement of slow-3, slow-2, and slow-1 frequency bands.24,25 Even in the conventional low frequency band (<0.1 Hz), investigator observed stronger BOLD fluctuations at slow-4 (0.027–0.073 Hz) in cortical structures, and at slow-5 (0.01–0.027 Hz) in subcortical structures.26 Thus, simply focusing on the conventional low-frequency range runs the risk of overlooking meaningful information associated with frequency-specific spontaneous BOLD fluctuation.19,27
Based on our previous findings regarding frequency-specific amplitude alterations in IGE,28 we expect to find disrupted local synchronization of spontaneous BOLD fluctuations across the entire frequency range (within reason) in IGE patients. Thus, we aimed to confirm whether IGE patients exhibit decreased low-frequency synchronization in the DMN based on prior resting-state investigations, and document and spatially localize aberrant high-frequency local synchronization. The purpose of this work was to delineate the whole-brain organization of BOLD local synchronization as a function of a wide range of frequencies and uncover the neurophysiological significance of frequency-specific abnormal synchronous neuronal activity in IGE.
MATERIALS AND METHODS
Participants
Patients were consecutively recruited at Jinling Hospital, Nanjing, China, between December 2009 and January 2013. Patients were diagnosed according to the criteria of the International League Against Epilepsy (2001). The inclusion criteria for recruitment of patients were as follows: manifestation of typical symptoms of idiopathic generalized tonic–clonic seizures, including tonic extension of the limbs, followed by a clonic phase of rhythmic jerking of the extremities, loss of consciousness during seizures without precursory symptoms of partial epilepsy, and aura; presence of GSWDs in their scalp EEG; no visible focal abnormality in the structural MRI; no history of addiction or neurological disease other than epilepsy; no history of partial seizures; and right handedness. A total of 97 patients fulfilled these inclusion criteria. The exclusion criteria were as follows: self-reported falling asleep during resting-state fMRI scanning, and head motion parameters exceeding 1.5 mm in translation or 1.5° in rotation. After excluding 11 patients owing to excessive head motion, we assessed 86 patients with 3 types of IGE subsyndromes (69 patients with generalized tonic–clonic seizures only [GTCS], 12 patients with juvenile myoclonic epilepsy [JME], and 5 patients with juvenile absence epilepsy [JAE]) in this study. Sixty-four patients took antiepileptic drugs of valproic acid; a part of them additionally took other medications, including topiramate, phenytoin, lamotrigine, and traditional Chinese herb medicine. The demographic and clinical information of these patients are detailed in Table 1.
TABLE 1.
Characteristics of Patients and Normal Controls

Eighty-six age- and sex-matched normal controls (NC) were recruited from the staff at the Jinling Hospital. These individuals had no history of neurological disorder or psychiatric illness and no gross abnormalities in brain MRI images. Written informed consent was obtained from all the participants. The study was approved by the Local Medical Ethics Committee at Jinling Hospital, Nanjing University School of Medicine.
Data Acquisition
All resting-state fMRI data were acquired using a Siemens Trio 3-Tesla MR scanner located at Jinling Hospital, Nanjing, China. Foam pads and belts were used to minimize head motion. Functional images were acquired using a single-shot, gradient-recalled echo planar imaging sequence (repetition time = 2000 ms, echo time = 30 ms, and flip angle = 90°), which obtained 30 axial slices (field of view = 240 × 240 mm2, in-plane matrix = 64 × 64, slice thickness/gap = 4 mm/0.4 mm) and 250 functional volumes for each participant, resulting in a total scan time of 500 seconds. Participants were instructed to rest with their eyes closed, not think of anything in particular, and not fall asleep.
Data Processing
For functional data processing, we used SPM8 (http://www.fil.ion.ucl.ac.uk/spm) and DPARSF (http://www.restfmri.net). The functional images were corrected for temporal differences by calibrating the slice timing and realigning the images to account for head motion. Functional images were warped into standard stereotaxic space at a resolution of 3 × 3 × 3 mm3 using the Montreal Neurological Institute (MNI) echoplanar imaging template. Next, we used regression processes to remove several sources of spurious variances (6 parameters obtained by rigid-body head motion correction, the time courses averaged over the white matter signal, the cerebrospinal fluid signal, and the global brain signal). Finally, we removed any linear trends. According to the previous electrophysiological24,25 and resting-state fMRI studies,26,28 we used 5 frequency bands: slow-6 (0–0.01 Hz), show-5 (0.01–0.027 Hz), slow-4 (0.027–0.073 Hz), slow-3 (0.073–0.198 Hz), and slow-2 (0.198–0.25 Hz) to detect frequency-specific local synchronization.12 The center frequencies and intervals of specific frequency bands were based on a previous study.25 Slow-6 occupied the lowest frequency band, which contributed more to ReHo in the putamen.27 Slow-5 and slow-4 mainly represented the frequency range (0.01–0.073 Hz) widely employed in resting-state fMRI studies. Slow-3 represented a combination of the conventional frequency band (0.073–0.1 Hz) and the frequency band discarded through temporal filtering (0.1–0.198 Hz).19 Slow-2 was generally considered to be highly contaminated with respiration signal. However, the BOLD fluctuations in slow-2 frequency band were significantly associated with neuronal fluctuations, and thus may provide more information about functional integration.19 The data from each of 5 frequency-specific ReHo maps for each individual were divided by the global mean ReHo value and then spatially smoothed (full width at half maximum = 6 mm).
Statistical Analysis
We conducted individual 1-sample t tests on the ReHo maps in each group at each frequency band. Thresholds were set at P < 1.00E-07 (uncorrected). To disentangle frequency-specific regional effects, the ReHo maps were entered into a 2-way repeated-measures analysis of variance (ANOVA), with 5 levels (5 bands: 0–0.01; 0.01–0.027; 0.027–0.073; 0.073–0.198; and 0.198–0.25 Hz) for the within-subject factors, and 2 levels (IGE and NC groups) for the between-subject factors. This repeated ANOVA was implemented using the 3dANOVA3 command line in the AFNI toolkit. This model applied an automated anatomical labeling (AAL) mask to each voxel to produce an F-map of the “frequency by group” interaction and an F-map of group main effect. The interaction threshold for the F-maps was set such that the significance level was P < 0.05 (combined false discovery rate [FDR]-corrected height threshold z > 1.96 and extent threshold k > 20 voxels). At first, we used the statistical threshold described above for the main effect analysis. However, no voxel survived at this conservative threshold. Therefore, we used a relatively lenient threshold, P < 0.05 (combined voxel height threshold F > 3.90 and extent threshold k > 141 voxels), with Monte Carlo simulation within the AAL mask for the main effect analysis. Clusters that survived from the group main effect were entered into post hoc 2-sample t tests for each frequency band. The t-maps were set such that the height threshold FDR-corrected significance level was P < 0.05 and the extent threshold was k > 20 voxels.
Head Motion
To moderate the effects of head motion on estimates of ReHo, we first computed the mean framewise displacement (FD) by averaging the FD from every time point for each subject.29 There were significant differences for the mean FD between 2 groups (T = 2.787, P = 0.0059). Second, we used a scrubbing approach to censor “bad” volumes with FD > 0.5 mm to test the robustness of our findings.29
Linear Correlation Between Local Synchronization and Clinical Variables
To investigate the clinical relevance of altered local frequency-specific synchronization in IGE, we correlated the clinical variables (disease duration, onset age, and seizure frequency) with ReHo values using Spearman correlation analysis. Because none of the clinical variables showed a Gaussian distribution, the regions of interest (ROIs) were selected from the clusters showing significantly increased and decreased ReHo values as per the results of post hoc 2-sample t tests. We averaged the ReHo value within each ROI and performed Spearman correlation analysis.
RESULTS
Frequency-Specific Local Synchronization Features
To assess whole-brain full-bandwidth local synchronization profiles of BOLD oscillation during resting-state fMRI, we used 1-sample t tests at each frequency band for each group (Figure 1). In both the groups, visual inspection of the patterns of ReHo in the lower frequency bands (0.01–0.027 and 0.027–0.073 Hz) showed that the DMN regions had higher ReHo values than other brain regions. These reproducible findings were consistent with the previous studies that used typical frequency bands (<0.1 Hz).12 Across the 2 groups, the frequency-specific local synchronization indicated that the most statistically significant ReHo for the 0 to 0.01 Hz band was localized in the DMN regions and subcortical regions, mainly in the thalamus and basal ganglia. For the 0.073 to 0.198 Hz band, the most statistically significant ReHo was mainly localized in the posterior part of the DMN. Finally, for the 0.198 to 0.25 Hz band, the most statistically significant ReHo was localized in the posterior portion of the precuneus/posterior cingulate cortex, with a lower level of local synchronization than typical low frequency bands.
FIGURE 1.

Within-group comparison of frequency-specific local synchronization. The results are presented on inflated surface maps for the (A) idiopathic generalized epilepsy (IGE) group and the (B) normal controls (NC) group at each frequency band using the BrainNet viewer (www.nitrc.org/projects/bnv/). The color bars represent t values produced by 1-sample t tests (P < 1.00E-07, uncorrected).
Altered Frequency-Specific Local Synchronization in IGE
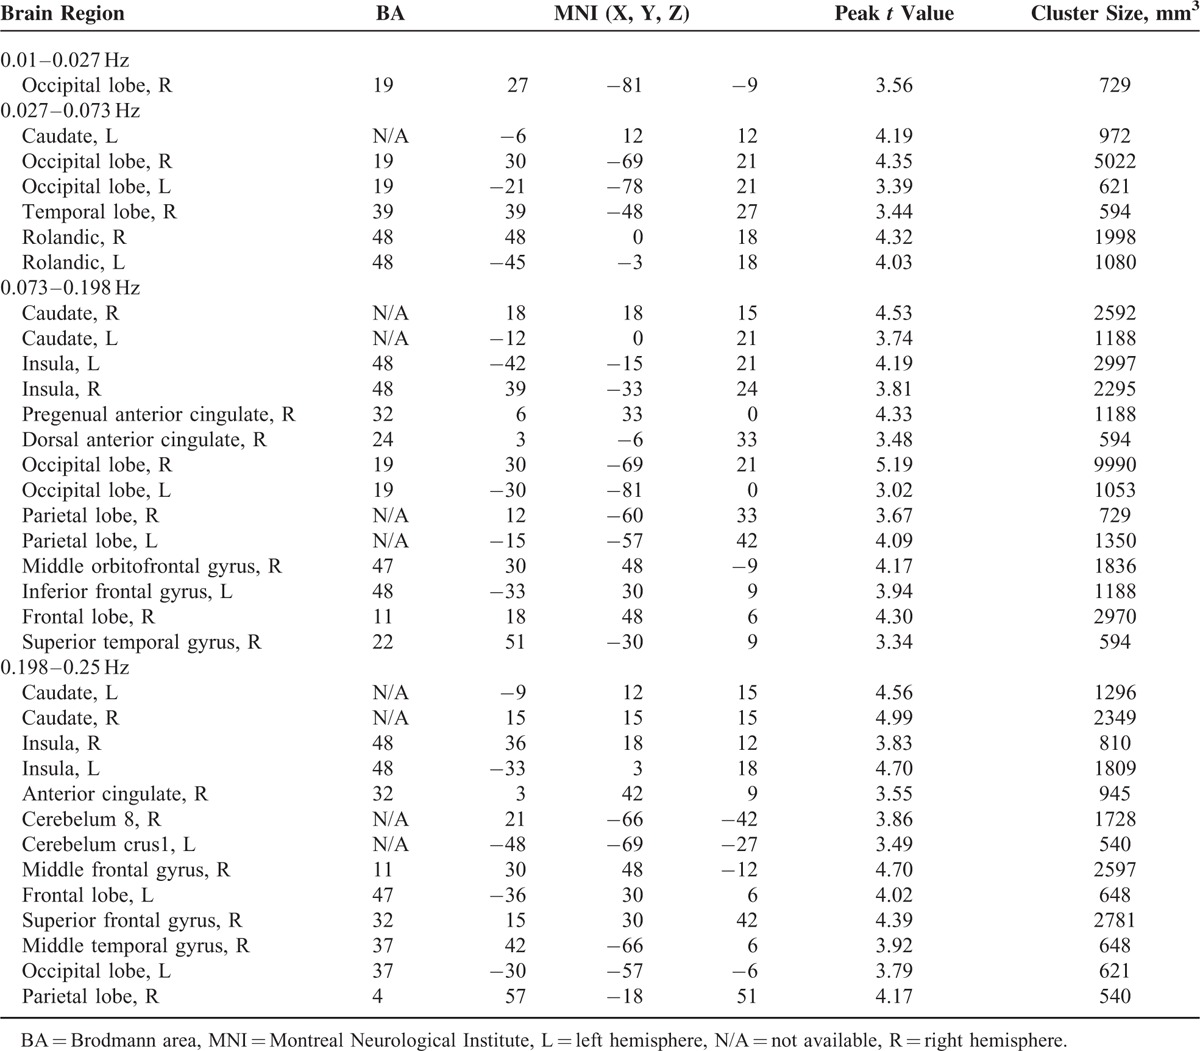
The 2-way repeated-measures ANOVA of local synchronization showed a significant main effect of group (Figure 2, axial maps) and a significant main effect of frequency (data not shown). To localize the brain regions that exhibited alterations in local synchronization in IGE patients, we performed separate voxelwise post hoc 3-sample t tests within group main effect mask for each of the 5 frequency bands (Figure 2, inflated surface maps). The spatial extent of brain regions showing group differences gradually expanded when the frequency ranges increased. The BOLD signal of 5 frequency bands, especially the lower bands (0–0.01, 0.01–0.027, and 0.027–0.073 Hz), showed significantly decreased local synchronization between the 2 groups. IGE patients showed decreased local BOLD oscillation synchronization in lower frequency bands, primarily in the bilateral superior and inferior frontal gyrus, superior and inferior parietal gyrus, and inferior temporal gyrus. These results were consistent with our previous ReHo studies.18 Only the higher frequency bands (0.073–0.198 and 0.198–0.25 Hz) showed significantly increased local synchronization between the 2 groups, especially in the pregenual anterior cingulate cortex (pgACC), dorsal ACC (dACC), and bilateral insular cortices (see Table 2).
FIGURE 2.
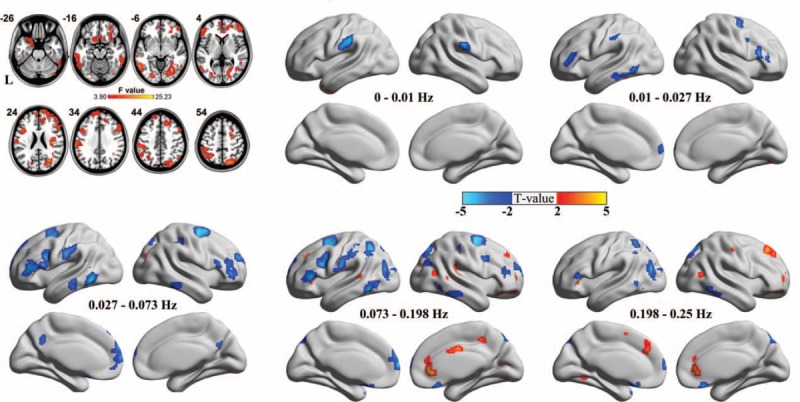
Group main effects and between-group comparison of local frequency-specific synchronization. A 2-way repeated-measure analysis of variance (P < 0.05, corrected) revealed brain regions for which there was a main effect of group on local synchronization (axial maps). The number at the top of each axial image indicates the z coordinate of Montreal Neurological Institute space. L denotes the left hemispheres. Voxelwise post hoc 2-sample t tests (false discovery rate-corrected height threshold P < 0.05, and extent threshold k > 20 voxels) revealed brain regions with between-group differences in local synchronization at each frequency band (inflated surface maps). The warm and cold colors indicate the brain regions with significantly increased and decreased local synchronization, respectively.
TABLE 2.
Brain Regions Showing Statistically Significant Group Differences
Frequency-Specific Alternating of Local Synchronization Pattern
The 2-way repeated-measures ANOVA revealed a significant “frequency by group” interaction effect (Figure 3). The affected brain regions mainly included the anterior and posterior parts of the DMN and subcortical regions, as listed in Table 3. Furthermore, this finding was largely reproduced when using a scrubbing approach to censor “bad” volumes (S-Figure 1, http://links.lww.com/MD/A381). The ROI analysis showed 2 trajectories for “frequency by group” interaction effects (Figure 4). The posterior part of the DMN, insular cortex, and subcortical regions (first 2 rows) showed a trajectory wherein local synchronization increased with frequency more strongly in the IGE compared with the NC. Conversely, the anterior parts of the DMN (bottom row) showed a monotone decrease in local synchronization.
FIGURE 3.
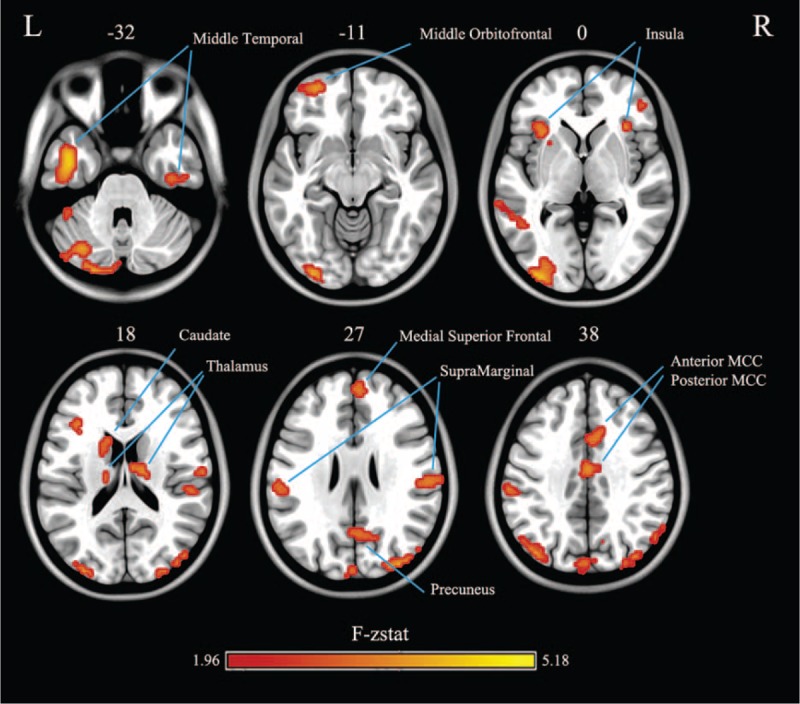
Brain regions showing significant “frequency by group” interaction effects. The colored bars represent the F–z value produced by a 2-way repeated-measures analysis of variance (P < 0.05, combined false discovery rate-corrected height threshold z > 1.96, and extent threshold k > 20 voxels). The number on the top of each axial image indicates the z coordinate in Montreal Neurological Institute space. L and R denote the left and right hemispheres, respectively.
TABLE 3.
Brain Regions Showing Statistically Significant “Frequency by Group” Interaction Effects
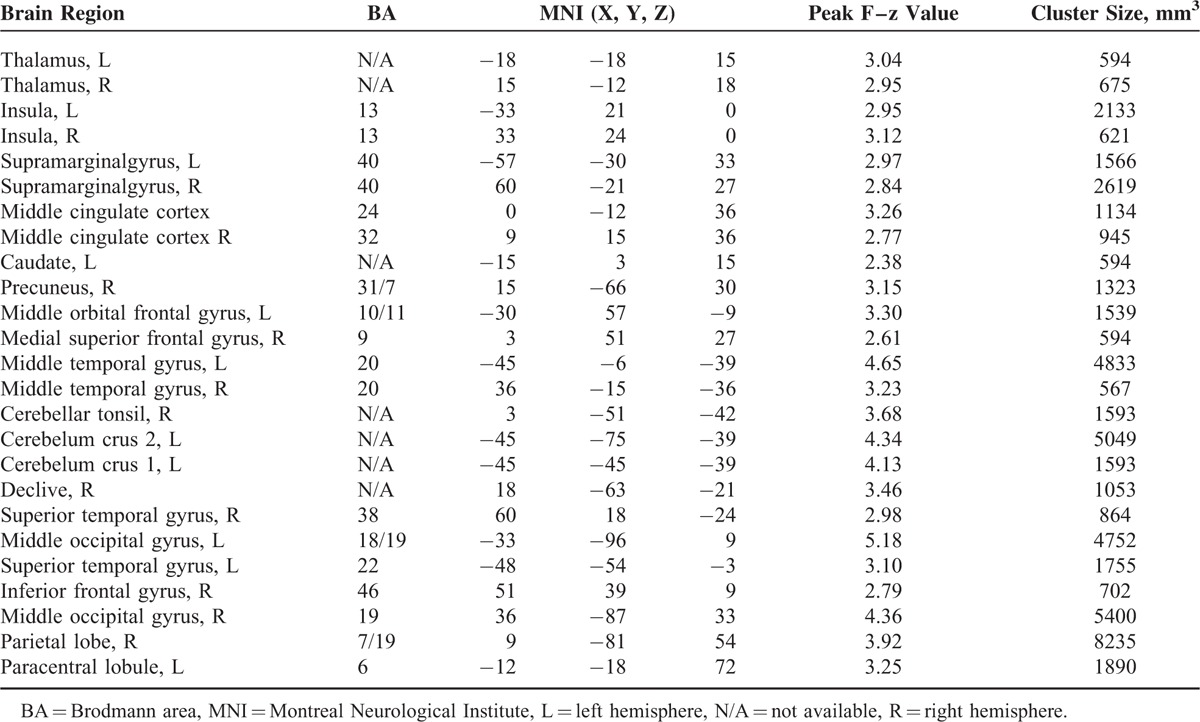
FIGURE 4.
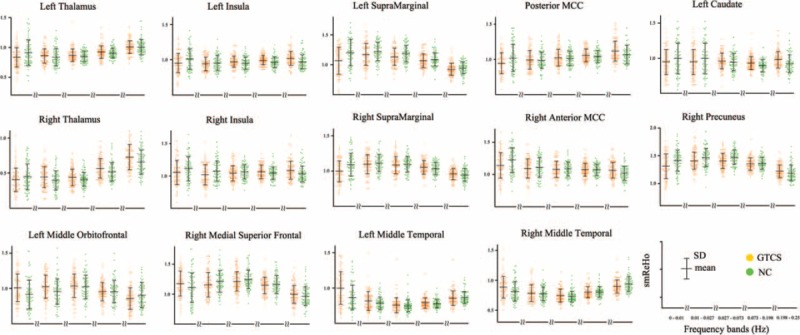
Region of interest (ROI)-based analysis of “frequency by group” interaction effects. These 14 brain regions were selected as ROIs according to the previous studies (see Table 2).
High-Frequency Local Synchronization Associated With Disease Severity
For the clinical relevance analysis, we found a significant correlation in the right middle cingulate cortex at higher frequency bands. The local synchronization (mean ReHo value) of the right middle cingulate cortex positively correlated with seizure frequency (ρ = 0.24, P = 0.03) at the 0.198 to 0.25 Hz band (Figure 5). We found no significant correlation between the local synchronization and the disease duration, onset age, or seizure frequency for the remaining frequency bands.
FIGURE 5.
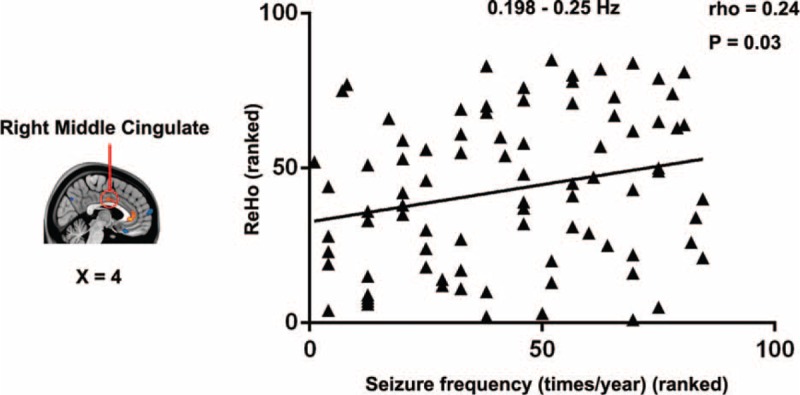
Relationship between local frequency-specific synchronization and clinical variables. The seizure frequency was positively correlated with local synchronization in the right middle cingulate cortex.
DISCUSSION
The previous ReHo analysis at conventional low frequency band would be used to detect intrinsic brain activity in IGE patients, which runs the risk of overlooking meaningful information associated with frequency-specific spontaneous BOLD fluctuation. The current study is the first to specifically investigate frequency-specific alterations of BOLD local synchronization in patients with IGE. First, IGE patients showed decreased local synchronization primarily in the DMN, and predominately at lower frequency bands. However, IGE patients also showed increased frequency-specific local synchronization in the pgACC, dACC, and bilateral insular cortices at higher frequencies. Additionally, we observed a frequency-specific alternation pattern in the DMN such that differences in local synchronization increased with the frequency range. Importantly, the aberrant high-frequency local synchronization in the middle cingulate cortex was associated with disease duration, thus linking BOLD frequency changes to disease severity. Taken together, these findings provide an overall view of frequency-specific local synchronization of BOLD oscillations, and may be useful in uncovering abnormal synchronous neuronal activity in IGE at specific frequency bands.
Full Bandwidth Analysis of Local Synchronization Features
Recent studies have examined resting-state fMRI for higher-frequency BOLD oscillations and functional connectivity in the diseased brain.22,23,30 The present work is a natural extension of our previous resting-state fMRI study, which detected BOLD local synchronization in patients with IGE at low frequencies only (0.01–0.08 Hz).18 Here, we offer some new insights regarding frequency-specific local synchronization spanning the full bandwidth, which agree with and expand upon the findings of a recent report showing varied ReHo across 2 bands.31
Altered Frequency-Specific Local Synchronization in IGE
It is not surprising that we observed altered local synchronization of BOLD fluctuations, primarily in the DMN, in patients with IGE, as this is consistent with the previous findings.18 The resting-state activity of this network seems to be nonspecific, not only because of transient-seizure-suspended DMN activation in various phenotypes of IGE,28,32,33 but also because of long-term functional impairments of the DMN in focal epilepsy.17,34 Interestingly, we found decreased local synchronization predominately in the lower frequency bands (0–0.01, 0.01–0.027, and 0.027–0.073 Hz) (Figure 2). This suggests that frequency-specific functional DMN impairment in patients with IGE is dominated by lower frequency BOLD fluctuations.
Our most remarkable finding was that patients with IGE exhibit significantly increased local synchronization in the pgACC, dACC, and bilateral insular cortices in higher frequency bands (Figure 2). These regions are components of a “conscious perception network,”35 which is associated with conscious perception by synchronized oscillations.36,37 To the best of our knowledge, this finding has for the first time been reported in a human functional neuroimaging study of epilepsy. Generalized tonic–clonic seizures, also named grand mal seizures, are a dramatic type of convulsive seizure. After these convulsive episodes, consciousness is deeply impaired.37 Cerebral blood flow studies have an advantage in that they employ an injection of radiotracer during a seizure attempt. This enables researchers to identify abnormal activity that possibly contributes to the ictal impairment of consciousness.38–40 Our findings support the notion that aberrant local synchronization occurs in the “conscious perception network” in patients with IGE. Note that the pattern of between-group differences that we observed was only found in higher frequency bands, suggesting a frequency-specific disruption. More recently, epilepsy-related high-frequency oscillations in electroencephalography have captured pathological activities, such that they can now be considered new biomarkers of the extent and intensity of epileptogenicity.41 Although the correspondence between the BOLD frequency bands investigated here and EEG rhythms is not well known, it seems possible that the higher frequency band of BOLD fluctuations may play a key role in future clinical therapy. Some therapeutic tools, such as electroconvulsive therapy, have the advantage of controlling timing and producing a relatively consistent seizure onset in an experimental setting.42 Our findings indicate that frequency-specific selection, specifically higher frequencies, could benefit clinical therapies for epilepsy.
Frequency Alternating of Local Synchronization Pattern in IGE
Across 5 frequency bands, we observed 2 distinct trajectories of shift in different networks, along with an increasing frequency range (Figure 4). This suggests a frequency-specific alternating feature of local synchronization in patients with IGE. The posterior portion of the DMN and subcortical regions showed increasing local synchronization as the frequency range increased. Conversely, the anterior portion of the DMN showed a local synchronization shift that decreased in a monotone way. On the one hand, altered local synchronization in both anterior and posterior portions of the DMN reflects the long-term injurious effects of epileptic activity, indicating defective inhibition of the DMN in IGE.6 This finding is consistent with the previous EEG-fMRI and functional connectivity studies.33 On the other hand, the gradual reversal of local synchronization across 5 frequency bands between 2 subnetworks of the DMN indicates that the DMN is modulated by frequency in patients with IGE. Note that the DMN may encompass frequency-specific43 and anatomy-specific subcomponents, which is associated with the hierarchical functions of the default mode.44 This finding leads to a novel pathophysiological perspective: the hierarchical functions of the DMN may correspond with the frequency-specific local synchronization of BOLD fluctuations. Taken together, these results demonstrate that anterior and posterior DMN are implicated in disease and frequency bands, thus extending our understanding of frequency-specific pathology in patients with IGE.
Limitations
There are several limitations of this study. First, 3 IGE subgroups used the current study. Previous studies have suggested that the resting-state functional connectivity pattern varies among IGE subsyndromes.45–48 Owing to the relatively small size of the groups with JAE, we only compared the ReHo pattern between GTCS and JME groups (S-Figure 2, http://links.lww.com/MD/A381). Second, we did not simultaneously acquire scalp EEG, which would have enabled us to exclude fMRI data with GSWDs. Further simultaneous EEG-fMRI data would enable us to examine the specific relationship between local frequency-specific synchronization and interictal epileptic discharges. Third, we did not consider the socioeconomic status for the patients and controls; however, it is unlikely that these factors contributed to the between-groups difference because most of the participants were from middle-class families. Finally, the local synchronization was measured at a low sampling rate (Repetition Time = 2 seconds), which impeded investigations of high-frequency alternation. Future research could use advanced data acquisition sequences to enable whole-brain fMRI scanning at a subsecond temporal resolution.
CONCLUSIONS
The present study examined the frequency-specific local synchronization of BOLD fluctuations during the resting state, taking into account the full bandwidth. First, IGE patients showed decreased local synchronization in low frequency, primarily in the DMN. We also found increased local synchronization in high frequency in the “conscious perception network,” possibly contributing to the impairment of consciousness. Additionally, we found frequency-specific alternation of local synchronization in the posterior portion of the DMN, suggesting an interaction between epilepsy and frequency bands. Importantly, the aberrant higher-frequency local synchronization in the middle cingulate cortex was associated with disease duration, thus linking BOLD frequency-specific changes to disease severity. In general, these findings provide an overall view of frequency-specific local synchronization of BOLD fluctuations, and may have potential in uncovering abnormal synchronous neuronal activity at specific frequency bands in patients with IGE.
Footnotes
Abbreviations: IGE = idiopathic generalized epilepsy, GSWDs = generalized spike-wave discharges, EEG-fMRI = electroencephalography and functional magnetic resonance imaging, DMN = default mode network, RS-fMRI = resting-state fMRI, ReHo = regional homogeneity, BOLD = blood oxygenation level dependent, NC = normal controls, ANOVA = analysis of variance, AAL = automated anatomical labeling, FDR = false discovery rate, ROIs = regions of interest, ACC = anterior cingulate cortex.
JW and ZZ equally contributed to this work.
This work was supported by the Natural Science Foundation of China (Grant nos. 81020108022 to Y-FZ; 81271553 and 81422022 to ZZ; 81401400 to G-JJ; 81401402 to QX; 81171328 to QJ; 81201078 to FY; 81301198 to ZW; and 81201155 and 81471653 to WL), the 863 Project (grant no. 2015AA020505 to ZZ), the “Qian Jiang Distinguished Professor” program (Y-FZ), the grants for Young Scholars at Jinling Hospital (Grant nos. Q2008063 and 2011060), and the China Postdoctoral Science Foundation (Grant no. 2013M532229 to WL). The funders had no role in study design, data collection and analysis, decision to publish, or preparation of the manuscript.
The authors have no conflicts of interest to disclose.
Supplemental digital content is available for this article. Direct URL citations appear in the printed text and are provided in the HTML and PDF versions of this article on the journal's Website (www.jpgn.org).
REFERENCES
- 1.Chang BS, Lowenstein DH. Epilepsy. N Engl J Med 2003; 349:1257–1266. [DOI] [PubMed] [Google Scholar]
- 2.Stefan H, Lopes da Silva FH. Epileptic neuronal networks: methods of identification and clinical relevance. Front Neurol 2013; 4:8. [DOI] [PMC free article] [PubMed] [Google Scholar]
- 3.Seneviratne U, Cook M, D'Souza W. Focal abnormalities in idiopathic generalized epilepsy: a critical review of the literature. Epilepsia 2014; 55:1157–1169. [DOI] [PubMed] [Google Scholar]
- 4.Richardson MP. Large scale brain models of epilepsy: dynamics meets connectomics. J Neurol Neurosurg Psychiatry 2012; 83:1238–1248. [DOI] [PubMed] [Google Scholar]
- 5.Ponten SC, Douw L, Bartolomei F, et al. Indications for network regularization during absence seizures: weighted and unweighted graph theoretical analyses. Exp Neurol 2009; 217:197–204. [DOI] [PubMed] [Google Scholar]
- 6.Gotman J, Grova C, Bagshaw A, et al. Generalized epileptic discharges show thalamocortical activation and suspension of the default state of the brain. Proc Natl Acad Sci USA 2005; 102:15236–15240. [DOI] [PMC free article] [PubMed] [Google Scholar]
- 7.Danielson NB, Guo JN, Blumenfeld H. The default mode network and altered consciousness in epilepsy. Behav Neurol 2011; 24:55–65. [DOI] [PMC free article] [PubMed] [Google Scholar]
- 8.Barkhof F, Haller S, Rombouts SA. Resting-state functional MR imaging: a new window to the brain. Radiology 2014; 272:29–49. [DOI] [PubMed] [Google Scholar]
- 9.Vlooswijk MC, Jansen JF, de Krom MC, et al. Functional MRI in chronic epilepsy: associations with cognitive impairment. Lancet Neurol 2010; 9:1018–1027. [DOI] [PubMed] [Google Scholar]
- 10.Liao W, Zhang Z, Mantini D, et al. Dynamical intrinsic functional architecture of the brain during absence seizures. Brain Struct Funct 2014; 219:2001–2015. [DOI] [PubMed] [Google Scholar]
- 11.Liao W, Zhang Z, Pan Z, et al. Altered functional connectivity and small-world in mesial temporal lobe epilepsy. PLoS One 2010; 5:e8525. [DOI] [PMC free article] [PubMed] [Google Scholar]
- 12.Zang Y, Jiang T, Lu Y, et al. Regional homogeneity approach to fMRI data analysis. Neuroimage 2004; 22:394–400. [DOI] [PubMed] [Google Scholar]
- 13.Leopold DA, Murayama Y, Logothetis NK. Very slow activity fluctuations in monkey visual cortex: implications for functional brain imaging. Cereb Cortex 2003; 13:422–433. [DOI] [PubMed] [Google Scholar]
- 14.Wurina, Zang YF, Zhao SG. Resting-state fMRI studies in epilepsy. Neurosci Bull 2012; 28:449–455. [DOI] [PMC free article] [PubMed] [Google Scholar]
- 15.Mankinen K, Long XY, Paakki JJ, et al. Alterations in regional homogeneity of baseline brain activity in pediatric temporal lobe epilepsy. Brain Res 2011; 1373:221–229. [DOI] [PubMed] [Google Scholar]
- 16.Weaver KE, Chaovalitwongse WA, Novotny EJ, et al. Local functional connectivity as a pre-surgical tool for seizure focus identification in non-lesion, focal epilepsy. Front Neurol 2013; 4:43. [DOI] [PMC free article] [PubMed] [Google Scholar]
- 17.Zeng H, Pizarro R, Nair VA, et al. Alterations in regional homogeneity of resting-state brain activity in mesial temporal lobe epilepsy. Epilepsia 2013; 54:658–666. [DOI] [PMC free article] [PubMed] [Google Scholar]
- 18.Zhong Y, Lu G, Zhang Z, et al. Altered regional synchronization in epileptic patients with generalized tonic-clonic seizures. Epilepsy Res 2011; 97:83–91. [DOI] [PubMed] [Google Scholar]
- 19.Gohel SR, Biswal BB. Functional integration between brain regions at rest occurs in multiple-frequency bands. Brain Connect 2015; 5:23–34. [DOI] [PMC free article] [PubMed] [Google Scholar]
- 20.Chen JE, Glover GH. BOLD fractional contribution to resting-state functional connectivity above 0.1 Hz. Neuroimage 2015; 107:207–218. [DOI] [PMC free article] [PubMed] [Google Scholar]
- 21.Niazy RK, Xie J, Miller K, et al. Spectral characteristics of resting state networks. Prog Brain Res 2011; 193:259–276. [DOI] [PubMed] [Google Scholar]
- 22.Baliki MN, Baria AT, Apkarian AV. The cortical rhythms of chronic back pain. J Neurosci 2011; 31:13981–13990. [DOI] [PMC free article] [PubMed] [Google Scholar]
- 23.Malinen S, Vartiainen N, Hlushchuk Y, et al. Aberrant temporal and spatial brain activity during rest in patients with chronic pain. Proc Natl Acad Sci USA 2010; 107:6493–6497. [DOI] [PMC free article] [PubMed] [Google Scholar]
- 24.Buzsaki G, Draguhn A. Neuronal oscillations in cortical networks. Science 2004; 304:1926–1929. [DOI] [PubMed] [Google Scholar]
- 25.Penttonen M, Buzsaki G. Natural logarithmic relationship between brain oscillators. Thalamus Relat Syst 2003; 2:145–152. [Google Scholar]
- 26.Zuo XN, Di Martino A, Kelly C, et al. The oscillating brain: complex and reliable. Neuroimage 2010; 49:1432–1445. [DOI] [PMC free article] [PubMed] [Google Scholar]
- 27.Song X, Zhang Y, Liu Y. Frequency specificity of regional homogeneity in the resting-state human brain. PLoS One 2014; 9:e86818. [DOI] [PMC free article] [PubMed] [Google Scholar]
- 28.Wang Z, Zhang Z, Liao W, et al. Frequency-dependent amplitude alterations of resting-state spontaneous fluctuations in idiopathic generalized epilepsy. Epilepsy Res 2014; 108:853–860. [DOI] [PubMed] [Google Scholar]
- 29.Power JD, Barnes KA, Snyder AZ, et al. Spurious but systematic correlations in functional connectivity MRI networks arise from subject motion. Neuroimage 2012; 59:2142–2154. [DOI] [PMC free article] [PubMed] [Google Scholar]
- 30.Esposito F, Tessitore A, Giordano A, et al. Rhythm-specific modulation of the sensorimotor network in drug-naive patients with Parkinson's disease by levodopa. Brain 2013; 136:710–725. [DOI] [PubMed] [Google Scholar]
- 31.Yu R, Hsieh MH, Wang HL, et al. Frequency dependent alterations in regional homogeneity of baseline brain activity in schizophrenia. PLoS One 2013; 8:e57516. [DOI] [PMC free article] [PubMed] [Google Scholar]
- 32.Luo C, Li Q, Lai Y, et al. Altered functional connectivity in default mode network in absence epilepsy: a resting-state fMRI study. Hum Brain Mapp 2011; 32:438–449. [DOI] [PMC free article] [PubMed] [Google Scholar]
- 33.Moeller F, Maneshi M, Pittau F, et al. Functional connectivity in patients with idiopathic generalized epilepsy. Epilepsia 2011; 52:515–522. [DOI] [PMC free article] [PubMed] [Google Scholar]
- 34.Zhang Z, Lu G, Zhong Y, et al. fMRI study of mesial temporal lobe epilepsy using amplitude of low-frequency fluctuation analysis. Hum Brain Mapp 2010; 31:1851–1861. [DOI] [PMC free article] [PubMed] [Google Scholar]
- 35.De Ridder D, Elgoyhen AB, Romo R, et al. Phantom percepts: tinnitus and pain as persisting aversive memory networks. Proc Natl Acad Sci USA 2011; 108:8075–8080. [DOI] [PMC free article] [PubMed] [Google Scholar]
- 36.Timofeev I, Steriade M. Neocortical seizures: initiation, development and cessation. Neuroscience 2004; 123:299–336. [DOI] [PubMed] [Google Scholar]
- 37.Blumenfeld H. Impaired consciousness in epilepsy. Lancet Neurol 2012; 11:814–826. [DOI] [PMC free article] [PubMed] [Google Scholar]
- 38.Blumenfeld H. Epilepsy and the consciousness system: transient vegetative state? Neurol Clin 2011; 29:801–823. [DOI] [PMC free article] [PubMed] [Google Scholar]
- 39.Seri S, Brazzo D, Thai NJ, et al. Brain mechanisms of altered consciousness in generalised seizures. Behav Neurol 2011; 24:43–46. [DOI] [PMC free article] [PubMed] [Google Scholar]
- 40.Vetrugno R, Mascalchi M, Vella A, et al. Paroxysmal arousal in epilepsy associated with cingulate hyperperfusion. Neurology 2005; 64:356–358. [DOI] [PubMed] [Google Scholar]
- 41.Zijlmans M, Jiruska P, Zelmann R, et al. High-frequency oscillations as a new biomarker in epilepsy. Ann Neurol 2012; 71:169–178. [DOI] [PMC free article] [PubMed] [Google Scholar]
- 42.McNally KA, Blumenfeld H. Focal network involvement in generalized seizures: new insights from electroconvulsive therapy. Epilepsy Behav 2004; 5:3–12. [DOI] [PubMed] [Google Scholar]
- 43.Baria AT, Baliki MN, Parrish T, et al. Anatomical and functional assemblies of brain BOLD oscillations. J Neurosci 2011; 31:7910–7919. [DOI] [PMC free article] [PubMed] [Google Scholar]
- 44.Andrews-Hanna JR, Smallwood J, Spreng RN. The default network and self-generated thought: component processes, dynamic control, and clinical relevance. Ann NY Acad Sci 2014; 1316:29–52. [DOI] [PMC free article] [PubMed] [Google Scholar]
- 45.O’Muircheartaigh J, Vollmar C, Barker GJ, et al. Abnormal thalamocortical structural and functional connectivity in juvenile myoclonic epilepsy. Brain 2012; 135:3635–3644. [DOI] [PMC free article] [PubMed] [Google Scholar]
- 46.Vollmar C, O’Muircheartaigh J, Barker GJ, et al. Motor system hyperconnectivity in juvenile myoclonic epilepsy: a cognitive functional magnetic resonance imaging study. Brain 2011; 134:1710–1719. [DOI] [PMC free article] [PubMed] [Google Scholar]
- 47.Vollmar C, O’Muircheartaigh J, Symms MR, et al. Altered microstructural connectivity in juvenile myoclonic epilepsy: the missing link. Neurology 2012; 78:1555–1559. [DOI] [PMC free article] [PubMed] [Google Scholar]
- 48.Kim JB, Suh SI, Seo WK, et al. Altered thalamocortical functional connectivity in idiopathic generalized epilepsy. Epilepsia 2014; 55:592–600. [DOI] [PubMed] [Google Scholar]


